. 2008 Jul 18;29(1):44-56.
doi: 10.1016/j.immuni.2008.05.007. Epub 2008 Jun 26.

Molecular antagonism and plasticity of regulatory and inflammatory T cell programs

Affiliations

Molecular antagonism and plasticity of regulatory and inflammatory T cell programs

Xuexian O Yang et al. Immunity. .

Abstract

Regulatory T (Treg) and T helper 17 (Th17) cells were recently proposed to be reciprocally regulated during differentiation. To understand the underlying mechanisms, we utilized a Th17 reporter mouse with a red fluorescent protein (RFP) sequence inserted into the interleukin-17F (IL-17F) gene. Using IL-17F-RFP together with a Foxp3 reporter, we found that the development of Th17 and Foxp3(+) Treg cells was associated in immune responses. Although TGF-beta receptor I signaling was required for both Foxp3 and IL-17 induction, SMAD4 was only involved in Foxp3 upregulation. Foxp3 inhibited Th17 differentiation by antagonizing the function of the transcription factors RORgammat and ROR*. In contrast, IL-6 overcame this suppressive effect of Foxp3 and, together with IL-1, induced genetic reprogramming in Foxp3(+) Treg cells. STAT3 regulated Foxp3 downregulation, whereas STAT3, RORgamma, and ROR* were required for IL-17 expression in Treg cells. Our data demonstrate molecular antagonism and plasticity of Treg and Th17 cell programs.


Figures

Figure 1
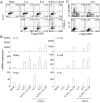
Figure 1. IL-17F-RFP reporter is highly expressed in Th17 cells generated in vitro and in vivo
(A) FACS-sorted naïve CD4+CD25-CD62LhiCD44lo T cells from Il17frfp mice were activated under the Th1, Th2, Th17 and inducible regulatory T cell (iTreg) conditions with plate-bound anti-CD3 and anti-CD28 for 4-5 days and RFP (IL-17F) expression was analyzed by FACS. (B) RFP+ and RFP- cells from above Th17 culture were sorted by FACS and rested for 24 h. The cells were then restimulated by PMA and Ionomycin for 5 h and IL-17- and IL-17F-expressing cells were assessed by intracellular staining. Data shown represent at least 3 independent experiments. (C) Naïve T cells from Il17frfp mice were activated in the presence the indicated cytokine stimuli for 3-5 days. The cells were then analyzed for RFP expression by FACS. Data shown were repeated twice with consistent results. Numbers represent percentage of RFP+ cells. (D-F) IL-17F-RFP reporter expression in Th17 cells generated in EAE. (D) Il17frfp and WT mice were immunized by MOG + CFA for 5 days and RFP expression were analyzed by FACS after ex vivo recalled by MOG peptide. Data shown were on a CD4+ gate. (E) IL-17F-RFP expression in CD4+ T cells from CNS of EAE mice. EAE was induced in Il17frfp and WT mice and infiltrates from the CNS of the EAE mice were isolated at the clinic score 3. IL-17F-RFP expression was analyzed by FACS in a CD4+ gate. Data shown represent at least 3 mice from each group with consistent results. (F) RFP+ and RFP- CD4+ cells were sorted from CNS of Il17frfp EAE mice and gene expression profile was analyzed by real-time RT-PCR. Data were normalized to a reference gene Actb. The lower expression for each gene was referred as 1. Graph shows means ± s.d.
Figure 2
Figure 2. Reciprocal Th17 and iTreg differentiation
(A) Naïve T cells from Il17frfp Foxp3gfp mice were activated in the presence of IL-2 under iTreg (TGF-β, anti-IL-4 and anti-IFN-γ) or Th17 (TGF-β and IL-6) conditions for 1-4 days. IL-17F-RFP and Foxp3-GFP expression were assessed daily by FACS. Data shown were repeated twice with consistent results. (B) On day3, RFP+ and RFP- subsets were sorted on a GFP+ gate from the iTreg culture and gene expression was assessed by real-time RT-PCR. Data shown were normalized to expression of a reference gene Actb. The lower expression for each gene was referred as 1. Graph shows means ± s.d. (C) MACS-enriched splenic (SP) and laminal propria (LP) CD4+ cells from unmanipulated (No, no immunization) Il17frfpFoxp3gfp mice were restimulated with anti-CD3 and IL-23 for 24 h and expression of RFP and GFP was analyzed by flow cytometry. In addition, CD4 cells were enriched by MACS from spleen and draining lymph nodes of the MOG + CFA immunized wild-type (WT) or Il17frfp/Foxp3gfp mice and RFP and GFP expression were assessed by FACS after MOG restimulation. (A, C) Numbers in each quadrant represent the percentage of cells.
Figure 3
Figure 3. TGF-β signaling requirements in the generation of Th17 or iTreg cells
FACS-sorted naïve T cells from B6 mice were activated under (A-B) Th17 (TGF-β + IL-6 + IL-23 + anti-IFN-γ + anti-IL-4) or (C) iTreg conditions, and a TGF-βRI kinase inhibitor (SB431542, 5μM) was added at different time points as indicated. Cells were assessed for IL-17 and IFN-γ production and Foxp3 expression after 4 days of stimulation using intracellular staining. (A, C) A representative dot plot graph is shown in the left panel, and the numbers in quadrants represent the percentages. In the right panel, the percentage of (A) IL-17+ or (C) Foxp3+ cells for six independent experiments are indicated. *, p<0.05, Wilcoxon signed rank test. (B) mRNA expression of indicated genes was analyzed by real-time RT-PCR. The data shown was normalized to expression of a reference gene Actb. The lowest expression for each gene was referred as 1. (D) Naïve T cells from Smad4fl/flCD4-Cre- (WT) or Smad4fl/fl CD4-Cre+ (Smad4-/-) mice were cultured with or without WT or Smad4-/- CD4+CD25+ nTreg cells in triplicate wells with irradiated APCs and stimulated with 2 μg/ml of anti-CD3. Proliferation was assayed 72 h after treatment by adding [3H]-thymidine to the culture for the last 8 h. A representative example of three independent experiments is shown. (A-D) Graph shows means ± s.d. (E-F) Naïve Smad4-sufficient or -deficient T cells were activated under (E) iTreg or (F) Th17 conditions, and IL-17, IFN-γ and Foxp3 expression was analyzed by intracellular staining. Numbers in quadrants represent the percentages. The experiments were repeated three times with consistent results.
Figure 4
Figure 4. Foxp3 inhibits Th17 cell cytokine induction by antagonizing RORγt function
(A) FACS-sorted naïve OT-II T cells were activated under Th17 conditions and infected with an IRES-GFP-containing bicistronic retrovirus expressing Foxp3 or a vector control virus. IL-17- and Foxp3-expressing cells were measured by intracellular staining on the GFP- and GFP+ population. The experiments were repeated at least three times with similar results. (B) GFP- and GFP+ cells were sorted from (A) and restimulated for 4 hours with anti-CD3. mRNA expression of indicated genes was analyzed by real-time RT-PCR. The data shown were normalized to expression of a reference gene Actb. The lowest expression for each gene was referred as 1. *, p<0.05, t test. (C-F) EL-4 cells were transfected with a vector containing the firefly luciferase gene under the control of the Il17a promoter-CNS2 region, a vector expressing Renilla luciferase, and IRES-GFP-containing bicistronic vectors expressing RORγt, Foxp3 wild-type (WT) or various Foxp3 mutants, or vector alone. Luciferase activity was determined and normalized to Renilla luciferase. Values were also normalized to vector alone. The data represent at least four independent experiments with consistent results. *, p<0.05, t test. (B-F) Graph shows means ± s.d. (G) Naïve OT-II T cells were activated under Th17 conditions and infected with indicated viruses. IL-17 expression was analyzed by intracellular staining on either GFP+ or GFP- gate. (H) Naïve WT or Scurfy OT-II T cells were stimulated with the indicated cytokines and neutralizing antibodies. Four days later, cells were assessed for IFN-γ and IL-17 production by intracellular staining. The data represent at least three independent experiments with consistent results.
Figure 5
Figure 5. Generation of IL-17-producing cells from inducible regulatory T cells
(A-B) FACS sorted CD4+Foxp3-GFP-CD44low T cells from Foxp3-GFP mice were stimulated under iTreg polarizing conditions (TGF-β, IL-2, anti-IFN-γ and anti-IL-4) for 5 days. Foxp3-GFP+ cells were FACS-sorted and stimulated with plate-bound anti-CD3 and anti-CD28 in the presence of the indicated cytokines. (A) 4 days later, IL-17 and Foxp3-GFP expression was determined by flow cytometry, and (B) mRNA expression of indicated genes was analyzed by real-time RT-PCR. Numbers in FACS quadrants represent the percentages. The data shown in B was normalized to expression of a reference gene Actb. The lowest expression for each gene was referred as 1. Graph shows means ± s.d. The data represent at least three independent experiments with consistent results. (C) Naive T cells from Il17frft/Foxp3gfp mice were stimulated with plate-bound anti-CD3, anti-CD28, TGF-β, IL-2 in the presence or absence of all-trans retinoic acid (RA). 3 days later, Foxp3-GFP+IL-17F-RFP- cells were sorted and cultured with plate-bound anti-CD3 and anti-CD28 in the presence of TGF-β, IL-1, IL-6 and IL-23. 4 days later, IL-17, IL-17F-RFP and Foxp3-GFP expression was determined by flow cytometry. Numbers in FACS quadrants represent the percentages. The data represent at least two independent experiments with consistent results.
Figure 6
Figure 6. Conversion of natural regulatory T cells into Th17 cells
(A) FACS-sorted CD4+CD25+ T cells from B6 mice were stimulated with plate-bound anti-CD3 and anti-CD28 in the presence of indicated cytokines. 4 days later, cells were assessed for IL-17 and Foxp3 expression using intracellular staining. (B) FACS-sorted CD4+CD25+ T cells from IL-17F-RFP reporter mice were activated with anti-CD3, anti-CD28 and with IL-6 for 4 days. RFP expression was analyzed by flow cytometry. (C) RFP+ and RFP- cells were sorted from (B) for suppression assays. Naïve T cells from B6 mice were cultured in triplicate wells with or without CD4+CD25+ T cells from B6 mice or the sorted RFP+ or RFP- cells in the presence of irradiated APC and 2 μg/ml anti-CD3. Proliferation was assayed 72 h later by adding [3H]-thymidine to the culture for the last 8 h. Graph shows means ± s.d. The data represent at least two independent experiments with consistent results. (D). CD4+GFP+ cells from Foxp3-GFP reporter mice (CD45.2+) and CD4+CD25-CD62LhiCD44lo cells (CD45.1+) from B6.SJL congenic mice were FACS-sorted and mixed at 1:10 ratio before intravenously transferred into Rag1-/- syngenic mice (5 × 10⁶ cells/mouse, n=3). The recipient mice were immunized subcutaneously with 150 μg of MOG35-55 peptide emulsified in CFA. Five days later, lymphoid cells from spleens were isolated and restimulated with MOG or PMA + Ionomycin before IL-17 and Foxp3-GFP expression was determined by flow cytometry for each individual mouse. A representative result is shown.
Figure 7
Figure 7. Molecular requirement in nTreg conversion into Th17 cells
(A) FACS-sorted CD4+Foxp3-GFP+ T cells from Foxp3-GFP reporter mice were stimulated with plate-bound anti-CD3 and anti-CD-28 in the presence of the indicated cytokines with or without anti-TGF-β (10μg/ml) for 4 days. Cells were analyzed for IL-17 and GFP expression. (B) CD4+Foxp3-GFP+ T cells from Il17frfp-Foxp3gfp mice were stimulated in the presence of IL-6, IL-1 and IL-23 for indicated days, and IL-17F-RFP and Foxp3-GFP expression was determined by flow cytometry. (C-E) CD4+CD25+ T cells from wild-type (WT) and (C) Stat3-, (D) RORγ- or RORγ/α- or (E) IL-21-deficient mice were stimulated in the presence of indicated cytokines. 4 days later, cells were assessed for Foxp3 and IL-17 expression by intracellular staining. Numbers in quadrants represent the percentages. The data represent at least three independent experiments with consistent results.

Comment in

Similar articles

Cited by

References

    1. Bettelli E, Carrier Y, Gao W, Korn T, Strom TB, Oukka M, Weiner HL, Kuchroo VK. Reciprocal developmental pathways for the generation of pathogenic effector TH17 and regulatory T cells. Nature. 2006;441:235–238. - PubMed
    1. Chae WJ, Henegariu O, Lee SK, Bothwell AL. The mutant leucine-zipper domain impairs both dimerization and suppressive function of Foxp3 in T cells. Proc Natl Acad Sci U S A. 2006;103:9631–9636. - PMC - PubMed
    1. Chu GC, Dunn NR, Anderson DC, Oxburgh L, Robertson EJ. Differential requirements for Smad4 in TGF{beta}-dependent patterning of the early mouse embryo. Development. 2004;131:3501–3512. - PubMed
    1. Cobaleda C, Jochum W, Busslinger M. Conversion of mature B cells into T cells by dedifferentiation to uncommitted progenitors. Nature. 2007;449:473–477. - PubMed
    1. Dong C. TH17 cells in development: an updated view of their molecular identity and genetic programming. Nat Rev Immunol. 2008;8:337–348. - PubMed

Publication types

MeSH terms

Substances