. 2008 Jun 27;133(7):1228-40.
doi: 10.1016/j.cell.2008.05.025.

Mechanism of local and global Ca2+ sensing by calmodulin in complex with a Ca2+ channel

Affiliations

Mechanism of local and global Ca2+ sensing by calmodulin in complex with a Ca2+ channel

Michael R Tadross et al. Cell. .

Abstract

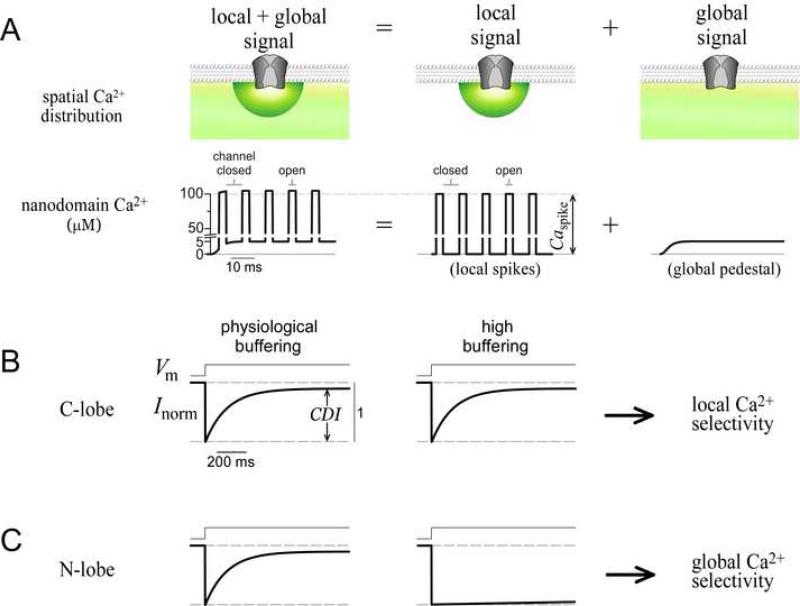
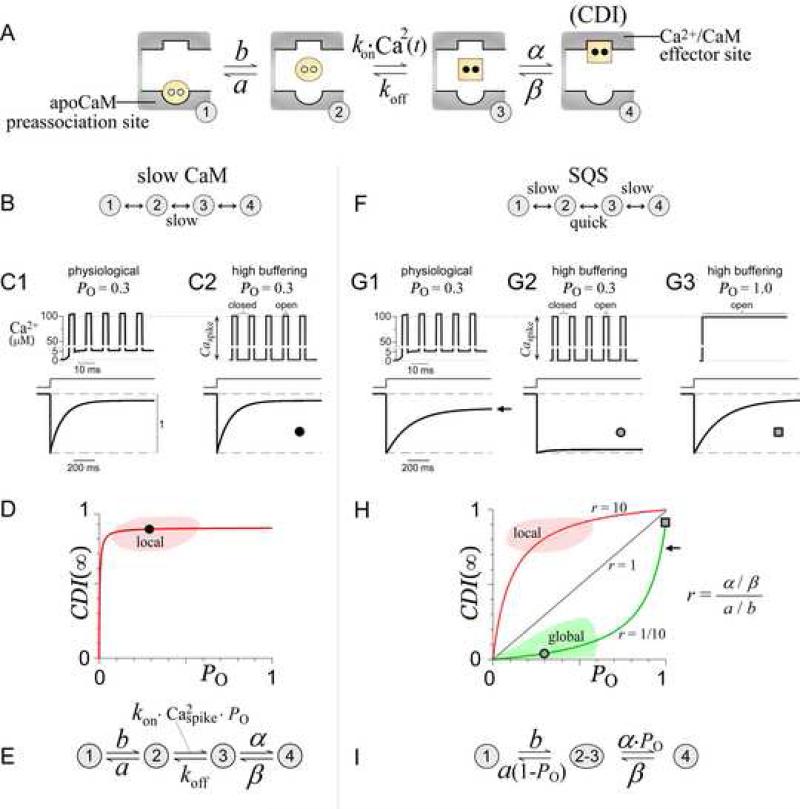
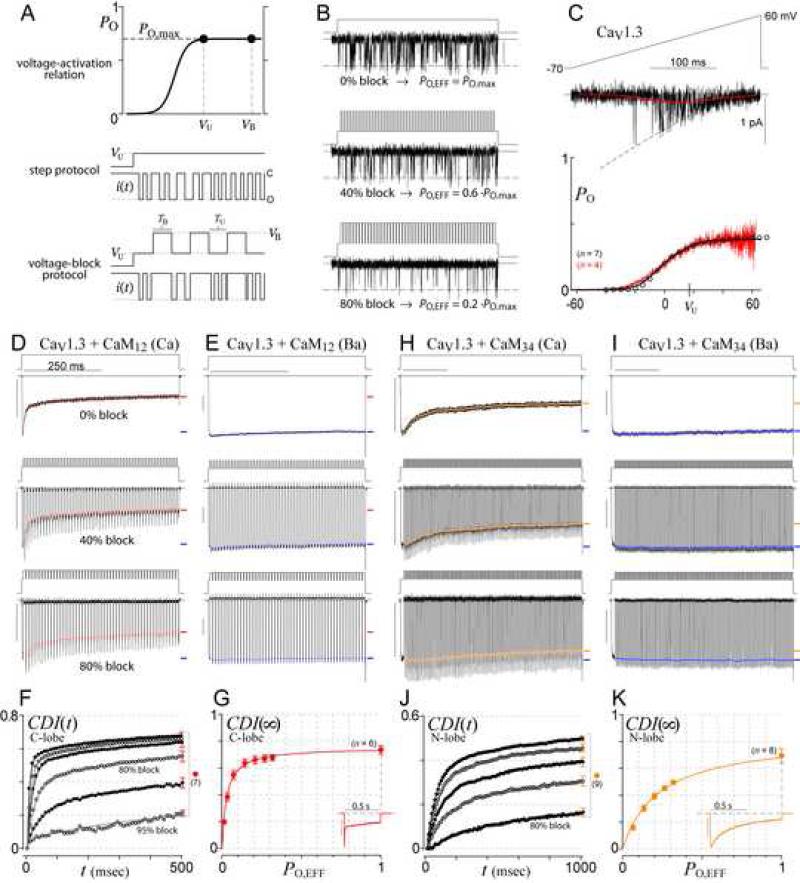
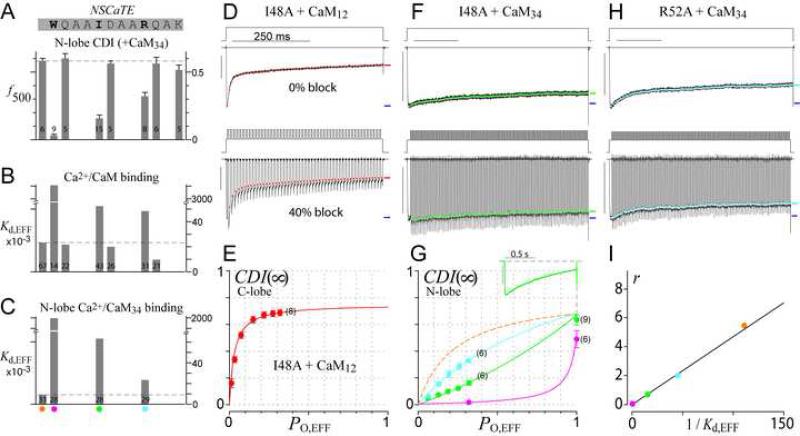
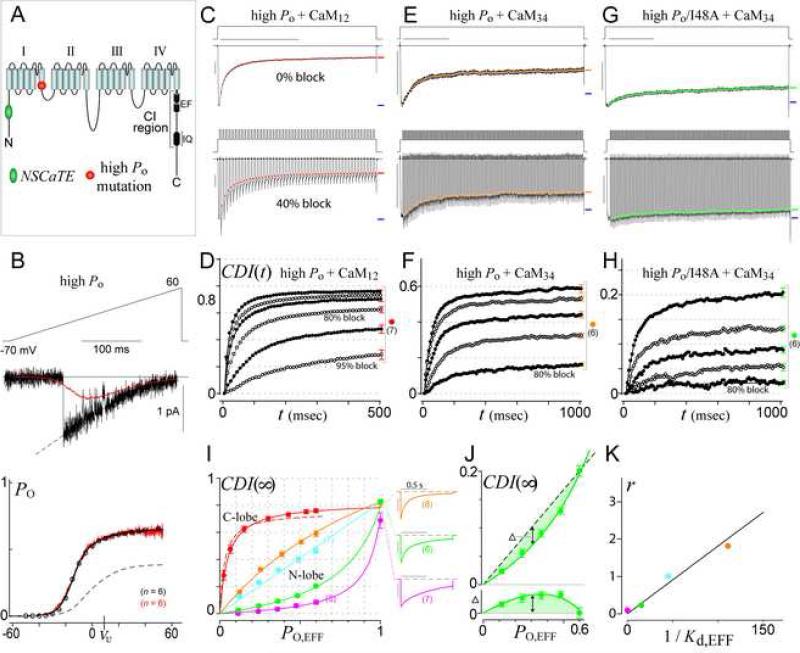
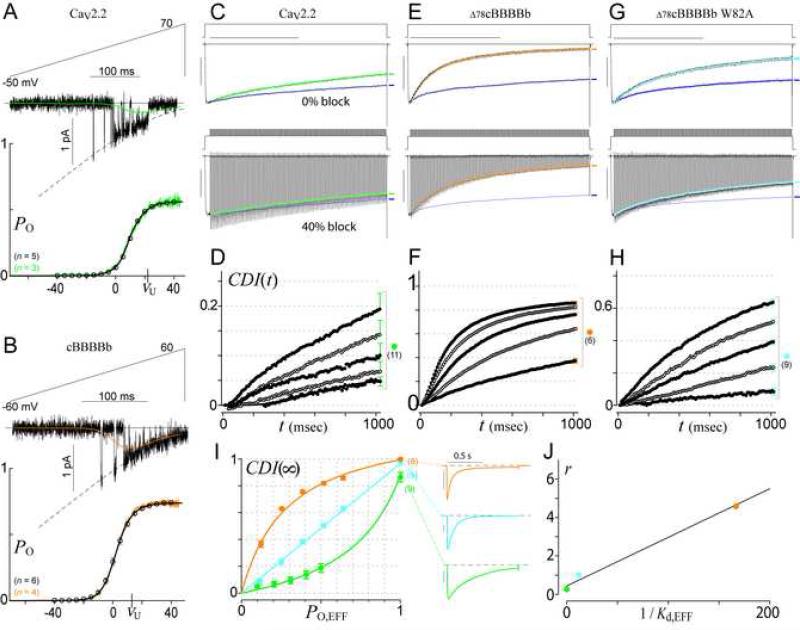
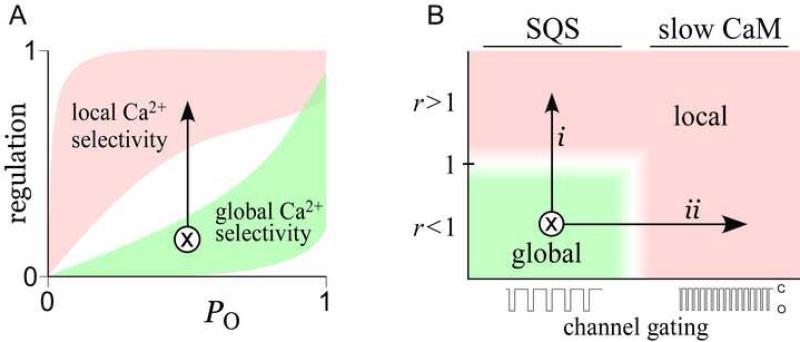
Calmodulin (CaM) in complex with Ca(2+) channels constitutes a prototype for Ca(2+) sensors that are intimately colocalized with Ca(2+) sources. The C-lobe of CaM senses local, large Ca(2+) oscillations due to Ca(2+) influx from the host channel, and the N-lobe senses global, albeit diminutive Ca(2+) changes arising from distant sources. Though biologically essential, the mechanism underlying global Ca(2+) sensing has remained unknown. Here, we advance a theory of how global selectivity arises, and we experimentally validate this proposal with methodologies enabling millisecond control of Ca(2+) oscillations seen by the CaM/channel complex. We find that global selectivity arises from rapid Ca(2+) release from CaM combined with greater affinity of the channel for Ca(2+)-free versus Ca(2+)-bound CaM. The emergence of complex decoding properties from the juxtaposition of common elements, and the techniques developed herein, promise generalization to numerous molecules residing near Ca(2+) sources.


Figures

Figure 1
Figure 1. Definition of spatial selectivity
(A) Cartoon of Ca2+ signals near a channel. Spatial (top row) and temporal (bottom row) profiles are shown. Note axis break in nanodomain Ca2+. Composite signal (left column) is the sum of local (middle column) and global (right column) components. (B) Schematic of C-lobe CDI, which exemplifies local selectivity. Intracellular buffering conditions cause the Ca2+ input signals to correspond to those shown directly above in (A). (C) Schematic of N-lobe CDI, which exemplifies global selectivity, buffering as in (B).
Figure 2
Figure 2. Ca2+ decoding mechanisms for the CaM/channel complex
(A) Basic states for a lobe of CaM in complex with a Ca2+ channel. In state 1, apoCaM (yellow circle) is bound to the apoCaM site (round pocket). In state 2, apoCaM is a transiently dissociated. In state 3, CaM binds two Ca2+ ions (black dots) to become Ca2+/CaM (yellow square), which can then bind the Ca2+/CaM effector site (square pocket), yielding CDI (state 4). (B) Slow CaM mechanism, configurations of the basic system where switching between states 2 and 3 is slow relative to channel gating. (C) Slow CaM numerical simulations exhibit local selectivity. Ca2+ signals (top) are given as input. Note Ca2+ axis break in panels C and G. Parameters (in ms-1) α = 0.5, β = 0.05, a = 60, b = 0.04, koff = 0.003, and kon = 1.2×10¹⁰ M-2 ms-1. (D) Slow CaM CDI(∞)–PO relations exhibit local Ca2+ selectivity. Round symbol corresponds to simulation in (C2). Red curve corresponds to Equation 1, with parameters as in (C). (E) Equivalent slow-CaM mechanism (see Supplementary Information 2). (F) SQS mechanism has slow state 1-2 and state 3-4 switching, and quick state 2-3 switching, all relative to channel gating. (G) SQS numerical simulations exhibiting global selectivity. Parameters (in ms-1) α = 0.1, β = 0.01, a = 0.4, b = 0.004, koff = 3, and kon = 3.7×10¹² M-2ms-1. (H) SQS CDI(∞)–PO relations exhibit global or local selectivity. Symbols (circle, square, and arrow) correspond to simulations in (G). Green curve corresponds to Equation 2, with parameters as in (G). Gray and red curves demonstrate that increasing r, the ratio of channel affinity for Ca2+/CaM versus apoCaM, induces a shift from global to local selectivity. (I) Equivalent SQS mechanism (see Supplementary Information 1).
Figure 3
Figure 3. Voltage block theory and experiment
(A) Voltage block theory. Since both VU and VB are on the plateau of the voltage-activation relation (top row), the true channel open probability at either voltage is PO,max, with channel gating as cartooned in the middle row. By choosing VB at the reversal potential, sojourns to VB effectively lower PO (bottom row). (B) Schematic of block effects on single CaV1.3 channel activity (Ba2+ currents). (C) PO,max calibration. Voltage ramps (top) evoked CaV1.3 single-channel Ba2+ records (middle, black trace), which were averaged (middle, red trace), and normalized by the open current level (middle, dashed curve) to yield the voltage-activation relation (bottom, red trace). The whole-cell tail-activation curve (bottom, circles) was scaled in amplitude to match that of the single-channel curve, whereas the whole-cell curve calibrated the single-channel relation along the voltage axis. Cell numbers (n) as shown. See Supplementary Information 4A-B for details. (D-E) Voltage-block traces for CaV1.3 C-lobe inactivation (isolated with CaM12+) in Ca2+ (D) and Ba2+ (E). Voltage waveforms are above each current trace. Red symbols indicate time course of inactivation during each block cycle (Supplementary Information 4C). Final extent of inactivation indicated by red (Ca2+) or blue (Ba2+) dash. Scale bars 1 nA, 250 ms, throughout. (F) Time course of pure CDI (Ca2+ inactivation normalized by Ba2+ inactivation). SEM is shown for the 500-ms time points, and is similar at other times. From top to bottom: 0%, 40%, 60%, 80%, 90%, 95% block. (G) Experimentally determined CDI(∞)–PO relationship, corresponding to 500-ms points in (F). Inset: Low buffer data in 0.5 EGTA is a lower-limit proxy for PO~1. (H-K) Voltage block of N-lobe CDI (isolated with CaM34); format as in (D-G), except all analysis is done after 1 sec. CDI time course (J) for 0%, 20%, 40%, 60%, 80% block (top to bottom).
Figure 4
Figure 4. Mutations in NSCaTE transform N-lobe spatial selectivity of CaV1.3
(A) Scanning alanine mutagenesis of CaV1.3 NSCaTE (top), with corresponding N-lobe CDI (isolated with CaM34) in high buffering (bottom); f500 is the difference in fractional Ba2+ vs. Ca2+ currents remaining after 500-ms depolarization. Leftmost bar, wildtype. (B-C) Effects of alanine mutations on FRET interaction between α1D NSCaTE and Ca2+/CaM (B) or Ca2+/CaM34 (C). Kd,EFF is the effective dissociation constant (Supplementary Information 5A). (D-E) Voltage-block of C-lobe CDI for I48A mutant of CaV1.3 (as in Figures 3D, G). (F-H) Voltage-block of N-lobe CDI for I48A (F, G, green), and R52A (G, H, cyan). W44A mutant is coarsely plotted and fit (G, magenta). Dashed orange curve (G) replicates the native channel relation from Figure 3K. (I) Correlation between 1/Kd,EFF from (C) and model parameter r from fits in (G). Color schemes as before (orange: wild-type NSCaTE; cyan: R52A; green: I48A; magenta: W44A).
Figure 5
Figure 5. High PO variant of CaV1.3 enables high-resolution voltage-block analysis
(A) Cartoon of α1D pore-forming subunit of CaV1.3, locating NSCaTE and high-PO mutations. (B) PO,max calibration for high-PO variant of CaV1.3 (as in Figure 3C). Dashed curve in bottom graph replicates the native channel relation from Figure 3C. (C-D) Voltage-block of C-lobe CDI for high-PO CaV1.3. Format as in Figures 3D, F. (E-H) Voltage-block of N-lobe CDI for high-PO CaV1.3 (E-F) and high-PO I48A (G-H). (I) High-PO CDI(∞)–PO relationships. Solid red curve corresponds to C-lobe CDI from (D). Dashed red curve replicates the native-PO C-lobe profile from Figure 3G. Other curves correspond to high-PO N-lobe CDI, with colors as before (orange: wild-type NSCaTE from (F); cyan: R52A; green: I48A from (H); magenta: W44A). Low buffer data in 0.5 EGTA (exemplars to right) are lower-limit proxies for PO~1. Error bars show SEM, with cell numbers (n) as shown. (J) Magnified view of high-PO I48A profile from (I), showing only high-buffer voltage-block data obtained in 10 mM BAPTA. Comparison of data to a dashed linear relation (top), with difference between dashed line and data points (bottom), demonstrates clear upward curvature. (K) Correlation between 1/Kd,EFF from Figure 4C and model parameter r from fits in (I).
Figure 6
Figure 6. The SQS mechanism generalizes to CaV2 channels
(A-B) PO,max calibration for CaV2.2 (A) and cBBBBb (B). Format as in Figure 3C. (C-I) Voltage-block analysis of CaV2.2 (C-D, I, green), Δ78cBBBBb (E-F, I, orange), and W82A mutant of Δ78cBBBBb (G-I, cyan). Blue waveforms in (C, E, G) follow the Ba2+ current trajectory (e.g., symbols in Figure 3E) corresponding to the same percentage block. (J) Correlation between 1/Kd,EFF from FRET binding of α1C NSCaTE with Ca2+/CaM34 (Dick et al., 2008) and model parameter r from fits in (I).
Figure 7
Figure 7. Physiological modulation of the SQS mechanism
(A) Graphical depiction of transformation from global to local selectivity. (B) Physiologically plausible mechanisms of spatial selectivity transformation. Vertical axis shows model parameter r. Horizontal axis shows channel gating speed. Transformation from global to local could arise from increasing r (trajectory i), or by speeding channel gating (trajectory ii).

Comment in

References

    1. Augustine GJ, Santamaria F, Tanaka K. Local calcium signaling in neurons. Neuron. 2003;40:331–346. - PubMed
    1. Bayley P, Ahlstrom P, Martin SR, Forsen S. The kinetics of calcium binding to calmodulin: Quin 2 and ANS stopped-flow fluorescence studies. Biochem Biophys Res Commun. 1984;120:185–191. - PubMed
    1. Berridge MJ, Lipp P, Bootman MD. The versatility and universality of calcium signalling. Nat Rev Mol Cell Biol. 2000;1:11–21. - PubMed
    1. Black DJ, Halling DB, Mandich DV, Pedersen SE, Altschuld RA, Hamilton SL. Calmodulin interactions with IQ peptides from voltage-dependent calcium channels. Am J Physiol Cell Physiol. 2005;288:C669–676. - PubMed
    1. Bootman MD, Lipp P, Berridge MJ. The organisation and functions of local Ca(2+) signals. J Cell Sci. 2001;114:2213–2222. - PubMed

Publication types