. 2008 Jun 27;133(7):1266-76.
doi: 10.1016/j.cell.2008.05.024.

Variation in homeodomain DNA binding revealed by high-resolution analysis of sequence preferences

Affiliations

Variation in homeodomain DNA binding revealed by high-resolution analysis of sequence preferences

Michael F Berger et al. Cell. .

Abstract

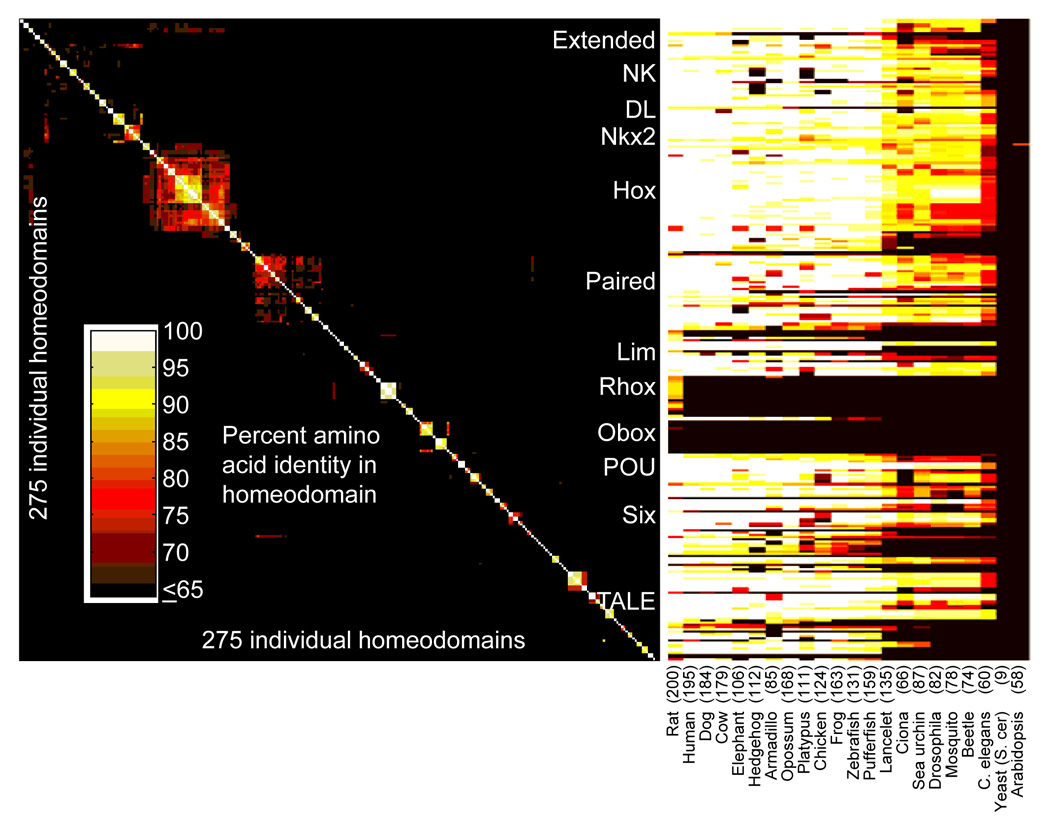
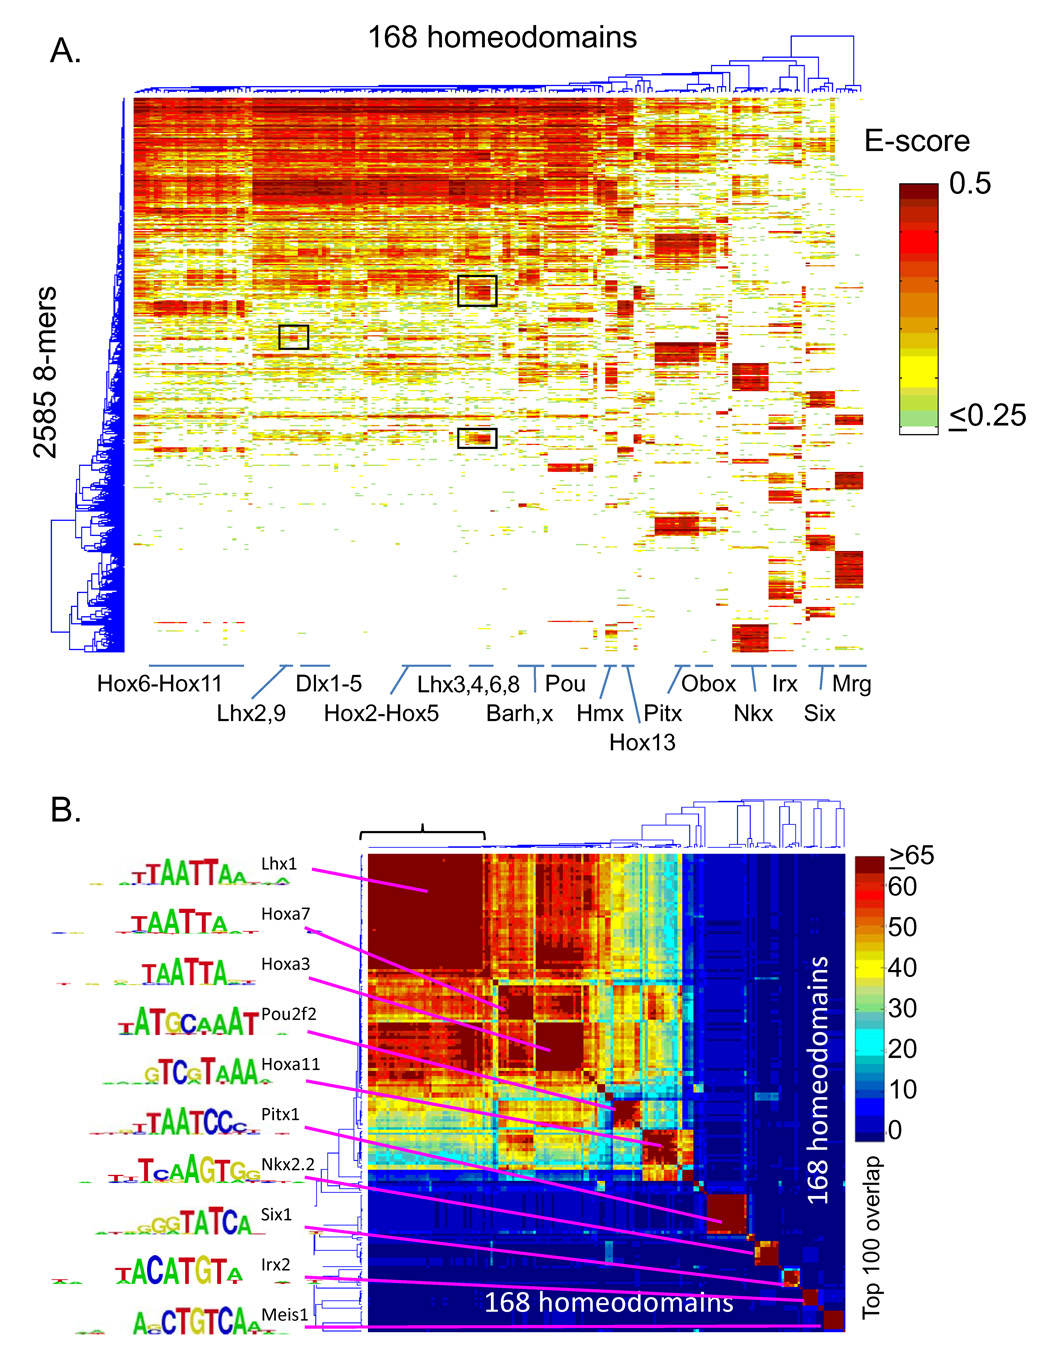
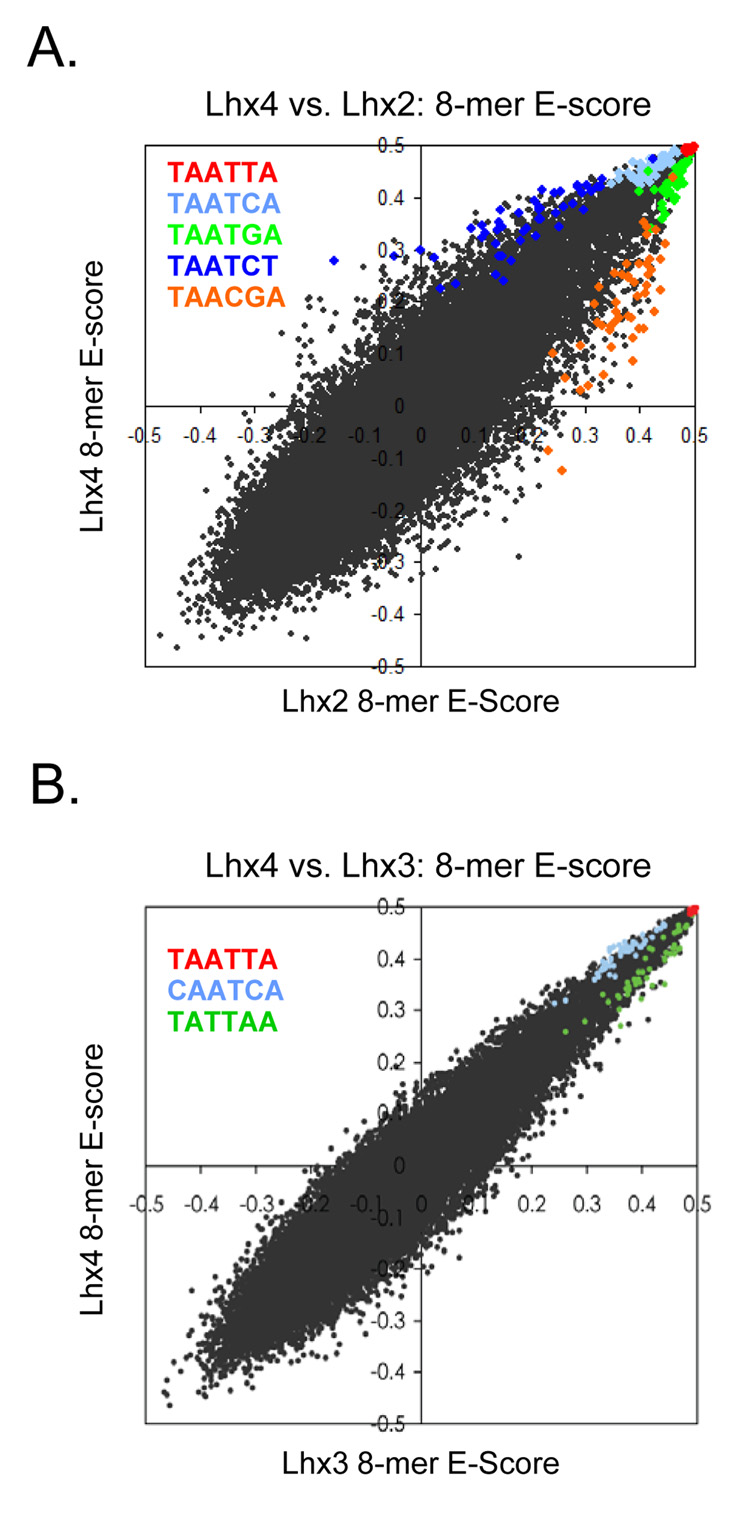
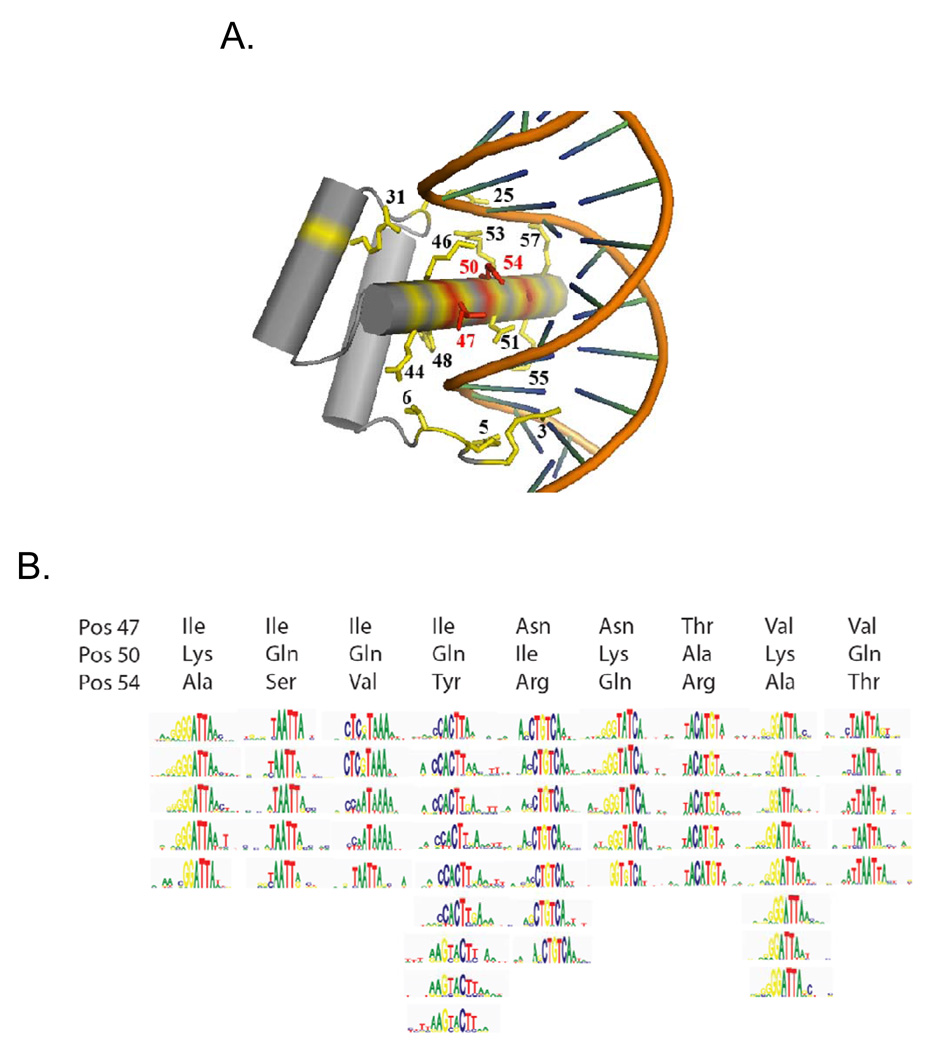
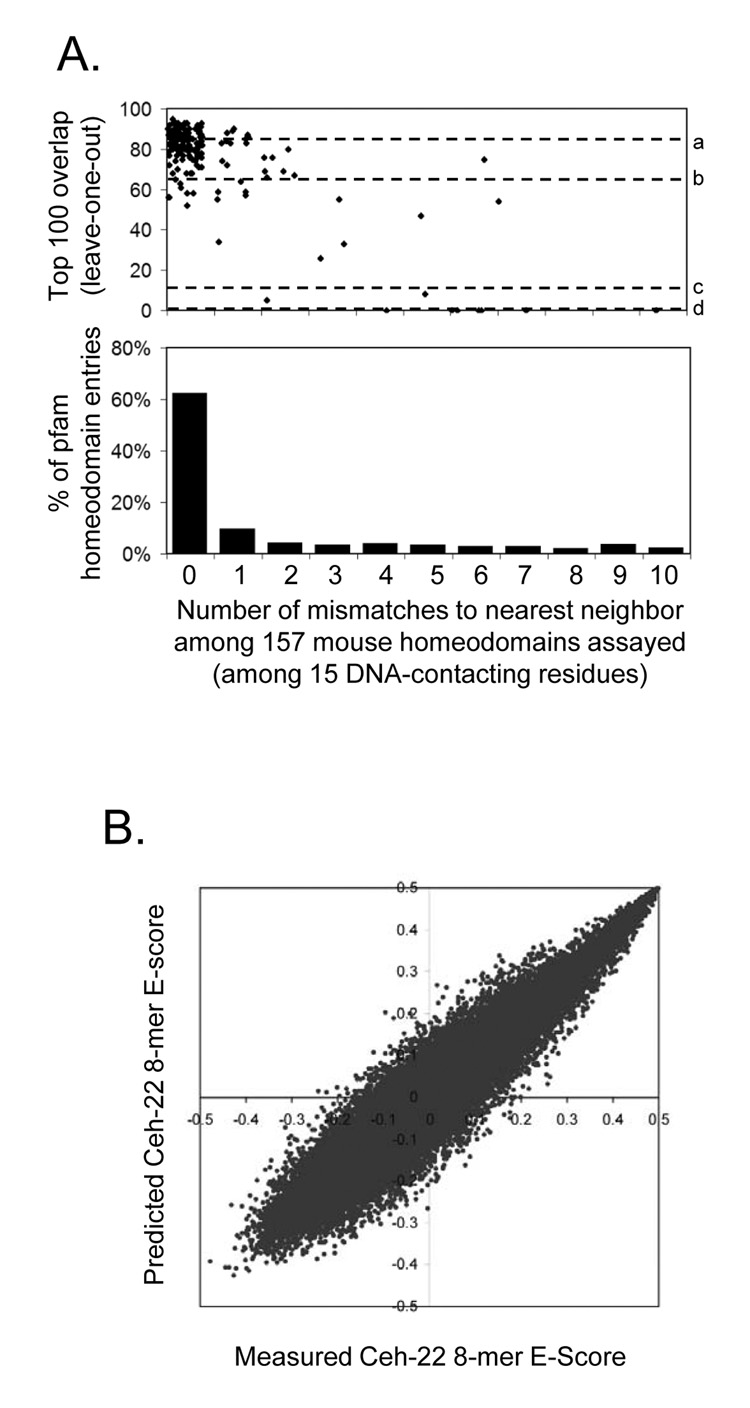
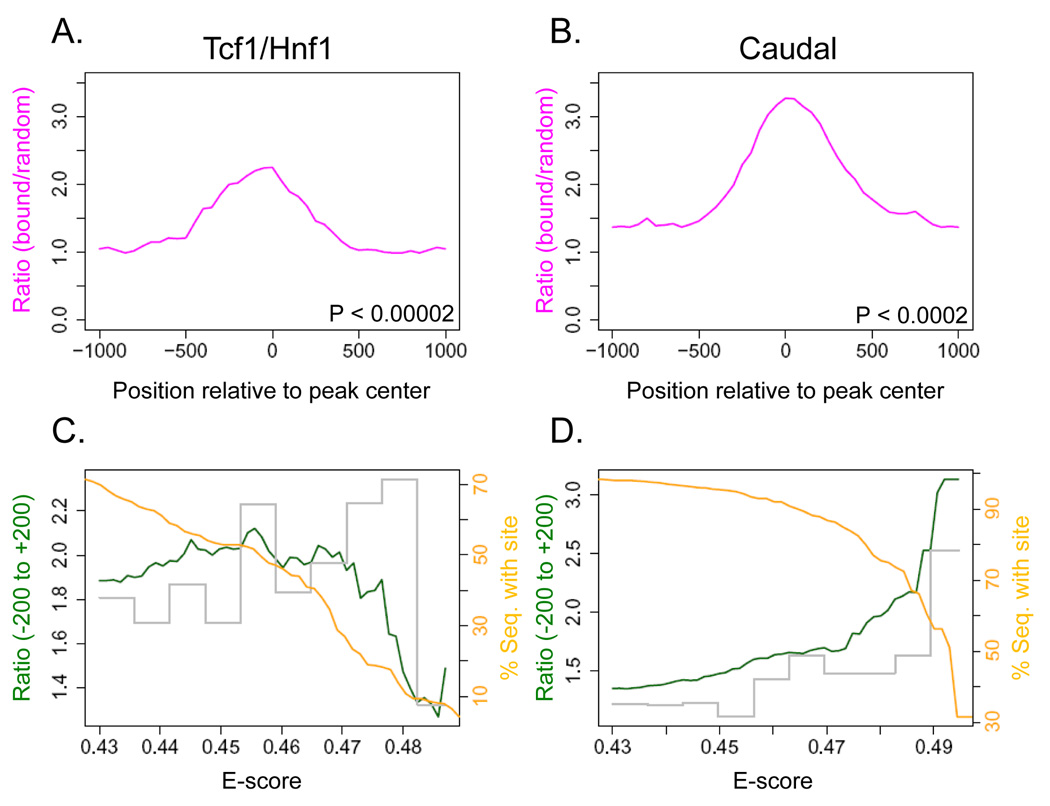
Most homeodomains are unique within a genome, yet many are highly conserved across vast evolutionary distances, implying strong selection on their precise DNA-binding specificities. We determined the binding preferences of the majority (168) of mouse homeodomains to all possible 8-base sequences, revealing rich and complex patterns of sequence specificity and showing that there are at least 65 distinct homeodomain DNA-binding activities. We developed a computational system that successfully predicts binding sites for homeodomain proteins as distant from mouse as Drosophila and C. elegans, and we infer full 8-mer binding profiles for the majority of known animal homeodomains. Our results provide an unprecedented level of resolution in the analysis of this simple domain structure and suggest that variation in sequence recognition may be a factor in its functional diversity and evolutionary success.


Figures

Figure 1
Figure 1. Heat-map showing the number of mismatches between different hierarchically clustered mouse homeodomains (left) and their closest BLAST or BLAT hit in other species as indicated (right)
The number of distinct homeodomain-containing protein counterparts in other species is given, based on the number of different gene sequences represented (i.e., isoforms are counted as a single entity). Major homeodomain families are indicated.
Figure 2
Figure 2. Overview of homeodomains 8-mer binding profiles reveals distinct sequence preferences
(A) Hierarchical agglomerative clustering analysis of E-score data for 2,585 8-mers with E > 0.45 in at least one experiment. Boxed regions are referred to in the text. The position of exemplary homeodomain families within the dendrogram are indicated in order to highlight the diversity of overall 8-mer profiles. (B) Clustering analysis of the matrix of overlaps in the top 100 8-mers (of all 32,896) for each pair of homeodomains. The bracket indicates the experiments analyzed in Figure 3. Logos for representative members of the major groups were determined using the Seed-and-Wobble method (Berger et al., 2006).
Figure 3
Figure 3. Homeodomains with virtually identical dominant motifs and top 100 8-mer preferences have differing preferences for many 8-mers
Bottom, heat-map as in Figure 2, but restricted to the 470 8-mers with E > 0.45 in at least one of the experiments shown. Color of labels indicates groups that are distinct by our criteria. Logos were derived using ClustalW with the 8-mers in the boxed regions as inputs. Top, amino-acid similarities among these 42 homeodomains, as in Figure 1.
Figure 4
Figure 4. Scatter plots showing differences in E-scores for individual 8-mers between Lhx family members
(A) Comparison of Lhx2 and Lhx4. (B) Comparison of Lhx3 and Lhx4. 8-mers containing each 6-mer sequence (inset) are highlighted, revealing clear systematic differences between sequence preferences despite essentially identical dominant motifs and sets of top 100 8-mers for these homeodomains.
Figure 5
Figure 5. Correspondence between canonical homeodomain amino acid sequence specificity residues and dominant motifs
(A) Protein-DNA interface for the Drosophila Engrailed protein (Kissinger et al., 1990). The three primary specificity residues discussed in the text are shown in red. The remaining residues considered in our nearest-neighbor analysis are in yellow. (B) Motifs for all homeodomains in our dataset containing each of the displayed combinations of residues. For clarity, only those combinations occurring between 5 and 10 times are shown. Logos represent PWMs determined using the Seed-and-Wobble method (Berger et al., 2006).
Figure 6
Figure 6. Correspondence between homeodomain DNA-contacting amino acid sequence residues and 8-mer DNA binding profiles
(A) Top, scatter plot showing the top 100 overlap between real and predicted 8-mer binding profiles from leave-one-out cross-validation for our nearest-neighbor approach. Dashed lines indicate the following benchmarks: a) median, experimental replicates; b) 99% confidence, experimental replicates; d) median, randomized homeodomain labels; d) median, randomized 8-mer labels. Within each bin, the X-axis values have been nudged randomly for visualization. Bottom, the proportion of 3,693 pfam entries with the indicated identity to at least one mouse homeodomain analyzed. (B) Predicted vs. measured 8-mer E-scores for C. elegans Ceh-22.
Figure 7
Figure 7. Enrichment of sequences preferred in vitro within genomic sequences bound in vivo by the same protein
(A) Comparison of bound to randomly-selected sequences for human Tcf1/Hnf1 (Odom et al., 2006), showing the relative enrichment of our 8-mers (at 0.456 cutoff). P-value was calculated for the interval (−200 to +200) by the Wilcoxon-Mann-Whitney rank sum test, comparing the number of occurrences per sequence in the bound set vs. the background set. (B) Same as (A), but for Drosophila Caudal (Li et al., 2008) (at 0.493 cutoff). (C) Relative enrichment (green line) in the −200 to + 200 window for varying cutoffs of the E-score for Tcf1/Hnf1. The orange line shows the proportion of bound fragments with at least one such sequence in the same interval. The grey bars show the relative enrichment of 8-mers within each interval of 0.1, e.g. only 0.43–0.436 for the first interval. (D) Same as (C), but for Caudal.

Comment in

References

    1. Banerjee-Basu S, Moreland T, Hsu BJ, Trout KL, Baxevanis AD. The Homeodomain Resource: 2003 update. Nucleic Acids Res. 2003;31:304–306. - PMC - PubMed
    1. Benos PV, Bulyk ML, Stormo GD. Additivity in protein-DNA interactions: how good an approximation is it? Nucleic Acids Res. 2002;30:4442–4451. - PMC - PubMed
    1. Berger MF, Philippakis AA, Qureshi AM, He FS, Estep PW, 3rd, Bulyk ML. Compact, universal DNA microarrays to comprehensively determine transcription-factor binding site specificities. Nat Biotechnol. 2006;24:1429–1435. - PMC - PubMed
    1. Blackwell TK, Huang J, Ma A, Kretzner L, Alt FW, Eisenman RN, Weintraub H. Binding of myc proteins to canonical and noncanonical DNA sequences. Mol Cell Biol. 1993;13:5216–5224. - PMC - PubMed
    1. Bryne JC, Valen E, Tang MH, Marstrand T, Winther O, da Piedade I, Krogh A, Lenhard B, Sandelin A. JASPAR, the open access database of transcription factor-binding profiles: new content and tools in the 2008 update. Nucleic Acids Res. 2008;36:D102–D106. - PMC - PubMed

Publication types

Associated data