. 2008 Sep 1;321(1):77-87.
doi: 10.1016/j.ydbio.2008.06.005. Epub 2008 Jun 13.

Genetic mosaic analysis reveals FGF receptor 2 function in terminal end buds during mammary gland branching morphogenesis

Affiliations

Genetic mosaic analysis reveals FGF receptor 2 function in terminal end buds during mammary gland branching morphogenesis

Pengfei Lu et al. Dev Biol. .

Abstract

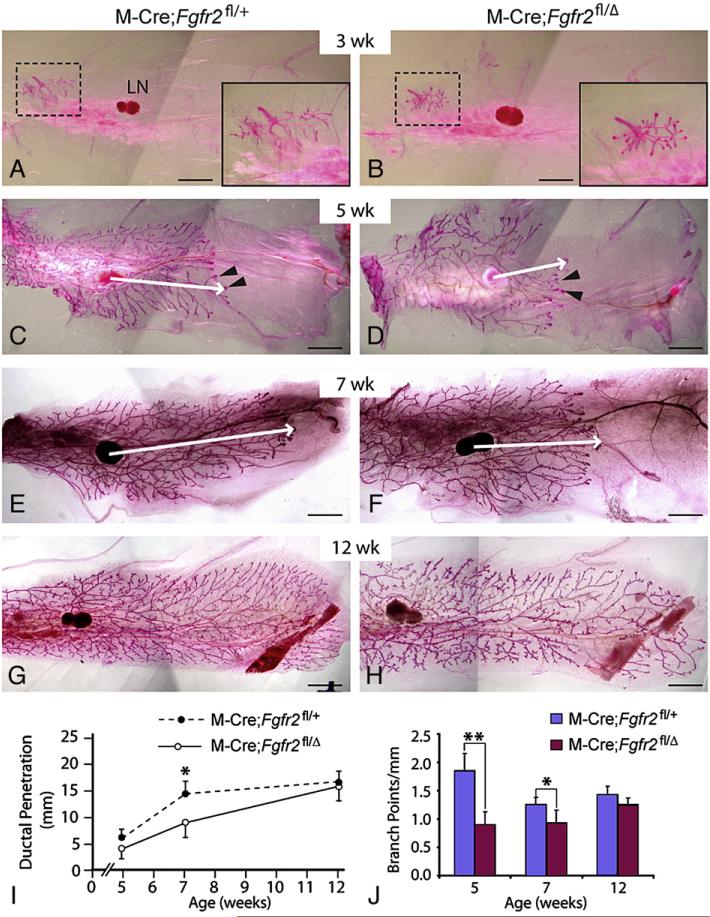
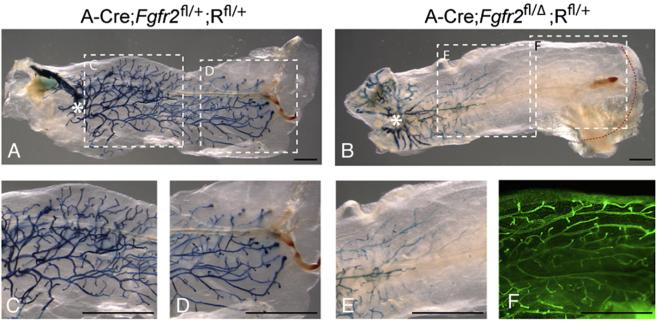
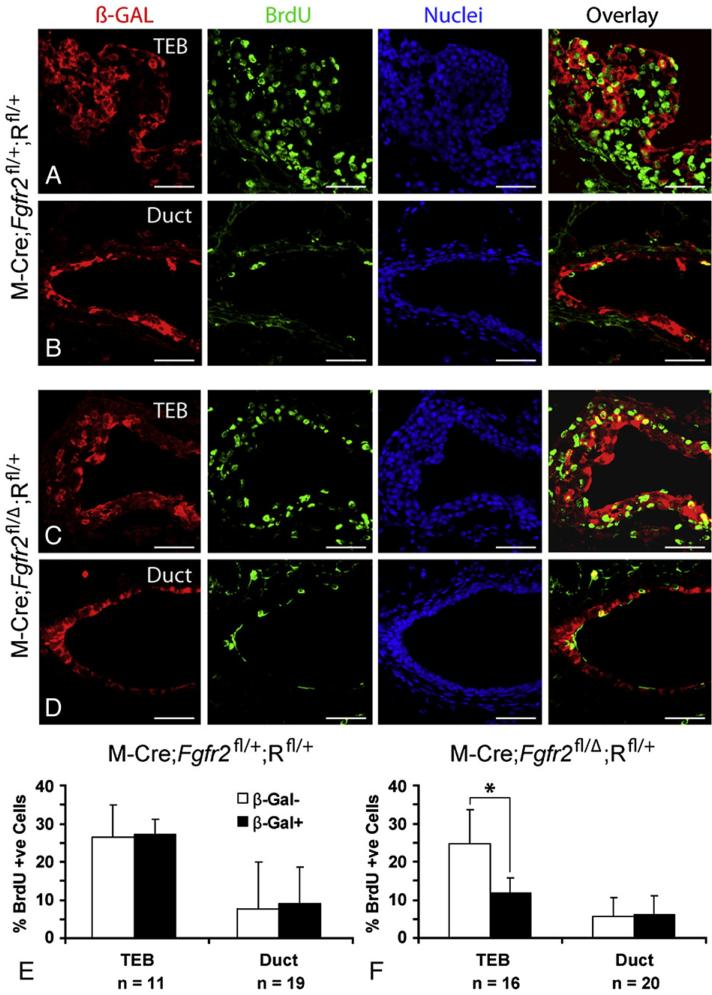
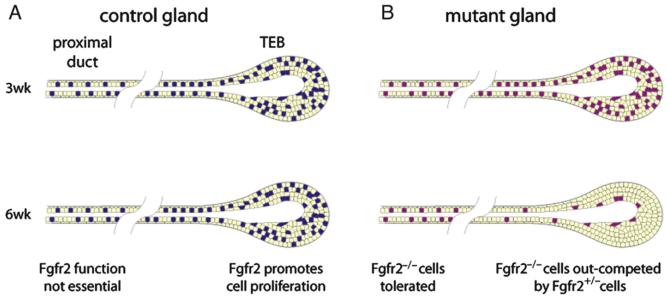
FGF signaling is associated with breast cancer and is required for mammary placode formation in the mouse. In this study, we employed a genetic mosaic analysis based on Cre-mediated recombination to investigate FGF receptor 2 (Fgfr2) function in the postnatal mammary gland. Mosaic inactivation of Fgfr2 by the MMTV-Cre transgene enabled us to compare the behavior of Fgfr2 null and Fgfr2 heterozygous cells in the same gland. Fgfr2 null cells were at a competitive disadvantage to their Fgfr2 heterozygous neighbors in the highly proliferative terminal end buds (TEBs) at the invasion front, owing to a negative effect of loss of Fgfr2 function on cell proliferation. However, Fgfr2 null cells were tolerated in mature ducts. In these genetic mosaic mammary glands, the epithelial network is apparently built by TEBs that over time are composed of a progressively larger proportion of Fgfr2-positive cells. However, subsequently, most cells lose Fgfr2 function, presumably due to additional rounds of Cre-mediated recombination. Using an independent strategy to create mosaic mammary glands, which employed an adenovirus-Cre that acts only once, we confirmed that Fgfr2 null cells were out-competed by neighboring Fgfr2 heterozygous cells. Together, our data demonstrate that Fgfr2 functions in the proliferating and invading TEBs, but it is not required in the mature ducts of the pubertal mammary gland.


Figures

Fig. 1
Fig. 1
Expression of FGF receptor genes in postnatal mammary glands. (A) Schematic diagrams of the developing mammary gland at the stages indicated. The terminal end buds (TEBs) develop at the onset of puberty (3 weeks after birth) at the distal tip of each primary duct. The TEBs regress when the primary branches have extended to the distal end of the fat pad (stroma). Proximal (Pr) is to the left and distal (Di) is to the right in this and all figures showing mammary glands in wholemount. (B-E′) Expression of Fgfr1 (B and B′), Fgfr2 (C and C′), Fgfr3 (D and D′), and Fgfr4 (E and E′) as detected by in situ hybridization with 35S-labeled probes on paraffin sections of mammary glands from female mice at 5 weeks of age. (B-E) The in situ hybridization signal as viewed in dark-field is displayed in the Photoshop red channel; DAPI staining of nuclei was viewed by fluorescence, and the signal is displayed in the Photoshop blue channel. (B′-E′) In situ hybridization signal in the samples shown in panels B-E as viewed in dark-field. (F-H) Immunofluorescence using anti-FGFR2 antibody (red, F-H) and anti-smooth muscle actin (SMA, green, F′, G′, H′) on frozen sections of mammary glands from females at the stages indicated. Samples were counterstained with nuclear dye To-Pro3 (blue, F″, G″, H″). Arrow in panel F points to cap cells (cc). Note that a few body cells also express SMA (arrowheads in panel F′). (G, G′) Myoepithelium (me, open arrowhead) but not luminal epithelium (le, arrow) expresses smooth muscle actin. (F‴-H‴) The FGFR2 and SMA signals are overlaid, showing co-expression in the cap cells of the TEBs at 5 weeks (F‴) and in the myoepithelium in the ducts at 5 weeks (G‴) and 10 weeks (H‴). Insets in panels F‴-H‴ are high-magnification views of the area in dashed box with FGFR2 and nuclear signals overlaid to show that FGFR2 was mainly nuclear at 5 weeks in both ducts and TEBs (arrowheads in panels F‴ and G‴, respectively) but was mainly cytoplasmic and at the cell surface in 10 week ducts (arrowheads in panel H‴). Scale bars: 100 µm. Abbreviations: bc, body cells; cc, cap cells; lb, lateral branch; le, luminal epithelium; me, myoepithelium.
Fig. 2
Fig. 2
Consequences of MMTV-Cre-mediated inactivation of Fgfr2 in mammary epithelium. (A-H) The mammary branching tree at the postnatal stages indicated, as revealed by Carmine Red staining of glands in wholemount. (A, C, E, G) glands from control (M-Cre;Fgfr2fl/+) mice; (B, D, F, H) glands from mutant (M-Cre;Fgfr2fl/Δ) mice. Insets in panels A and B show high-magnification views of the rudimentary ductal tree (area in dashed box). (C-F) Arrowheads indicate TEBs at the tips of invading mammary epithelium. Arrows indicate the extent of ductal penetration in the fat pad. (I, J) Quantitative comparisons of ductal penetration and branch point formation between control and mutant glands. At 5 weeks, ductal penetration measurements were 6.0±1.4 (control, n=5) and 4.5±1.7 (mutant, n=6); at 7 weeks, the measurements were 14.6±2.2 (control, n=4) and 9.1±3.2 (mutant, n=4); at 12 weeks, they were 16.8±2.2 (control, n=8) and 16.0±2.9 (mutant, n=12). Measurements of branching points were 1.8±0.3 (control) and 0.9±0.2 (mutant) at 5 weeks, 1.3±0.1 (control) and 0.9±0.2 (mutant) at 7 weeks, and 1.4±0.1 (control) and 1.3±0.1 (mutant) at 12 weeks. Values shown are the mean±SD for each data point: **P<0.0005; *P<0.05, unpaired, two-tailed Student's t test. Scale bars: 2.5 mm. Abbreviation: LN, lymph node.
Fig. 3
Fig. 3
Analysis of Fgfr2 genetic mosaics produced by MMTV-Cre-mediated recombination. Immunofluorescence assays for co-expression of β-GAL and FGFR2 on frozen sections from distal mammary glands from mice at 14 weeks. (A-A″) control (M-Cre;Fgfr2fl/+;Rfl/+) and (B-B″) mutant (M-Cre;Fgfr2fl/Δ;Rfl/+) glands. The green channel (A, B) shows β-GAL expression and the red channel (A′, B′) shows FGFR2 protein expression. Note that FGFR2 expression is ubiquitous in control epithelium (A′), and mosaic in mutant epithelium (B′). β-GAL expression is mosaic in both control (A) and mutant (B) epithelium, and FGFR2 and β-GAL expression are mutually exclusive in the mutant epithelium (B-B″). Seven different sections from control and mutant #4 mammary glands were examined for these experiments. Scale bars: 10 µm. (C-L) Assays for β-GAL activity in wholemounts of glands at the stages indicated. The dashed boxes in panels C-F demarcate the portions of the branching trees that are shown at higher magnification in insets in panels C and D or in separate panels (G-J). In all glands, β-GAL expression marks cells derived from those in which MMTV-Cre-mediated recombination occurred. Only a few β-GAL-positive cells (arrowheads, see also 3P) were present in TEBs of mutant mammary glands at 7 weeks (J, n=10). Note in panel F that at 7 weeks there are few β-GAL-positive cells in the distal epithelium of the mutant glands, whereas panel L shows that at 14 weeks (n=14) many cells in that region are β-GAL-positive. Note that in this series of experiments, ductal penetration was also significantly delayed in the mutant glands at 7 weeks; it was 84% of that in the control glands (8.9 mm±1.7 vs. 10.6 mm±0.6, P<0.01, unpaired, two-tailed Student's t test). 10-15 mammary glands were examined at each stage. Scale bars: 2.5 mm. (M-P) Sections through TEBs in mammary glands at the stages indicated, assayed for β-GAL activity in wholemount and counterstained with nuclear fast red. (M, N) control (M-Cre;Fgfr2fl/+;Rfl/+) and (O, P) mutant (M-Cre;Fgfr2fl/Δ;Rfl/+) glands. At least 5 TEBs were examined for each stage. Note Cre activity was primarily restricted to the body cells at 5 weeks (M, O). Scale bars: 50 µm.
Fig. 4
Fig. 4
Analysis of Fgfr2 heterozygote/null genetic mosaics produced by Adenovirus Cre-mediated recombination. (A-E) Assays for β-GAL activity in mammary glands in which the ductal tree developed for 8 weeks from donor mammary epithelial cells harvested from (A) control Fgfr2+/+;Rfl/fl and (B) mutant Fgfr2fl/fl;Rfl/fl female mice and infected with adenovirus-Cre (see Materials and methods). Asterisks indicate the transplantation sites in the recipient fat pads from which donor cells grew out. Dashed boxes in panels A and B demarcate the regions shown at higher magnification in the corresponding panels (C-E). (F) The glands were stained with Yo-Yo1 to illuminate the branching tree; This staining, shown only for the region demarcated by the dashed box (F) in panel B, demonstrates that there are many epithelial branches in a region of the gland that contains virtually no β-GAL-positive/Fgfr2 null cells. 10 transplanted glands were examined for each genotype. Scale bars: 2.5 mm.
Fig. 5
Fig. 5
Cell proliferation as assessed by BrdU incorporation assays in Fgfr2 genetic mosaics produced by MMTV-Cre-mediated recombination. (A-D) Immunofluorescent co-staining of β-GAL and BrdU on frozen sections of control and mutant mammary glands at 4 weeks. Samples were counterstained with To-Pro3. (E and F) A quantitative comparison of the percentage of BrdU-positive cells in the β-GAL-negative and β-GAL-positive cell populations in TEBs and ducts of mammary glands from control (E, n=3) and mutant (F, n=4) mice. A total of 1533 cells from 11 TEBs and 1341 cells from 19 ducts were counted in control glands; and 3052 cells from 16 TEBs and 1798 cells from 20 ducts were counted in mutant glands. Values are the mean±SD for each data point. *P<0.00005, paired, two-tailed Student's t test. Note that the only significant difference in percent BrdU-positive cells was observed between β-GAL-negative (FGFR2 heterozygous) and β-GAL-positive (FGFR2 null) cells in TEBs. Scale bars: 50 µm.
Fig. 6
Fig. 6
Model of FGFR2 function during postnatal branching morphogenesis in the mammary gland. (A) Schematic representations of primary branches in control genetic mosaic mammary glands at 3 and 6 weeks. Fgfr2 heterozygous cells are colored yellow and wild-type cells are colored blue. Fgfr2 is expressed in mammary epithelium, including TEBs and ducts, during postnatal development. Fgfr2 promotes cell proliferation of in TEB cells to ensure normal branching morphogenesis but is not required in the proximal ducts. (B) Mutant genetic mosaic mammary glands. Fgfr2 heterozygous cells are colored yellow and Fgfr2 null cells are colored purple. Fgfr2 null cells survive and persist in proximal ducts, but when TEBs undergo rapid cell proliferation and active epithelial invasion following the onset of puberty, Fgfr2 null cells are rapidly depleted. Once diluted out of the TEB, Fgfr2 null cells no longer contribute to the distal ductal network.

References

    1. Affolter M, Bellusci S, Itoh N, Shilo B, Thiery JP, Werb Z. Tube or not tube: remodeling epithelial tissues by branching morphogenesis. Dev. Cell. 2003;4:11–18. - PubMed
    1. Beer HD, Florence C, Dammeier J, McGuire L, Werner S, Duan DR. Mouse fibroblast growth factor 10: cDNA cloning, protein characterization, and regulation of mRNA expression. Oncogene. 1997;15:2211–2218. - PubMed
    1. Bonnette SG, Hadsell DL. Targeted disruption of the IGF-I receptor gene decreases cellular proliferation in mammary terminal end buds. Endocrinology. 2001;142:4937–4945. - PubMed
    1. Bottcher RT, Niehrs C. Fibroblast growth factor signaling during early vertebrate development. Endocr. Rev. 2005;26:63–77. - PubMed
    1. Cabernard C, Affolter M. Distinct roles for two receptor tyrosine kinases in epithelial branching morphogenesis in Drosophila. Dev. Cell. 2005;9:831–842. - PubMed

Publication types

MeSH terms

Substances