

Internal hydration increases during activation of the G-protein-coupled receptor rhodopsin
- PMID: 18585736
- PMCID: PMC3987891
- DOI: 10.1016/j.jmb.2008.05.036
Internal hydration increases during activation of the G-protein-coupled receptor rhodopsin
Abstract
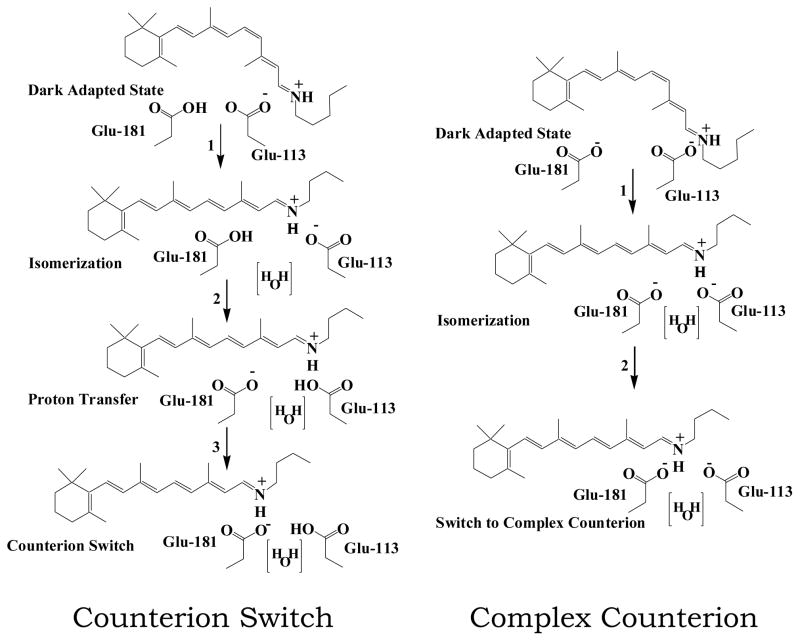
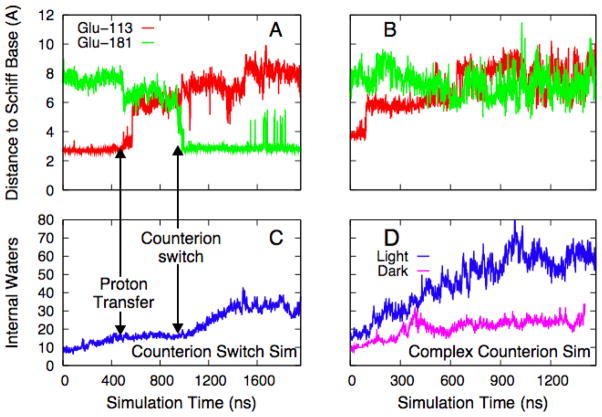
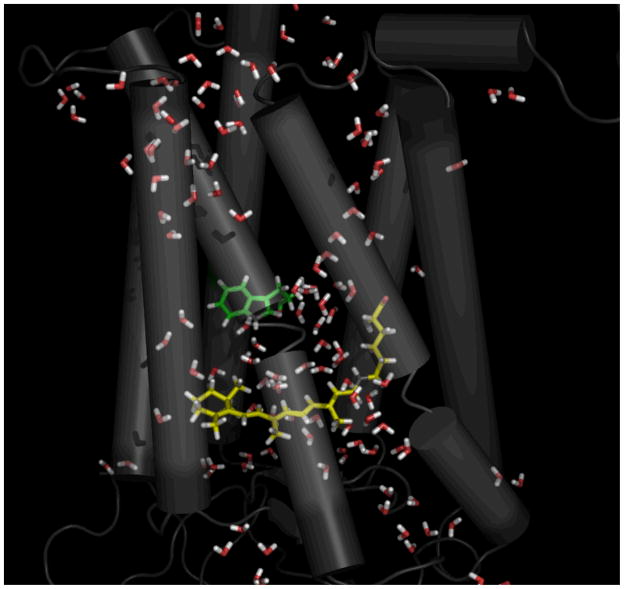
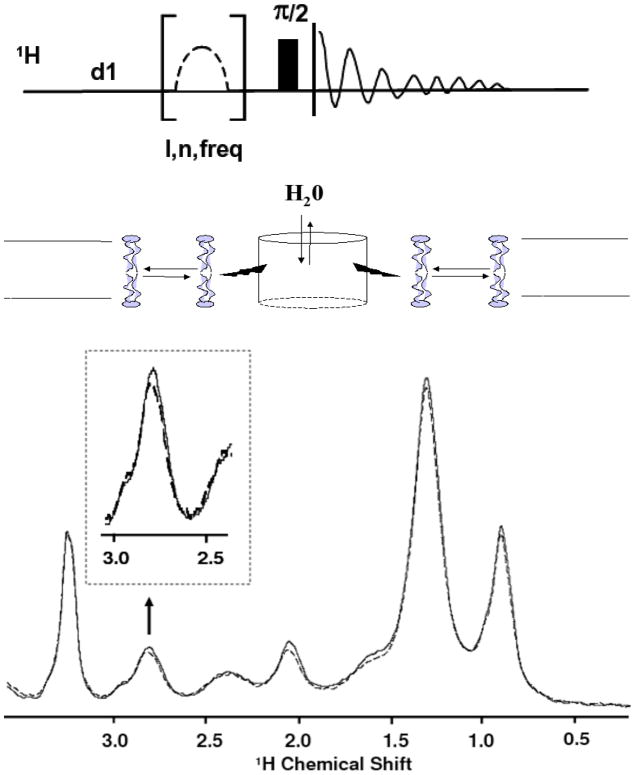
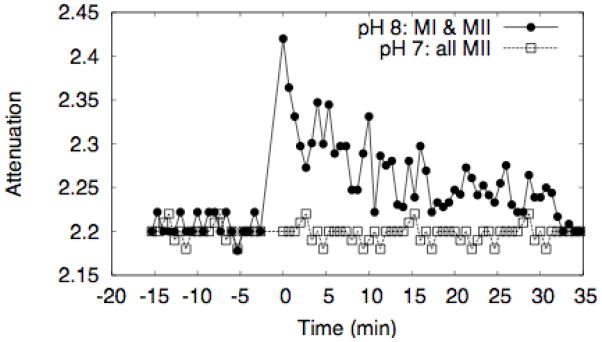
Rhodopsin, the membrane protein responsible for dim-light vision, until recently was the only G-protein-coupled receptor (GPCR) with a known crystal structure. As a result, there is enormous interest in studying its structure, dynamics, and function. Here we report the results of three all-atom molecular dynamics simulations, each at least 1.5 micros, which predict that substantial changes in internal hydration play a functional role in rhodopsin activation. We confirm with (1)H magic angle spinning NMR that the increased hydration is specific to the metarhodopsin-I intermediate. The internal water molecules interact with several conserved residues, suggesting that changes in internal hydration may be important during the activation of other GPCRs. The results serve to illustrate the synergism of long-time-scale molecular dynamics simulations and NMR in enhancing our understanding of GPCR function.
Figures
Similar articles
-
Agonist-induced conformational changes in bovine rhodopsin: insight into activation of G-protein-coupled receptors.J Mol Biol. 2008 Oct 3;382(2):539-55. doi: 10.1016/j.jmb.2008.06.084. Epub 2008 Jul 7. J Mol Biol. 2008. PMID: 18638482
-
Retinal ligand mobility explains internal hydration and reconciles active rhodopsin structures.Biochemistry. 2014 Jan 21;53(2):376-85. doi: 10.1021/bi4013947. Epub 2014 Jan 8. Biochemistry. 2014. PMID: 24328554 Free PMC article.
-
Functional water molecules in rhodopsin activation.J Phys Chem B. 2014 Sep 18;118(37):10863-73. doi: 10.1021/jp505180t. Epub 2014 Sep 8. J Phys Chem B. 2014. PMID: 25166739
-
Retinal dynamics during light activation of rhodopsin revealed by solid-state NMR spectroscopy.Biochim Biophys Acta. 2010 Feb;1798(2):177-93. doi: 10.1016/j.bbamem.2009.08.013. Epub 2009 Aug 28. Biochim Biophys Acta. 2010. PMID: 19716801 Free PMC article. Review.
-
Relevance of rhodopsin studies for GPCR activation.Biochim Biophys Acta. 2014 May;1837(5):674-82. doi: 10.1016/j.bbabio.2013.09.002. Epub 2013 Sep 13. Biochim Biophys Acta. 2014. PMID: 24041646 Review.
Cited by
-
Concerted interconversion between ionic lock substates of the beta(2) adrenergic receptor revealed by microsecond timescale molecular dynamics.Biophys J. 2010 Jan 6;98(1):76-84. doi: 10.1016/j.bpj.2009.09.046. Biophys J. 2010. PMID: 20074514 Free PMC article.
-
Coarse-grained molecular dynamics provides insight into the interactions of lipids and cholesterol with rhodopsin.Adv Exp Med Biol. 2014;796:75-94. doi: 10.1007/978-94-007-7423-0_5. Adv Exp Med Biol. 2014. PMID: 24158802 Free PMC article.
-
Role of bulk water in hydrolysis of the rhodopsin chromophore.J Biol Chem. 2011 May 27;286(21):18930-7. doi: 10.1074/jbc.M111.234583. Epub 2011 Apr 1. J Biol Chem. 2011. PMID: 21460218 Free PMC article.
-
Ultraslow Water-Mediated Transmembrane Interactions Regulate the Activation of A2A Adenosine Receptor.Biophys J. 2016 Sep 20;111(6):1180-1191. doi: 10.1016/j.bpj.2016.08.002. Biophys J. 2016. PMID: 27653477 Free PMC article.
-
Determination of the μ-Conotoxin PIIIA Specificity Against Voltage-Gated Sodium Channels from Binding Energy Calculations.Mar Drugs. 2018 May 7;16(5):153. doi: 10.3390/md16050153. Mar Drugs. 2018. PMID: 29735899 Free PMC article.
References
-
- Hubbell WL, Altenbach C, Hubbell CM, Khorana HG. Rhodopsin structure, dynamics and activation: a perspective from crystallography, site-directed spin labeling, sulfhydryl reactivity, and disulfide cross-linking. Adv Prot Chem. 2003;63:243–290. - PubMed
-
- Lefkowitz RJ. Historical review: a brief history and personal restropective of seven-transmembrane receptors. Trends Pharmacol Sci. 2004;25:413–422. - PubMed
-
- Klabunde T, Hessler G. Drug design strategies for targeting G-protein-coupled receptors. Chembiochem. 2002;3:928–44. - PubMed
-
- Rasmussen SGF, Choi H-J, Rosenbaum DM, Kobilka TS, Thian FS, Edwards PC, Burghammer M, Ratnala VRP, Sanishvili R, Fischetti RF, Schertler GFX, Weis WI, Kobilka BK. Crystal structure of the human beta-2 adrenergic G-protein-coupled receptor. Nature 2007 - PubMed
-
- Li J, Edwards PC, Burghammer M, Villa C, Schertler GF. Structure of bovine rhodopsin in a trigonal crystal form. J Mol Biol. 2004;343:1409–38. - PubMed
Publication types
MeSH terms
Substances
Grants and funding
LinkOut - more resources
Full Text Sources
Research Materials
