

Distortion-product otoacoustic emissions in the common marmoset (Callithrix jacchus): parameter optimization
- PMID: 18586424
- PMCID: PMC2567920
- DOI: 10.1016/j.heares.2008.05.006
Distortion-product otoacoustic emissions in the common marmoset (Callithrix jacchus): parameter optimization
Abstract
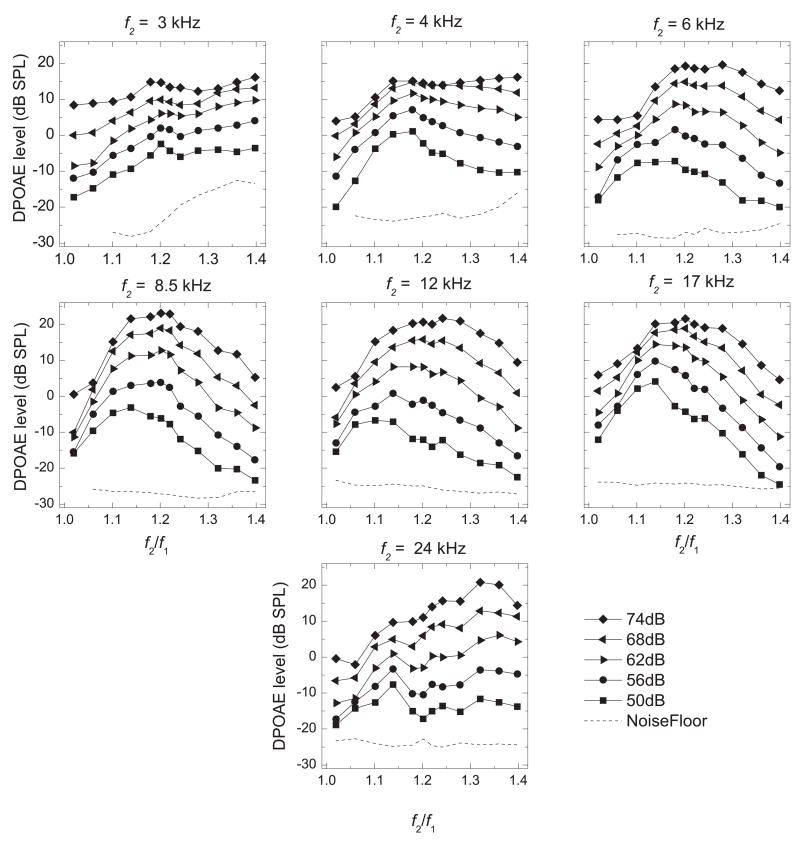
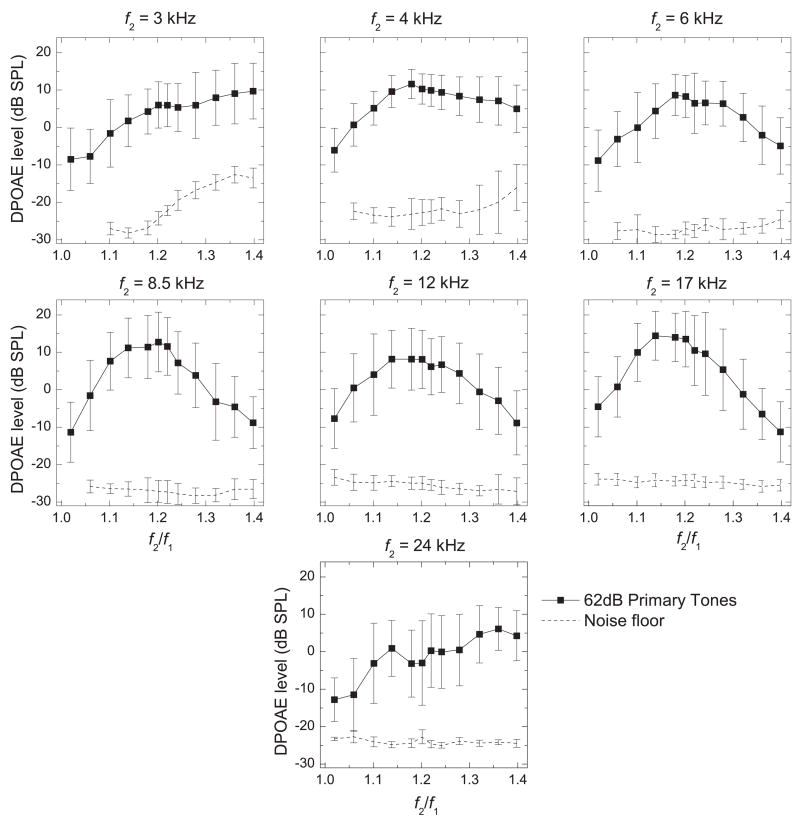
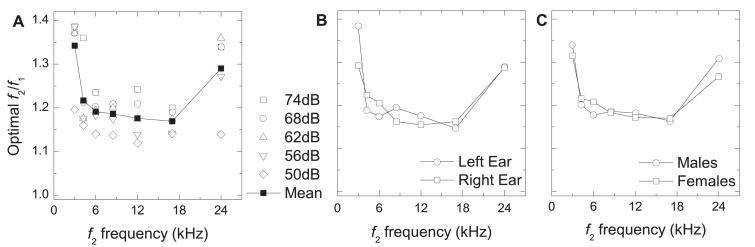
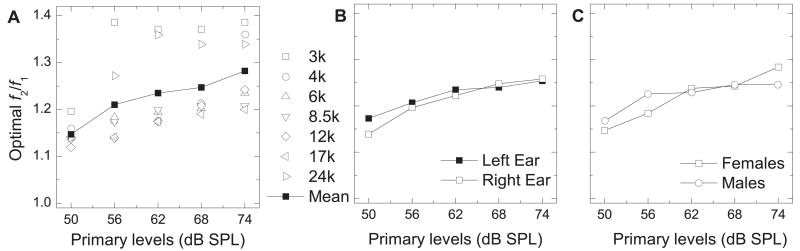
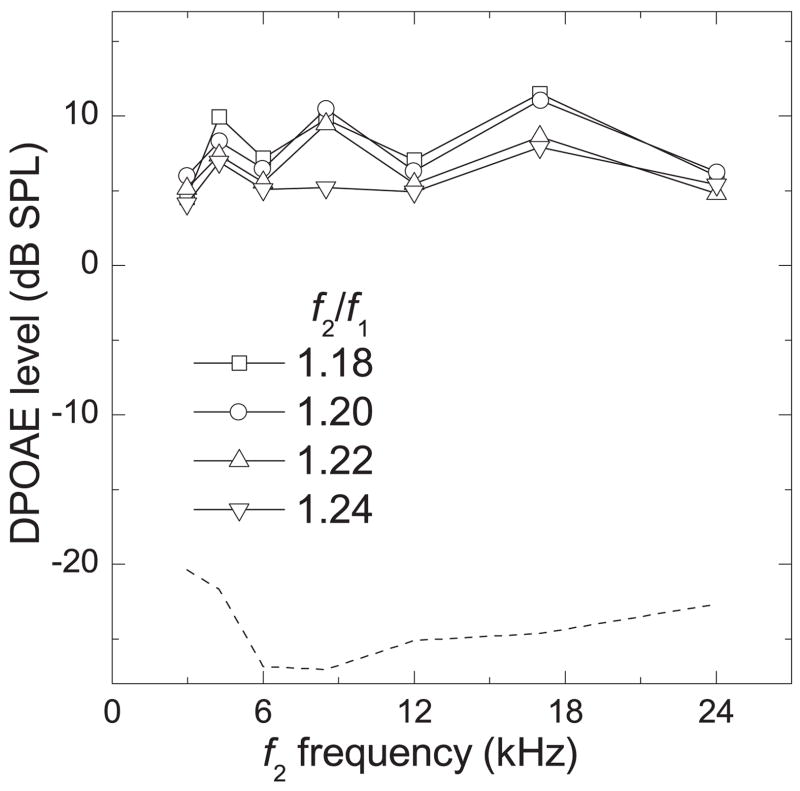
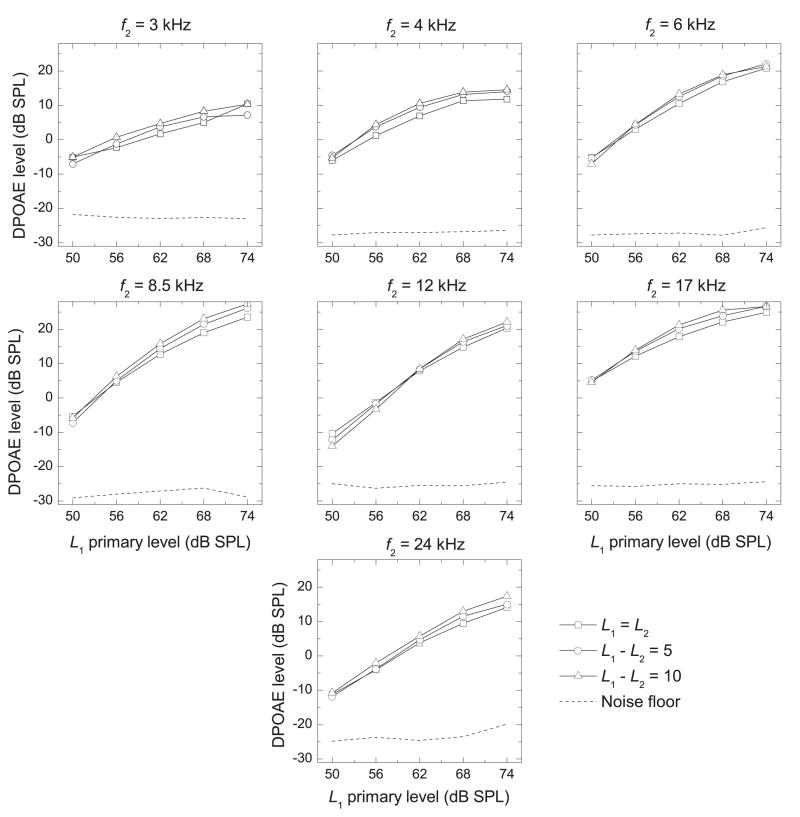
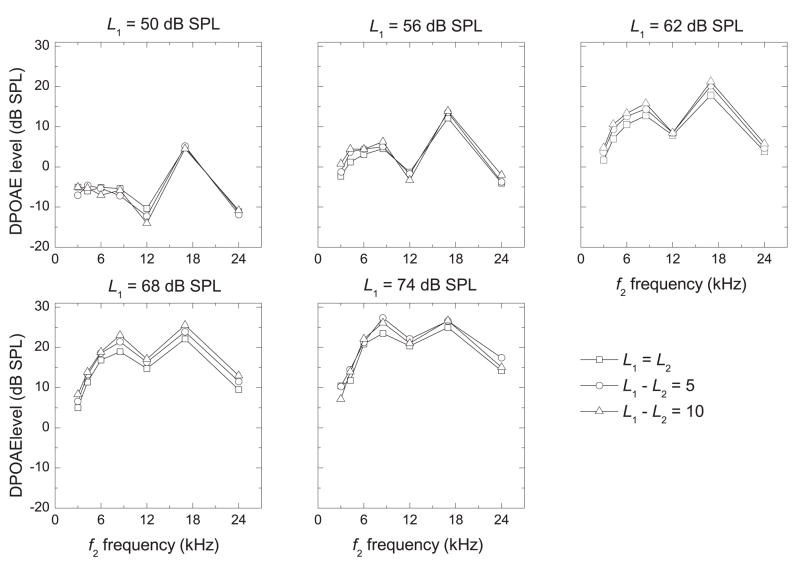
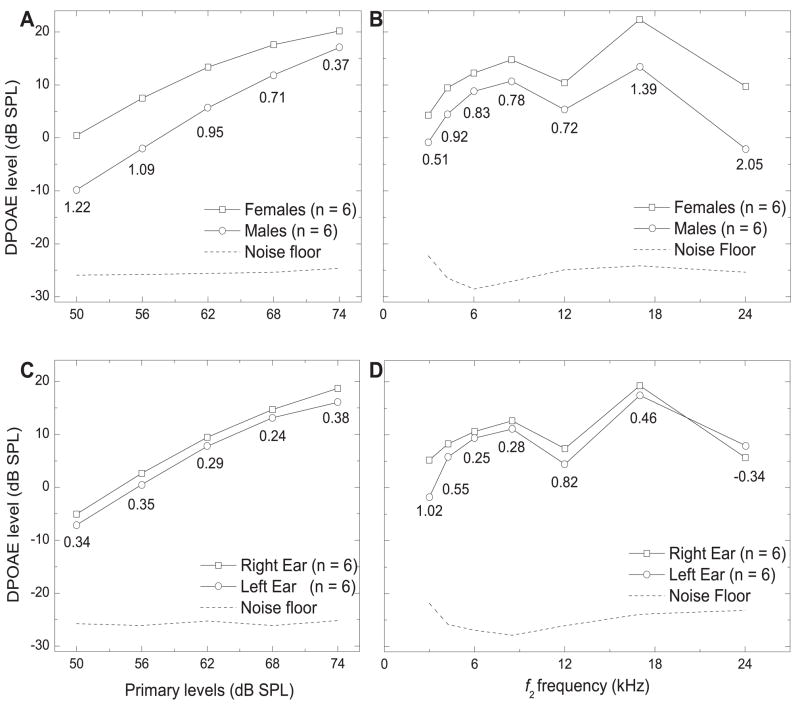
Distortion-product otoacoustic emissions (DPOAEs) were measured in a New World primate, the common marmoset (Callithrix jacchus). We determined the optimal primary-tone frequency ratio (f(2)/f(1)) to generate DPOAEs of maximal amplitude between 3 and 24 kHz. The optimal f(2)/f(1), determined by varying f(2)/f(1) from 1.02 to 1.40 using equilevel primary tones, decreased with increasing f(2) frequency between 3 and 17 kHz, and increased at 24 kHz. The optimal f(2)/f(1) ratio increased with increasing primary-tone levels from 50 to 74 dB SPL. When all stimulus parameters were considered, the mean optimal f(2)/f(1) was 1.224-1.226. Additionally, we determined the effect of reducing L(2) below L(1). Decreasing L(2) below L(1) by 0, 5, and 10 dB (f(2)/f(1)=1.21) minimally affected DPOAE strength. DPOAE levels were stronger in females than males and stronger in the right ear than the left, just as in humans. This study is the first to measure OAEs in the marmoset, and the results indicate that the effect of varying the frequency ratio and primary-tone level difference on marmoset DPOAEs is similar to the reported effects in humans and Old World primates.
Figures
Similar articles
-
Reliability of distortion-product otoacoustic emissions in the common marmoset (Callithrix jacchus).Hear Res. 2011 Dec;282(1-2):265-71. doi: 10.1016/j.heares.2011.07.004. Epub 2011 Jul 27. Hear Res. 2011. PMID: 21801824 Free PMC article.
-
Repeatability of high-frequency distortion-product otoacoustic emissions in normal-hearing adults.Ear Hear. 2006 Oct;27(5):466-79. doi: 10.1097/01.aud.0000233892.37803.1a. Ear Hear. 2006. PMID: 16957498
-
Two-source interference as the major reason for auditory-threshold estimation error based on DPOAE input-output functions in normal-hearing subjects.Hear Res. 2013 Feb;296:67-82. doi: 10.1016/j.heares.2012.12.003. Epub 2012 Dec 23. Hear Res. 2013. PMID: 23268357
-
Sensitivity of distortion-product otoacoustic emissions in humans to tonal over-exposure: time course of recovery and effects of lowering L2.Hear Res. 1994 May;75(1-2):161-74. doi: 10.1016/0378-5955(94)90067-1. Hear Res. 1994. PMID: 8071143
-
Suppression and enhancement of distortion-product otoacoustic emissions by interference tones above f(2). II. Findings in humans.Hear Res. 2003 Mar;177(1-2):111-22. doi: 10.1016/s0378-5955(03)00028-5. Hear Res. 2003. PMID: 12618323
Cited by
-
Reliability of distortion-product otoacoustic emissions in the common marmoset (Callithrix jacchus).Hear Res. 2011 Dec;282(1-2):265-71. doi: 10.1016/j.heares.2011.07.004. Epub 2011 Jul 27. Hear Res. 2011. PMID: 21801824 Free PMC article.
-
The marmoset as a model of aging and age-related diseases.ILAR J. 2011;52(1):54-65. doi: 10.1093/ilar.52.1.54. ILAR J. 2011. PMID: 21411858 Free PMC article.
-
Sex Genotyping of Archival Fixed and Immunolabeled Guinea Pig Cochleas.Sci Rep. 2018 Mar 26;8(1):5156. doi: 10.1038/s41598-018-23491-3. Sci Rep. 2018. PMID: 29581456 Free PMC article.
-
Sexual orientation and the auditory system.Front Neuroendocrinol. 2011 Apr;32(2):201-13. doi: 10.1016/j.yfrne.2011.02.001. Epub 2011 Feb 12. Front Neuroendocrinol. 2011. PMID: 21310172 Free PMC article. Review.
-
Age-related shifts in distortion product otoacoustic emissions peak-ratios and amplitude modulation spectra.Hear Res. 2015 Sep;327:186-98. doi: 10.1016/j.heares.2015.07.017. Epub 2015 Jul 29. Hear Res. 2015. PMID: 26232530 Free PMC article.
References
-
- Abdala C. Distortion product otoacoustic emission (2f1 – f2) amplitude as a function of f2/f1 frequency ratio and primary tone level separation in human adults and neonates. J Acoust Soc Am. 1996;100:3726–3740. - PubMed
-
- Allen JB. User Manual for the CUBDIS Distortion Product Measurement System. AT & T Bell Labs; 1990a.
-
- Allen JB. Modeling the noise damaged cochlea. In: Dallos P, Geisler CD, Matthews JW, Ruggero MA, Steele CR, editors. The Mechanics and Biophysics of Hearing; Proceedings of a conference held at the University of Wisconsin; Madison, WI. 25 – 29 June 1990; New York: Springer; 1990b. pp. 324–332.
-
- Barros M, Giorgetti M, Souto AA, Vilela G, Santos K, Baos NV, Tomaz C. Persistent anxiety-like behavior in marmosets following a recent predatory stress condition: reversal by diazepam. Pharmacol Biochem Behav. 2007;86:705–711. - PubMed
-
- Bartlett EL, Wang X. Neural representations of temporally modulated signals in the auditory thalamus of awake primates. J Neurophysiol. 2007;97:1005–1017. - PubMed
Publication types
MeSH terms
Grants and funding
LinkOut - more resources
Full Text Sources
Miscellaneous
