

Neural correlates of novelty and face-age effects in young and elderly adults
- PMID: 18586522
- PMCID: PMC2613685
- DOI: 10.1016/j.neuroimage.2008.05.015
Neural correlates of novelty and face-age effects in young and elderly adults
Abstract
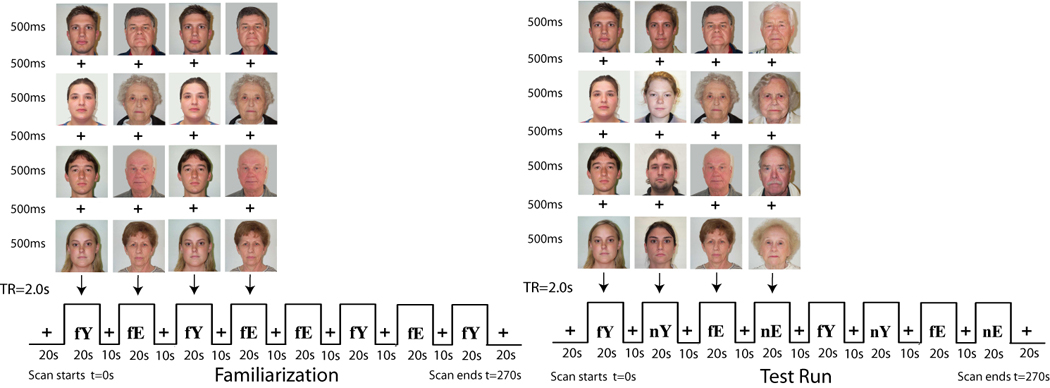
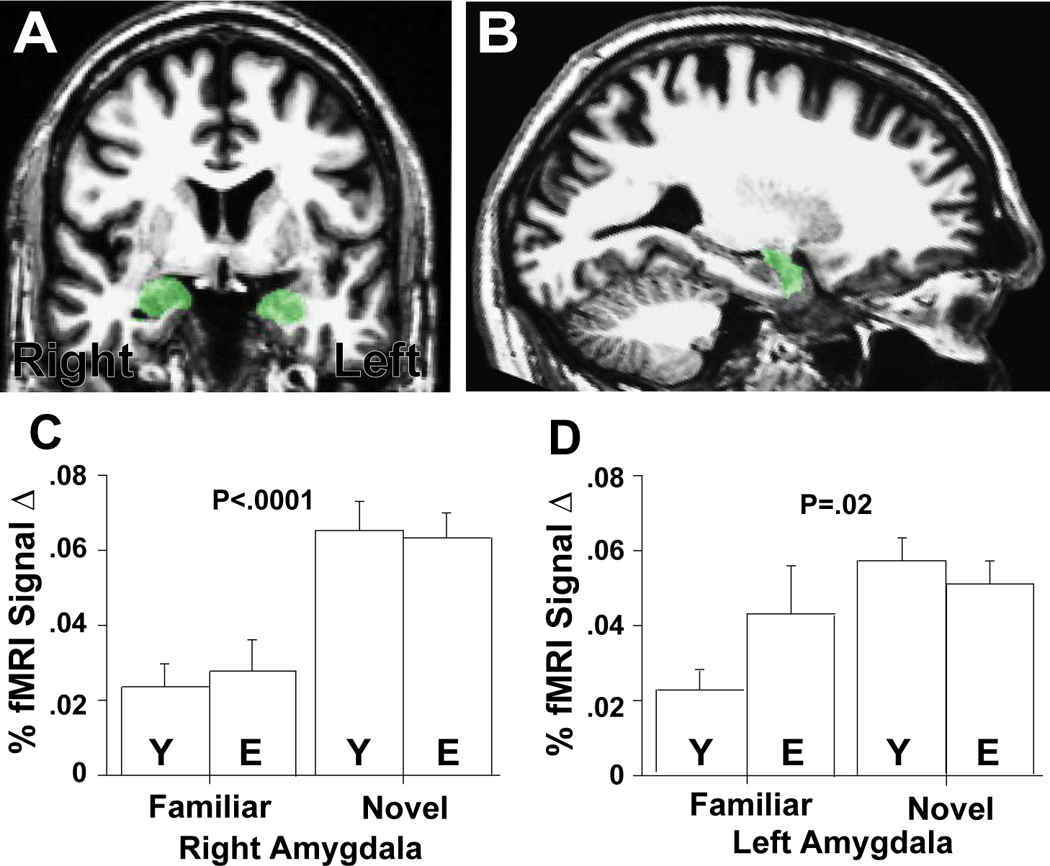
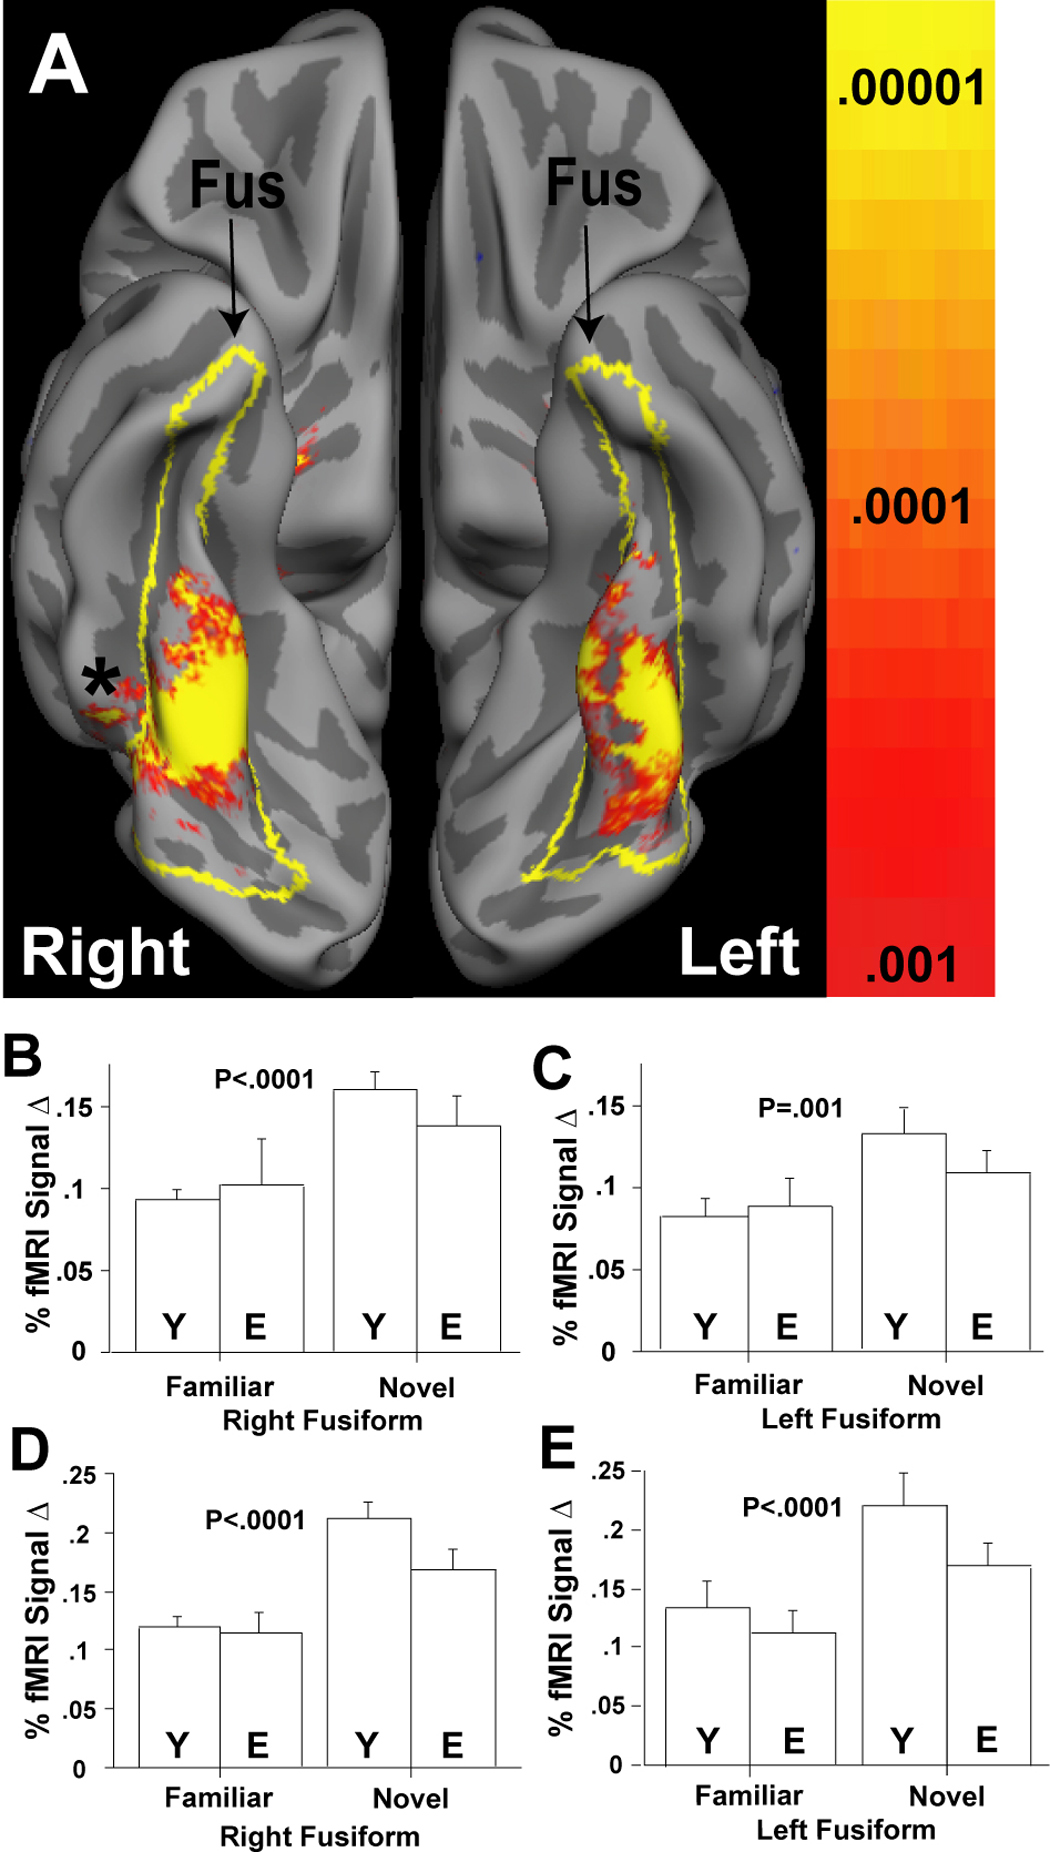
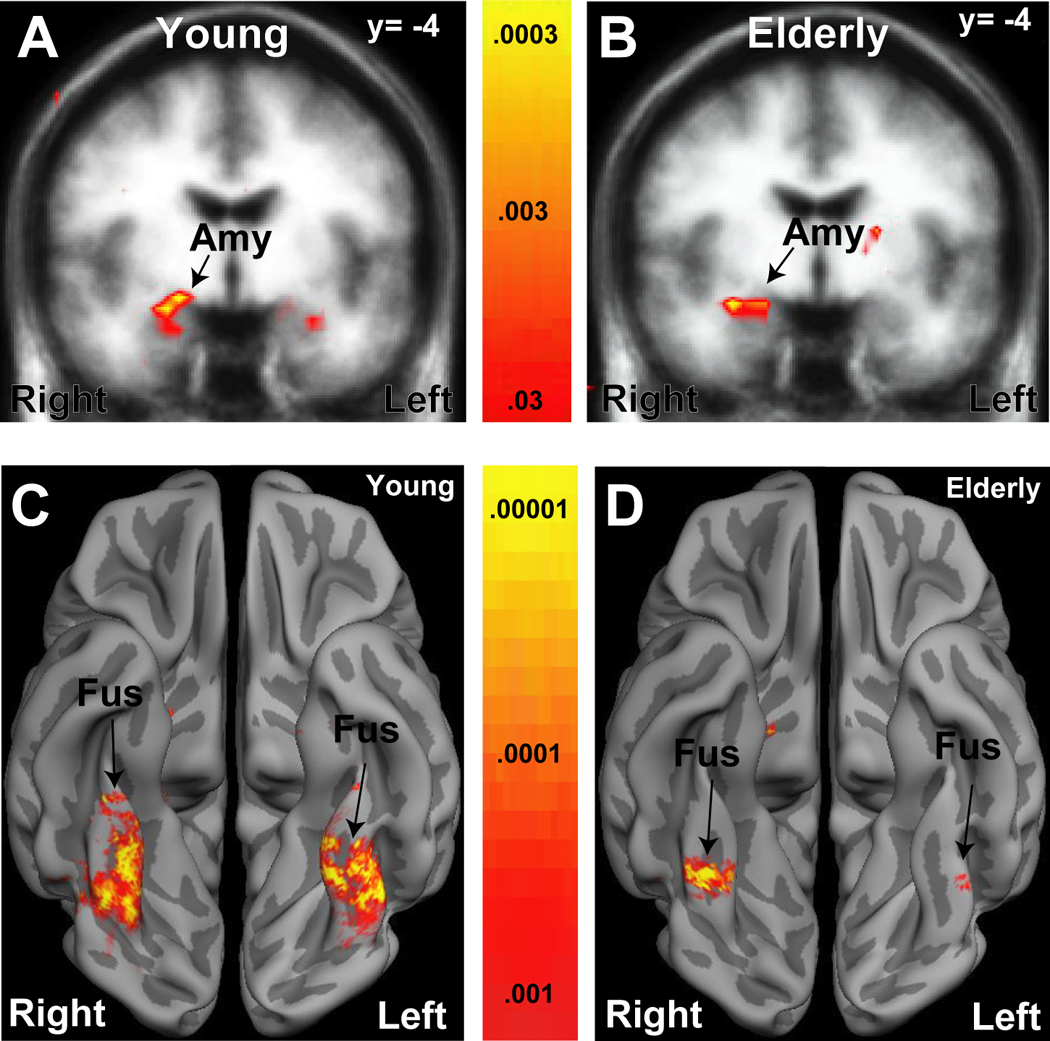
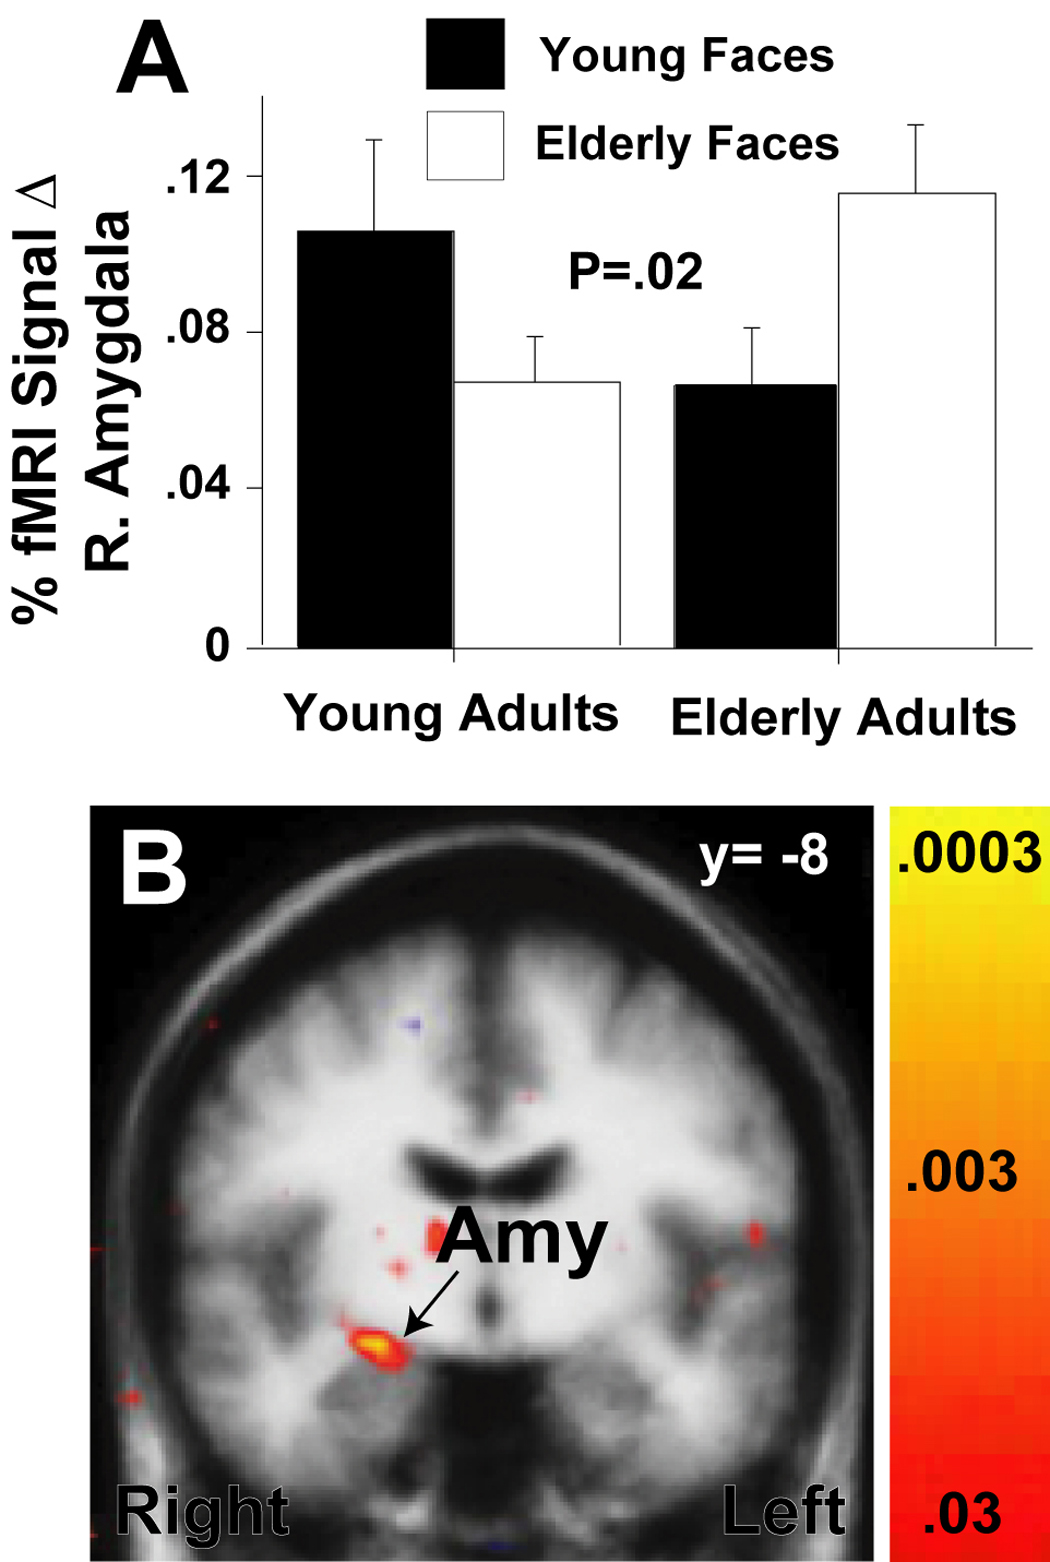
The human amygdala preferentially responds to objects of potential value, such as hedonically valenced and novel stimuli. Many studies have documented age-related differences in amygdala responses to valenced stimuli, but relatively little is known about age-related changes in the amygdala's response to novelty. This study examines whether there are differences in amygdala novelty responses in two different age groups. Healthy young and elderly adults viewed both young and elderly faces that were seen many times (familiar faces) or only once (novel faces) in the context of an fMRI study. We observed that amygdala responses to novel (versus familiar) faces were preserved with aging, suggesting that novelty processing in the amygdala remains stable across the lifespan. In addition, participants demonstrated larger amygdala responses to target faces of the same age group than to age out-group target faces (i.e., an age in-group effect). Differences in anatomic localization and behavioral results suggest that novelty and age in-group effects were differentially processed in the amygdala.
Figures
Similar articles
-
Novel fearful faces activate the amygdala in healthy young and elderly adults.Neurobiol Aging. 2006 Feb;27(2):361-74. doi: 10.1016/j.neurobiolaging.2005.01.014. Epub 2005 Apr 13. Neurobiol Aging. 2006. PMID: 16399218
-
Amygdala temporal dynamics: temperamental differences in the timing of amygdala response to familiar and novel faces.BMC Neurosci. 2009 Dec 10;10:145. doi: 10.1186/1471-2202-10-145. BMC Neurosci. 2009. PMID: 20003287 Free PMC article.
-
Differential amygdala habituation to neutral faces in young and elderly adults.Neurosci Lett. 2005 Sep 9;385(2):114-9. doi: 10.1016/j.neulet.2005.05.039. Neurosci Lett. 2005. PMID: 15961229
-
The changing face of emotion: age-related patterns of amygdala activation to salient faces.Soc Cogn Affect Neurosci. 2011 Jan;6(1):12-23. doi: 10.1093/scan/nsq007. Epub 2010 Mar 1. Soc Cogn Affect Neurosci. 2011. PMID: 20194512 Free PMC article.
-
Novelty responses and differential effects of order in the amygdala, substantia innominata, and inferior temporal cortex.Neuroimage. 2003 Mar;18(3):660-9. doi: 10.1016/s1053-8119(02)00037-x. Neuroimage. 2003. PMID: 12667843
Cited by
-
ERP evidence for own-age effects on late stages of processing sad faces.Cogn Affect Behav Neurosci. 2016 Aug;16(4):635-45. doi: 10.3758/s13415-016-0420-9. Cogn Affect Behav Neurosci. 2016. PMID: 27032958
-
The hippocampus shows an own-age bias during unfamiliar face viewing.Eur J Neurosci. 2021 Dec;54(11):7876-7885. doi: 10.1111/ejn.15523. Epub 2021 Nov 24. Eur J Neurosci. 2021. PMID: 34755395 Free PMC article.
-
Neural Processing of Emotional Prosody across the Adult Lifespan.Biomed Res Int. 2015;2015:590216. doi: 10.1155/2015/590216. Epub 2015 Oct 25. Biomed Res Int. 2015. PMID: 26583118 Free PMC article.
-
The Affective Neuroscience of Aging.Annu Rev Psychol. 2016;67:213-38. doi: 10.1146/annurev-psych-122414-033540. Epub 2015 Oct 2. Annu Rev Psychol. 2016. PMID: 26436717 Free PMC article. Review.
-
Functional neuroimaging studies of aging and emotion: fronto-amygdalar differences during emotional perception and episodic memory.J Int Neuropsychol Soc. 2009 Nov;15(6):819-25. doi: 10.1017/S1355617709990439. Epub 2009 Aug 25. J Int Neuropsychol Soc. 2009. PMID: 19703320 Free PMC article. Review.
References
-
- Amaral DG. The amygdala, social behavior, and danger detection. Ann N Y Acad Sci. 2003;1000:337–347. - PubMed
-
- American Psychiatric Association. Diagnostic and statistical manual of mental disorders. 4 Edition. Washington, DC: American Psychiatric Association; 1994.
-
- Anastasi JS, Rhodes MG. An own-age bias in face recognition for children and older adults. Psychon Bull Rev. 2005;12:1043–1047. - PubMed
-
- Benton A, Hamsher K, Varney N, Spreen O. Contributions to neuropsychological assessment: A clinical manual. New York: Oxford University Press; 1983.
Publication types
MeSH terms
Grants and funding
LinkOut - more resources
Full Text Sources
Medical
