. 2008 Jul 1;24(13):i223-31.
doi: 10.1093/bioinformatics/btn161.

Identifying functional modules in protein-protein interaction networks: an integrated exact approach

Affiliations

Identifying functional modules in protein-protein interaction networks: an integrated exact approach

Marcus T Dittrich et al. Bioinformatics. .

Abstract

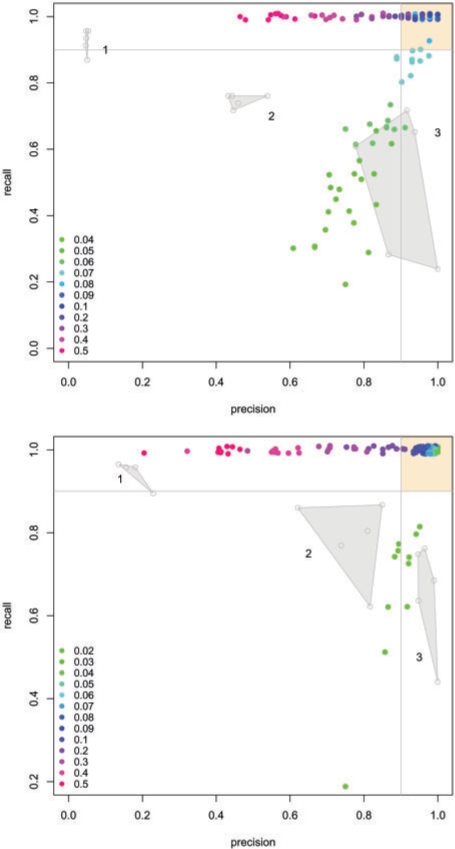
Motivation: With the exponential growth of expression and protein-protein interaction (PPI) data, the frontier of research in systems biology shifts more and more to the integrated analysis of these large datasets. Of particular interest is the identification of functional modules in PPI networks, sharing common cellular function beyond the scope of classical pathways, by means of detecting differentially expressed regions in PPI networks. This requires on the one hand an adequate scoring of the nodes in the network to be identified and on the other hand the availability of an effective algorithm to find the maximally scoring network regions. Various heuristic approaches have been proposed in the literature.

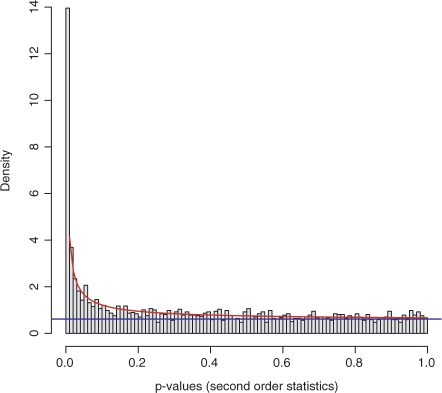
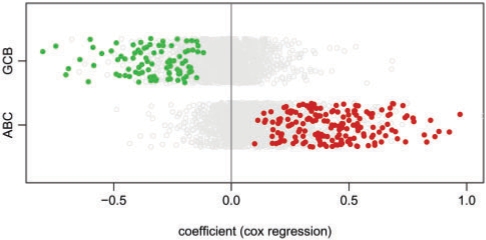
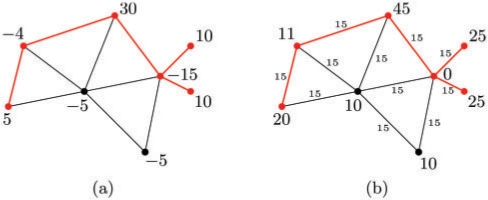
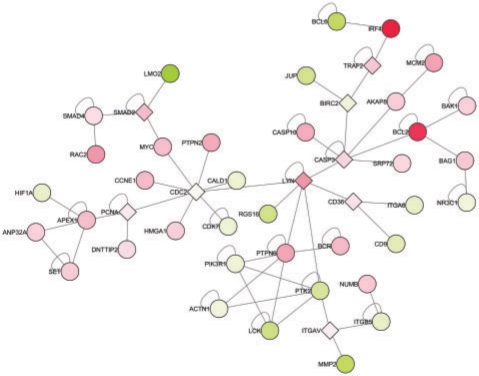
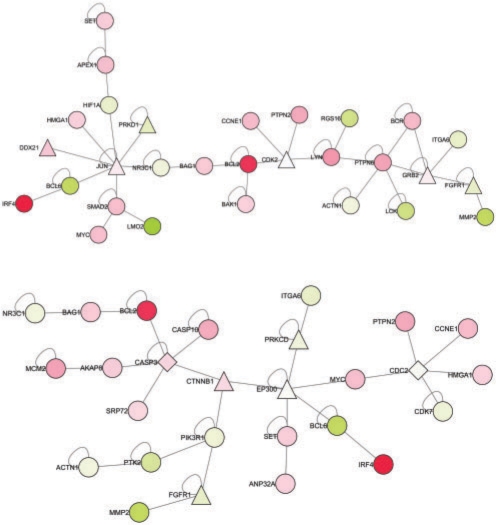
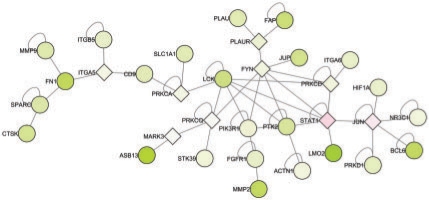
Results: Here we present the first exact solution for this problem, which is based on integer-linear programming and its connection to the well-known prize-collecting Steiner tree problem from Operations Research. Despite the NP-hardness of the underlying combinatorial problem, our method typically computes provably optimal subnetworks in large PPI networks in a few minutes. An essential ingredient of our approach is a scoring function defined on network nodes. We propose a new additive score with two desirable properties: (i) it is scalable by a statistically interpretable parameter and (ii) it allows a smooth integration of data from various sources. We apply our method to a well-established lymphoma microarray dataset in combination with associated survival data and the large interaction network of HPRD to identify functional modules by computing optimal-scoring subnetworks. In particular, we find a functional interaction module associated with proliferation over-expressed in the aggressive ABC subtype as well as modules derived from non-malignant by-stander cells.

Availability: Our software is available freely for non-commercial purposes at http://www.planet-lisa.net.


Figures

Fig. 1.
Fig. 1.
The fitted mixture model fits nicely the empirical distribution. The parameters of the mixture model are a=0.276 and λ=0.563. The histogram of the observed P-values displays the strong consistency with the expected densities under the fitted model (red line). The blue line indicates the fraction of P-values derived from the uniform noise model. The excellent fit of the model has been confirmed in a Q–Q plot of the fitted distribution versus the empirical P-value distribution (data not shown).
Fig. 2.
Fig. 2.
Scoring of combined P-values. All genes have been assigned to the ABC and GCB subtype-based fold changes. The x-axis shows coefficients of the univariate Cox proportional hazards regression model fitted for each gene separately. A coefficient greater than zero denotes an increased risk association. Genes scoring positively by our combined scoring function (for a FDR of 0.01) are colored. This evidences that our score selects genes specifically associated with the different malignancy of the two tumor subtypes.
Fig. 3.
Fig. 3.
Example of an MWCS instance (a) and its transformed PCST counterpart (b). The minimum weight in (a) is −15. Optimal solutions are marked in red color. The MWCS has weight 36, the optimal PCST has profit 126−75=51(=36+15).
Fig. 4.
Fig. 4.
Optimal subnetwork detected using a score based on the P-values of a gene-wise two sided t-test and an univariate Cox regression hazard model. A restrictive threshold equivalent to an FDR of 0.001 was used. The derived subnetwork captures the characteristically differentially expressed-interaction modules associated with the increased malignancy of the ABC subtype. Coloring is according to the fold change where red denotes an over-expression in ABC and green in GCB. Diamond nodes represent negative-scoring genes additionally included in the optimal solution.
Fig. 5.
Fig. 5.
Examples of suboptimal solutions corresponding to the optimal solution depicted in Figure 4. A Hamming distance of 50% was requested for these solutions. Both subgraphs share 23 nodes with the optimal solution (circles) but also include new ones (triangles). The upper solution achieves a score of 61.5 (87.7%), the lower solution has a score of 52.5 (74.8%) as compared to the optimal solution (70.2). The addition of FGFR1 (first and second suboptimal solution) and GRB2 (first suboptimal solution) within the ‘by-stander cell module’ highlights the biologically relevant interaction between the malignant B-cells and the non-neoplastic network of by-stander cells.
Fig. 6.
Fig. 6.
Optimal subnetwork detected using a score based on the P-values of a one sided t-test for over-expression in GCB and survival as in Figure 4 for an FDR of 0.05.
Fig. 7.
Fig. 7.
Plot of the recall versus precision of a batch of solutions calculated for wide range of FDRs with 10 replications each. For the algorithm by Ideker et al. (2002) we display the convex hulls of solutions obtained by applying their algorithm recursively three times to five independent simulations. We evaluated two different signal component sizes (46, upper plot and 143, lower plot) with the same procedure. Clearly, the presented exact approach captures the signal with high precision and recall over a relatively large range of FDRs. None of the solutions delivered by the heuristic approach falls within the upper right region of high precision and high recall (colored in yellow). For better visualization data points have been jittered in y-direction.

References

    1. Aittokallio T, Schwikowski B. Graph-based methods for analysing networks in cell biology. Brief. Bioinform. 2006;7:243–255. - PubMed
    1. Andersen P, Gill R. Cox's regression model for counting processes: a large sample study. Ann. Stat. 1982;10:1100–1120.
    1. Blenk S, et al. Germinal center B cell-like (GCB) and activated B cell-like (ABC) type of diffuse large B cell lymphoma (DLBCL): analysis of molecular predictors, signatures, cell cycle state and patient survival. Cancer Inform. 2007;3:409–430. - PMC - PubMed
    1. Byrd RH, et al. A limited memory algorithm for bound constrained optimization. SIAM J. Sci. Comput. 1995;16:1190–1208.
    1. Cabusora L, et al. Differential network expression during drug and stress response. Bioinformatics. 2005;21:2898–2905. - PubMed