

ProSOM: core promoter prediction based on unsupervised clustering of DNA physical profiles
- PMID: 18586720
- PMCID: PMC2718650
- DOI: 10.1093/bioinformatics/btn172
ProSOM: core promoter prediction based on unsupervised clustering of DNA physical profiles
Abstract
Motivation: More and more genomes are being sequenced, and to keep up with the pace of sequencing projects, automated annotation techniques are required. One of the most challenging problems in genome annotation is the identification of the core promoter. Because the identification of the transcription initiation region is such a challenging problem, it is not yet a common practice to integrate transcription start site prediction in genome annotation projects. Nevertheless, better core promoter prediction can improve genome annotation and can be used to guide experimental work.
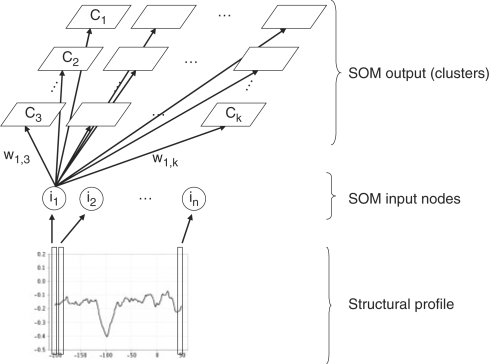
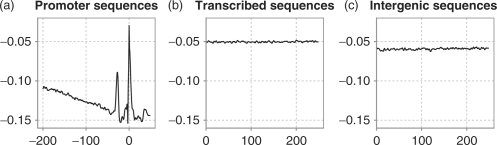
Results: Comparing the average structural profile based on base stacking energy of transcribed, promoter and intergenic sequences demonstrates that the core promoter has unique features that cannot be found in other sequences. We show that unsupervised clustering by using self-organizing maps can clearly distinguish between the structural profiles of promoter sequences and other genomic sequences. An implementation of this promoter prediction program, called ProSOM, is available and has been compared with the state-of-the-art. We propose an objective, accurate and biologically sound validation scheme for core promoter predictors. ProSOM performs at least as well as the software currently available, but our technique is more balanced in terms of the number of predicted sites and the number of false predictions, resulting in a better all-round performance. Additional tests on the ENCODE regions of the human genome show that 98% of all predictions made by ProSOM can be associated with transcriptionally active regions, which demonstrates the high precision.
Availability: Predictions for the human genome, the validation datasets and the program (ProSOM) are available upon request.
Figures
Similar articles
-
Decomposition of overlapping patterns by cumulative local cross-correlation.J Bioinform Comput Biol. 2006 Apr;4(2):571-87. doi: 10.1142/s021972000600193x. J Bioinform Comput Biol. 2006. PMID: 16819803
-
Gene function prediction based on genomic context clustering and discriminative learning: an application to bacteriophages.BMC Bioinformatics. 2007 May 22;8 Suppl 4(Suppl 4):S6. doi: 10.1186/1471-2105-8-S4-S6. BMC Bioinformatics. 2007. PMID: 17570149 Free PMC article.
-
SpliceMachine: predicting splice sites from high-dimensional local context representations.Bioinformatics. 2005 Apr 15;21(8):1332-8. doi: 10.1093/bioinformatics/bti166. Epub 2004 Nov 25. Bioinformatics. 2005. PMID: 15564294
-
An overview of gene identification: approaches, strategies, and considerations.Curr Protoc Bioinformatics. 2004 Sep;Chapter 4:Unit4.1. doi: 10.1002/0471250953.bi0401s6. Curr Protoc Bioinformatics. 2004. PMID: 18428724 Review.
-
Towards accurate human promoter recognition: a review of currently used sequence features and classification methods.Brief Bioinform. 2009 Sep;10(5):498-508. doi: 10.1093/bib/bbp027. Epub 2009 Jun 16. Brief Bioinform. 2009. PMID: 19531545 Review.
Cited by
-
A new avenue for classification and prediction of olive cultivars using supervised and unsupervised algorithms.PLoS One. 2012;7(9):e44164. doi: 10.1371/journal.pone.0044164. Epub 2012 Sep 5. PLoS One. 2012. PMID: 22957050 Free PMC article.
-
ElemeNT: a computational tool for detecting core promoter elements.Transcription. 2015;6(3):41-50. doi: 10.1080/21541264.2015.1067286. Transcription. 2015. PMID: 26226151 Free PMC article.
-
70ProPred: a predictor for discovering sigma70 promoters based on combining multiple features.BMC Syst Biol. 2018 Apr 24;12(Suppl 4):44. doi: 10.1186/s12918-018-0570-1. BMC Syst Biol. 2018. PMID: 29745856 Free PMC article.
-
Eukaryotic and prokaryotic promoter prediction using hybrid approach.Theory Biosci. 2011 Jun;130(2):91-100. doi: 10.1007/s12064-010-0114-8. Epub 2010 Nov 3. Theory Biosci. 2011. PMID: 21046474
-
Structural properties of prokaryotic promoter regions correlate with functional features.PLoS One. 2014 Feb 7;9(2):e88717. doi: 10.1371/journal.pone.0088717. eCollection 2014. PLoS One. 2014. PMID: 24516674 Free PMC article.
References
-
- Bajic VB, Brusic V. Computational detection of vertebrate RNA polymerase II promoters. Methods Enzymol. 2003;370:237–250. - PubMed
-
- Bajic VB, et al. Dragon Promoter Finder: recognition of vertebrate RNA polymerase II promoters. Bioinformatics. 2002;18:198–199. - PubMed
-
- Bajic VB, et al. Promoter prediction analysis on the whole human genome. Nat. Biotechnol. 2004;22:1467–1473. - PubMed
Publication types
MeSH terms
LinkOut - more resources
Full Text Sources
Other Literature Sources
Molecular Biology Databases
