. 2008 Sep;7(9):1518-29.
doi: 10.1128/EC.00081-08. Epub 2008 Jun 27.

A thioredoxin family protein of the apicoplast periphery identifies abundant candidate transport vesicles in Toxoplasma gondii

Affiliations

A thioredoxin family protein of the apicoplast periphery identifies abundant candidate transport vesicles in Toxoplasma gondii

Amy E DeRocher et al. Eukaryot Cell. 2008 Sep.

Abstract

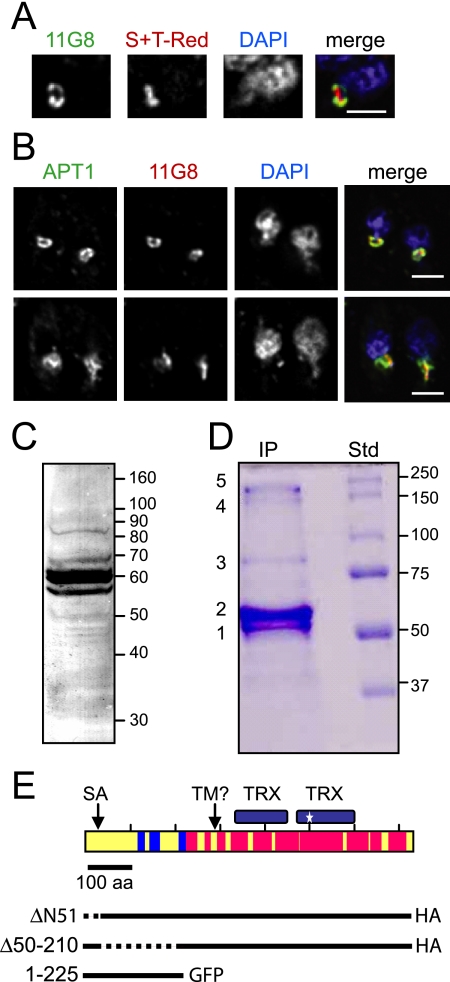
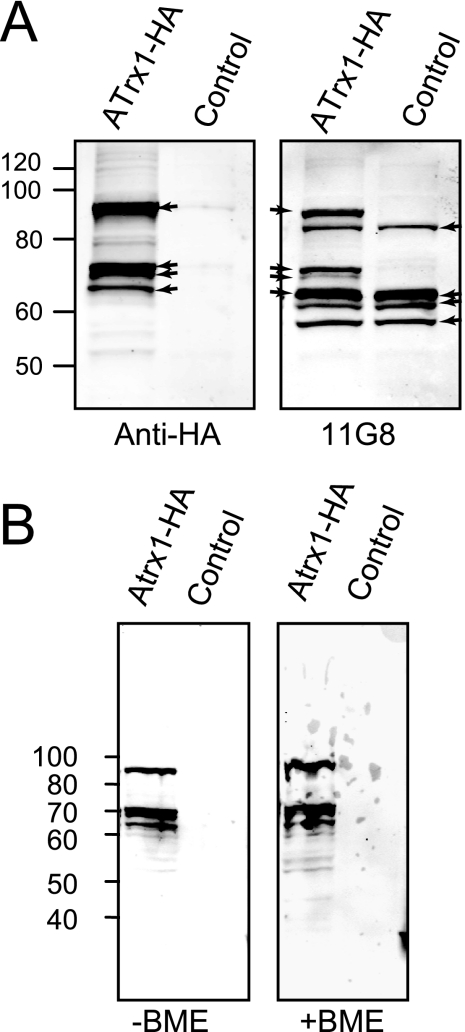
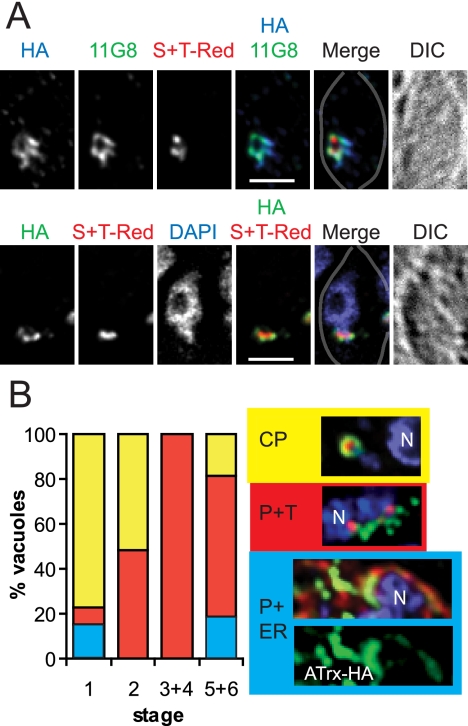
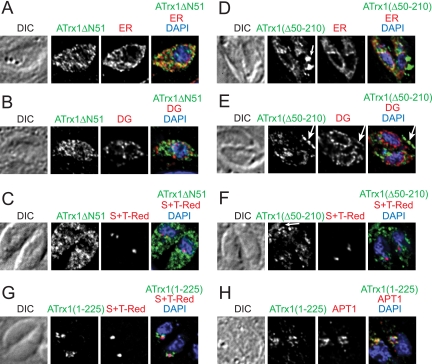
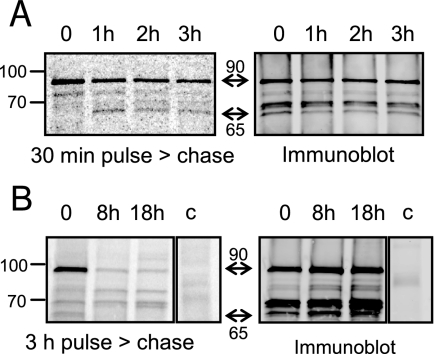
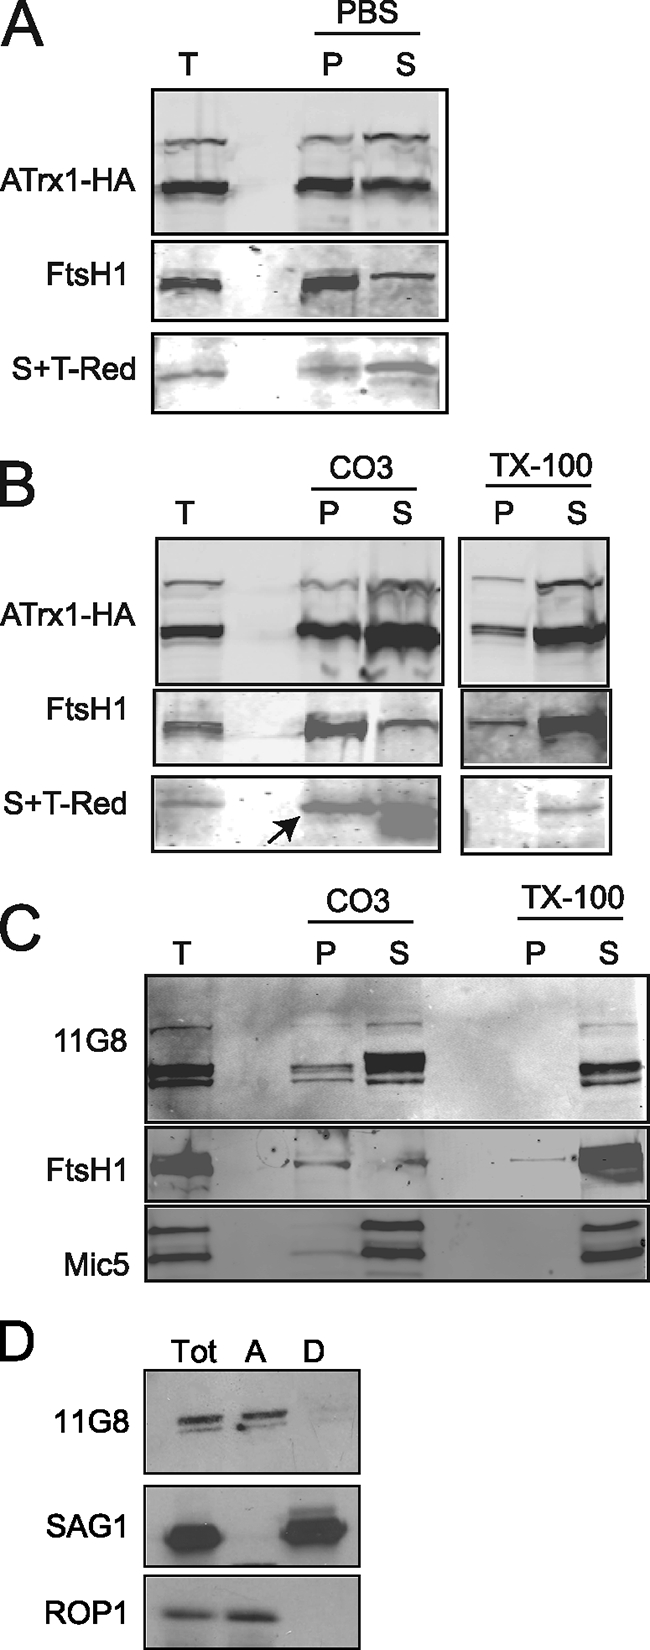
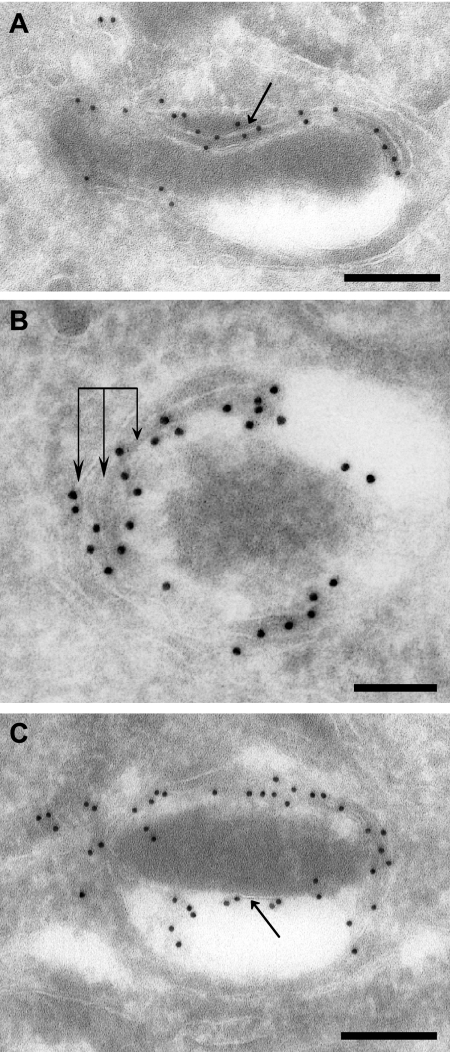
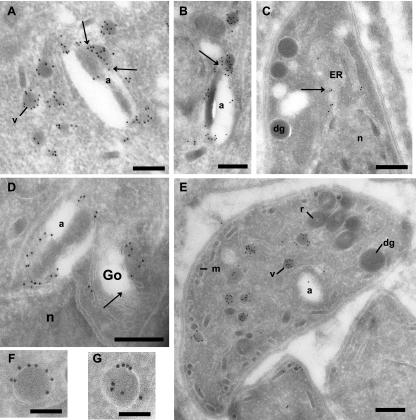
Toxoplasma gondii, which causes toxoplasmic encephalitis and birth defects, contains an essential chloroplast-related organelle to which proteins are trafficked via the secretory system. This organelle, the apicoplast, is bounded by multiple membranes. In this report we identify a novel apicoplast-associated thioredoxin family protein, ATrx1, which is predominantly soluble or peripherally associated with membranes, and which localizes primarily to the outer compartments of the organelle. As such, it represents the first protein to be identified as residing in the apicoplast intermembrane spaces. ATrx1 lacks the apicoplast targeting sequences typical of luminal proteins. However, sequences near the N terminus are required for proper targeting of ATrx1, which is proteolytically processed from a larger precursor to multiple smaller forms. This protein reveals a population of vesicles, hitherto unrecognized as being highly abundant in the cell, which may serve to transport proteins to the apicoplast.


Figures

FIG. 1.
FIG. 1.
Identification of ATrx1. (A) IFAs using MAb 11G8; S+TACP-HcRed (S+T-Red), a marker for the apicoplast lumen; and DAPI. Each panel is labeled according to the color shown in the merged image: green for MAb 11G8 (detected with FITC-coupled rabbit anti-mouse immunoglobulin), red for apicoplast lumen, and blue for DAPI. Bar, 2 μm. (B) IFA using MAb 11G8; APT1-HA, a marker for the apicoplast membranes; and DAPI. Each panel is labeled according to the color shown in the merged image: red for MAb 11G8 (detected with anti-mouse IgG1 coupled to Texas Red), green for apicoplast membranes (detected with FITC-coupled anti-HA antibody), and blue for DAPI. Bar, 2 μm. (C) Protein from 107 wild-type parasites was separated on a 10% acrylamide gel, transferred to nitrocellulose, and probed with MAb 11G8. Numbers on the right indicate the migration of molecular mass markers. (D) Immunopurification of MAb 11G8-reactive proteins, Coomassie blue-stained gel. Numbered bands from the immunopurified protein (IP) were subjected to mass spectrometric analysis. Std, molecular mass markers. (E) Diagram of ATrx1 and peptide coverage from mass spectrometry. Red indicates regions from bands 1 and 2 covered by detected peptides. Blue indicates where additional peptides were found in band 3. Details are shown in Fig. S1 in the supplemental material. No peptides were found for yellow regions. The location of the predicted signal anchor (SA) and putative TMD are indicated, as well as the thioredoxin domains. The predicted active site is marked with a star. Below the diagram, three deletion mutants are diagrammed, with dashed lines indicating sequences deleted near the N terminus.
FIG. 2.
FIG. 2.
Western blot, showing multiple bands with MAb 11G8 and anti-HA. (A) Lysates of parasites expressing ATrx1-HA or control parasites not expressing an HA-tagged protein were separated on 7.5% acrylamide gels and analyzed by immunoblot analysis using anti-HA and MAb 11G8. Note the additional, slightly larger bands detected in ATrx1-HA transfectants which comigrate with those detected by anti-HA. The same pattern was seen in an independent transfectant. The migration of molecular mass markers is indicated. Arrows mark the bands described in the text. (B) Reducing (+BME, β-mercaptoethanol) and nonreducing (−BME) gels show similar patterns. Samples were separated on 10% acrylamide gels and analyzed by immunoblot analysis using anti-HA. The cell lines used were ATrx1-HA transfectants and the parental line RH (control). The migration of molecular mass markers is indicated.
FIG. 3.
FIG. 3.
Epitope-tagged ATrx1 localizes to the apicoplast. (A) IFA of transfectants expressing ATrx1-HA. The bottom set of panels shows a circumplastid localization of both the HA-tagged protein and the MAb 11G8 antigen, while the upper set shows more additional extended tubules. Each panel is labeled according to the color shown in the merged images, and the outline of the parasite within the vacuole is marked as a gray line on the merged image. Bar, 2 μm. (B) Localization of ATrx1-HA is modulated during the cell cycle. Cells in different vacuoles were staged according to the shape and location of the apicoplast, the shape and division of the nucleus, and the formation of the inner membrane complex (46) as follows: stage 1, round apicoplast is away from nucleus; stage 2, apicoplasts begin to elongate and move closer to the nucleus; stage 3, the apicoplast elongates further and extends across the apical face of the nucleus; stage 4, the daughter cell IMC is visible (as revealed by anti-IMC1) and the apicoplast is V-shaped; stage 5, the apicoplast has divided; and stage 6, nuclear division is complete. The proportion of vacuoles with different distribution patterns for ATrx1 during the plastid and cell division cycle is shown graphically. The patterns were tabulated as circumplastid (CP, yellow shading), plastid plus tubule (P+T, red shading) and plastid plus ER (P+ER, blue shading). Next to the key, examples of the staining patterns categorized are shown. In these images, ATrx1-HA is green and DAPI is blue. In the CP and P+T panels, the apicoplast luminal marker (S+TACP-HcRed) is red; in the P+ER panel, the ER (as revealed by anti-BiP) is red. The nucleus is marked with an “N”. Note the perinuclear staining of ATrx1 in the plastid plus ER panel (green).
FIG. 4.
FIG. 4.
ATrx1 deletion analysis. Expression plasmids encoding ATrx1ΔN51-HA (A to C) ATrx1(Δ50-210)-HA (D to F), or ATrx(1-225)-GFP (G and H) were transfected either into T. gondii expressing S+TACP-HcRed (C, F, and G) or V5-APT1 (H) or into wild-type cells (A, B, D, and E). Cells were processed for IFA as follows. ER was visualized with rabbit anti-BiP, dense granules (DG) with anti-NTPase, the apicoplast lumen with S+TACP-HcRed, and the apicoplast membranes with V5-APT1 (as detected by anti-V5). GFP was detected with anti-GFP. Secondary antibodies were chosen to allow specificity and avoid spectral overlap. All samples were also stained with DAPI, and differential interference contrast (DIC) images of the vacuoles are shown.
FIG. 5.
FIG. 5.
Pulse-chase analysis. (A) ATrx1-HA intracellular parasites were labeled for 30 min with [35S]methionine-cysteine, and chased for the indicated times. Samples were subjected to immunoprecipitation with anti-HA and separated on an 8 to 16% acrylamide gel. Radiolabeled proteins were revealed by phosphorimaging, and the same blot was probed with rabbit anti-HA antibody. The migration of molecular mass markers is indicated on the left. Double-headed arrows mark the largest and smallest ATrx1 isoforms detected by phosphorimaging and immunoblotting. (B) ATrx1-HA intracellular parasites were labeled for 3 h with [35S]methionine-cysteine and chased for the indicated times. Samples were analyzed as described above, except that a 10% acrylamide gel was used. As a control to show that higher-molecular-mass bands seen with ATrx1-HA are specific, parasites expressing APT1-HA were labeled for 3 h and immunoprecipitated with anti-HA (lane c). The lane shown was from the same exposure of the same gel as the ATrx1-HA samples. APT1-HA is not visible because it migrates at ∼40 kDa.
FIG. 6.
FIG. 6.
Fractionation behavior of ATrx1. Immunoblot analysis was performed after various extractions. S+TACP-HcRed, Mic5, and ROP1 served as soluble protein markers, and FtsH1 and SAG1 served as membrane protein markers. (A) Transfectants expressing ATrx1-HA and the apicoplast luminal marker S+TACP-HcRed were Dounce homogenized in PBS, and large debris was removed by centrifugation. After high-speed centrifugation, the pellet (P) and supernatant (S) were analyzed by immunoblotting with anti-HA, anti-FtsH1, and anti-HcRed. The band corresponding to the mature form of S+TACP-HcRed is shown. (B) Transfectants expressing ATrx1-HA and S+TACP-HcRed were extracted with 0.1 M carbonate (pH 11) or 2% Triton X-100. After centrifugation to separate the soluble fraction (S) from insoluble pellet (P), both fractions were analyzed by immunoblotting with anti-HA, anti-FtsH1, and anti-HcRed. The band corresponding to the mature form of S+TACP-HcRed is shown (arrow); the lower band on this image is a low-molecular-mass protein that cross-reacts with anti-FtsH1. (C) T. gondii transfected with an irrelevant plasmid were extracted with 0.1 M carbonate (pH 11) or 2% Triton X-100. After centrifugation to separate the soluble fraction (S) from insoluble pellet (P), both fractions were analyzed by immunoblotting with MAb 11G8, anti-FtsH1, and anti-Mic5. (D) Wild-type parasites were extracted with Triton-X114 at 37°C, and the detergent (lane D) and aqueous (lane A) protein fractions were analyzed by immunoblotting with MAb 11G8 (1:1,000) followed by goat anti-mouse antibody coupled to horseradish peroxidase (1:1,000; Sigma). Detection was performed by using the ECL system (Pierce).
FIG. 7.
FIG. 7.
Fine localization of ATrx1 to subcompartments of the apicoplast. Infected fibroblasts were processed for immunogold labeling to reveal the fine distribution of ATrx1-HA. Panels A to C show apicoplasts containing ATrx1-gold particles. Panel A shows evidence of a membrane-bound association of the protein (arrow). Panel B reveals the presence of gold particles on multiple membranes of the apicoplast (triple arrows). Panel C illustrates the protein on a more internal membrane of the organelle (arrow). Bars: 200 nm in panels A and C; 100 nm in panel B.
FIG. 8.
FIG. 8.
Ultrastructural detection of ATrx1 associated with the apicoplast and small cytoplasmic vesicles. Panels A and B show gold particles on the apicoplast (a) and on vesicles (v) surrounding the apicoplast. Arrows pinpoint intimate contact between both structures, a finding suggestive of fusion or fission events. Panels C and D reveal the presence of Atrx1 frequently associated with the ER and occasionally on the Golgi complex (Go, arrows). Panel E shows that the labeled vesicles are very abundant and morphologically distinct from parasite secretory organelles such as dense granules (dg), micronemes (m), and rhoptries (r). ATrx1 is observed predominantly at the limiting membrane of the vesicles, as illustrated in panels F and G. Bars: 200 nm in panels A to D; 500 nm in panel E; 100 nm in panels F and G.

Similar articles

Cited by

References

    1. Balmer, Y., A. Koller, G. del Val, W. Manieri, P. Schurmann, and B. B. Buchanan. 2003. Proteomics gives insight into the regulatory function of chloroplast thioredoxins. Proc. Natl. Acad. Sci. USA 100370-375. - PMC - PubMed
    1. Bangs, J. D., L. Uyetake, M. J. Brickman, A. E. Balber, and J. C. Boothroyd. 1993. Molecular cloning and cellular localization of a BiP homologue in Trypanosoma brucei. Divergent ER retention signals in a lower eukaryote. J. Cell Sci. 1051101-1113. - PubMed
    1. Bermudes, D., K. R. Peck, M. A. Afifi, C. J. Beckers, and K. A. Joiner. 1994. Tandemly repeated genes encode nucleoside triphosphate hydrolase isoforms secreted into the parasitophorous vacuole of Toxoplasma gondii. J. Biol. Chem. 26929252-29260. - PubMed
    1. Bradley, P. J., C. Ward, S. J. Cheng, D. L. Alexander, S. Coller, G. H. Coombs, J. D. Dunn, D. J. Ferguson, S. J. Sanderson, J. M. Wastling, and J. C. Boothroyd. 2005. Proteomic analysis of rhoptry organelles reveals many novel constituents for host-parasite interactions in Toxoplasma gondii. J. Biol. Chem. 403425-34258. - PubMed
    1. Brayton, K. A., A. O. Lau, D. R. Herndon, L. Hannick, L. S. Kappmeyer, S. J. Berens, S. L. Bidwell, W. C. Brown, J. Crabtree, D. Fadrosh, T. Feldblum, H. A. Forberger, B. J. Haas, J. M. Howell, H. Khouri, H. Koo, D. J. Mann, J. Norimine, I. T. Paulsen, D. Radune, Q. Ren, R. K. Smith, Jr., C. E. Suarez, O. White, J. R. Wortman, D. P. Knowles, Jr., T. F. McElwain, and V. M. Nene. 2007. Genome sequence of Babesia bovis and comparative analysis of apicomplexan hemoprotozoa. PLoS Pathog. 31401-1413. - PMC - PubMed

Publication types

MeSH terms