. 2008 Dec;39(6):706-16.
doi: 10.1165/rcmb.2007-0368OC. Epub 2008 Jun 27.

Human herpesvirus-8 infection of primary pulmonary microvascular endothelial cells

Affiliations

Human herpesvirus-8 infection of primary pulmonary microvascular endothelial cells

Todd M Bull et al. Am J Respir Cell Mol Biol. 2008 Dec.

Abstract

Human herpesvirus-8 (HHV-8) is the causative agent of Kaposi's sarcoma and is associated with the angioproliferative disorders primary effusion lymphoma and multicentric Castleman's disease. Evidence of HHV-8 infection within the pulmonary vasculature of patients with idiopathic pulmonary arterial hypertension (IPAH) has been described. We hypothesize that HHV-8 infection of pulmonary microvascular endothelial cells results in an apoptotic-resistant phenotype characteristic of severe pulmonary arterial hypertension. Our objective was to investigate the ability of HHV-8 to infect human pulmonary microvascular endothelial cells in vitro and characterize the phenotypic effect of this infection. Human pulmonary microvascular endothelial cells were exposed to HHV-8 using two methods (direct virus and co-culture technique). The presence of lytic and latent infection was confirmed. Changes in endothelial cell gene and protein expression and effects on cellular apoptosis were measured. HHV-8 can both lytically and latently infect primary human pulmonary microvascular endothelial cells in vitro. HHV-8 infection results in significant changes in gene expression, including alterations of pathways important to cellular apoptosis. HHV-8 infection also alters expression of genes integral to the bone morphogenic protein pathway, including down-regulation of bone morphogenic protein-4. Other genes previously implicated in the development of PAH are affected by HHV-8 infection, and cells infected with HHV-8 are resistant to apoptosis.


Figures

<b>Figure 1.</b>
Figure 1.
Immunofluorescence assay (IFA) for latency-associated nuclear antigen-1 (LANA-1) (green) 72 hours after viral exposure (×100 magnification). The cells were counter stained with Hoechst nuclear stain (blue). (a) Human herpesvirus (HHV)-8–infected cells; note the “punctate” staining characteristic of LANA-1 staining. (b) Mock (treated in identical fashion but without addition of HHV-8)-infected cells are negative for LANA-1 staining.
<b>Figure 2.</b>
Figure 2.
Demonstration of lytic infection of primary human pulmonary microvascular endothelial cells (HMVEC-L) infected with HHV-8. Green staining indicates LANA-1, red staining indicates K8.1 (a marker of lytic replication), and blue is a Hoechst nuclear stain. (a) BCBl-1 cells (reservoir cells for HHV-8) induced to enter lytic infection. These cells serve as a positive control. (b) HMVEC-L 72 hours after exposure to HHV-8. (c) Mock-infected HMVEC-L (negative control) treated in identical fashion as in b, though without exposure to HHV-8.
<b>Figure 3.</b>
Figure 3.
q-PCR assay for markers of viral infection in HHV-8–infected HMVEC-L, mock-infected cells (negative control), and BCBL-1 cells (positive control). The genes assayed by PCR were T1.1, K8.1, LANA-1, ORF-50, and vGPCR. Both HHV-8–infected HMVEC-L and BCBL-1 cells were positive for HHV-8 gene expression indicating infection. Mock-infected cells were negative for PCR evidence of HHV-8 infection.
<b>Figure 4.</b>
Figure 4.
(a) Dendrogram of HHV-8–infected HMVEC-L versus mock (control)-infected cells. Micorarrays were performed at 72 hours after infection. Unsupervised cluster analysis was performed using centered correlation and average linkage. (b) Representative color display of the gene signature distinguishing HHV-8–infected cells from mock-infected cells. Samples (infected versus mock) are along the y-axis and specific gene transcripts are along the x-axis. Red color indicates a relative increase in gene expression, while green indicates a relative decease. HHV-8 infection of HMVEC-L resulted in significant changes in gene expression compared with mock-infected cells. Compete list of the 1,128 gene expression signature altered by HHV-8 infection is included in the online supplement (Table E1).
<b>Figure 5.</b>
Figure 5.
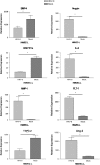
q-PCR analysis of genes selected for confirmation of the microarray results. The gene expression of HMVEC-L infected with HHV-8 via direct virus exposure was compared with that of mock-infected cells (see Materials and Methods). Gene expression was assayed 72 hours after exposure. All infections and controls were performed in triplicate. Error bars represent SEM. As predicted by microarray analysis, there was decreased expression of BMP-4, BMPR1a, TGFB-2 and increased expression of Noggin, IL-6, MMP-1, and FLT-1 in cells infected with HHV-8 as compared with mock-infected cells.*P < 0.05.
<b>Figure 6.</b>
Figure 6.
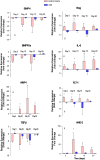
q-PCR of genes in HMVEC-L infected with HHV-8 via co-culture technique compared with cells exposed to conditioned media and untreated cells (media alone). The y-axis represents gene expression fold change compared with untreated cell gene expression. Expression was assayed at four time points: 72 hours, Day 10, Day 15, and Day 20. All samples were run in triplicate. Error bars represent SEM. δ indicates P < 0.05 (two-way ANOVA). *P < 0.05 (post-test infection versus conditioned media).
<b>Figure 7.</b>
Figure 7.
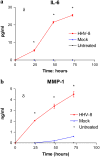
Enzyme-linked immunosorbent assay (ELISA) for (a) IL-6 and (b) MMP-1 in the supernatant of HHV-8–infected HMVEC-L as compared with untreated cells (media) and mock-infected cells. δ indicates P < 0.05 (two-way ANOVA). *P < 0.05 (post-test infection versus untreated).
<b>Figure 8.</b>
Figure 8.
ELISA for (a) BMP4, (b) IL-6, (c) MMP-1, and (d) ANG-2 in supernatant of HMVEC-L infected with HHV-8 via co-culture technique as compared with cells exposed to conditioned media (CM) and untreated cells (media alone). Time points assayed were 72 hours, Day 10, Day 15, and Day 20 after exposure to virus or CM. δ indicates P < 0.05 (two-way ANOVA) *P < 0.05 (post-test infection versus untreated).
<b>Figure 9.</b>
Figure 9.
Measurement of apoptosis by caspase 3/7 assay in HMVEC-L infected with HHV-8 as compared with cells exposed to conditioned media (CM) and untreated cells. The HMVEC-L were infected via co-culture with BCBL-1 cells. The cells were assessed at three time points after infection: (a) Day 10, (b) Day 15, and (c) Day 20. On the day of the selected time point the cells were exposed to camptothecin for 4 hours to induce apoptosis. Caspase 3/7 levels were then measured via luminescence. There were five replicate wells for each condition (n = 5). IFAs were performed to confirm HHV-8 infection of the HMVEC-L cells and lack of infection in the cells exposed to CM. Approximately 10 to 20% of the cells were HHV-8 infected (LANA-1 positive). *P < 0.05.
<b>Figure 10.</b>
Figure 10.
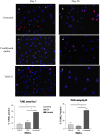
Measurement of apoptosis by TUNEL staining of HMVEC-L infected with HHV-8 as compared with cells exposed to conditioned media (CM) and untreated cells. The HMVEC-L were infected via co-culture with BCBL-1 cells. The cells were assayed at two time points (Day 3 and Day 20) after infection or exposure to CM. At these time points the cells were exposed to camptothecin for 4 hours to induce apoptosis, and then TUNEL staining was performed. The percent of TUNEL-positive cells were quantified by light microscopy and compared between the three groups at each time point. Three separate infections and three controls were performed for each time point. The first row represents untreated cells at (a) Day 3 and (b) Day 20. The second row demonstrates cells exposed to CM at (c) Day 3 and (d) Day 20. The third row demonstrates cells infected with HHV-8 via co-culture at (e) Day 3 and (f) Day 20. Figures are at ×40 magnification. The percent of TUNEL-positive cells are represented graphically below the figures. *P < 0.05.

Similar articles

Cited by

References

    1. Tuder RM, Groves B, Badesch DB, Voelkel NF. Exuberant endothelial cell growth and elements of inflammation are present in plexiform lesions of pulmonary hypertension. Am J Pathol 1994;144:275–285. - PMC - PubMed
    1. Humbert M, Morrell NW, Archer SL, Stenmark KR, MacLean MR, Lang IM, Christman BW, Weir EK, Eickelberg O, Voelkel NF, et al. Cellular and molecular pathobiology of pulmonary arterial hypertension. J Am Coll Cardiol 2004;43:13S–24S. - PubMed
    1. Voelkel NF, Cool C, Lee SD, Wright L, Geraci MW, Tuder RM. Primary pulmonary hypertension between inflammation and cancer. Chest 1998;114:225S–230S. - PubMed
    1. Lane KB, Machado RD, Pauciulo MW, Thomson JR, Phillips JA III, Loyd JE, Nichols WC, Trembath RC. Heterozygous germline mutations in BMPR2, encoding a TGF-beta receptor, cause familial primary pulmonary hypertension. The International PPH Consortium. Nat Genet 2000;26:81–84. - PubMed
    1. Deng Z, Morse JH, Slager SL, Cuervo N, Moore KJ, Venetos G, Kalachikov S, Cayanis E, Fischer SG, Barst RJ, et al. Familial primary pulmonary hypertension (gene PPH1) is caused by mutations in the bone morphogenetic protein receptor-II gene. Am J Hum Genet 2000;67:737–744. - PMC - PubMed

Publication types

MeSH terms