

Inhibition of apoB secretion from HepG2 cells by insulin is amplified by naringenin, independent of the insulin receptor
- PMID: 18587069
- PMCID: PMC2533411
- DOI: 10.1194/jlr.M800297-JLR200
Inhibition of apoB secretion from HepG2 cells by insulin is amplified by naringenin, independent of the insulin receptor
Abstract
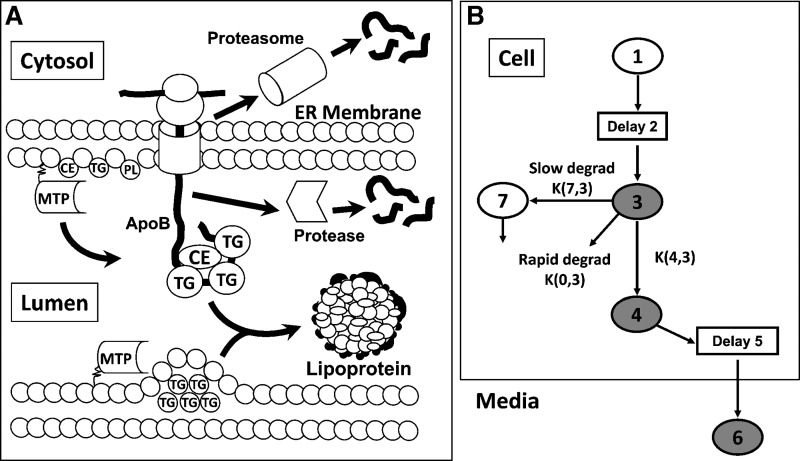
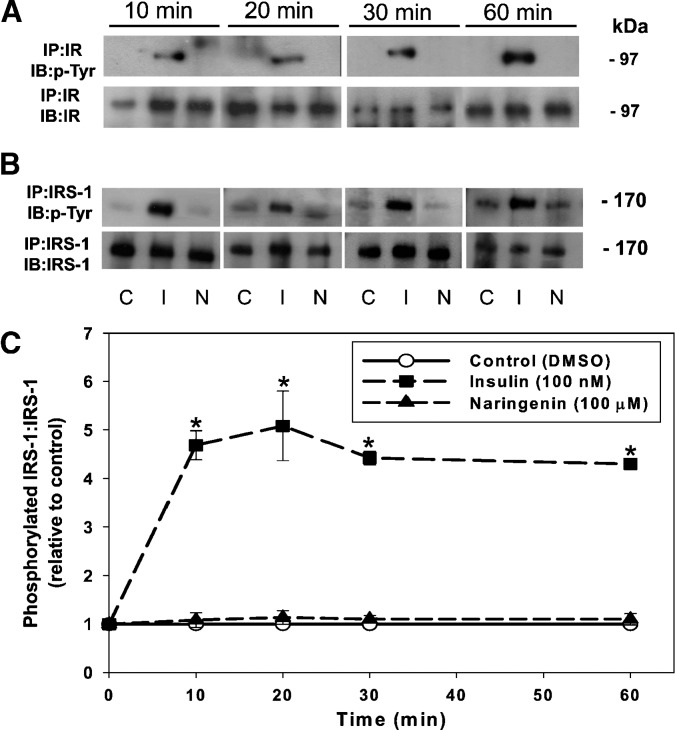
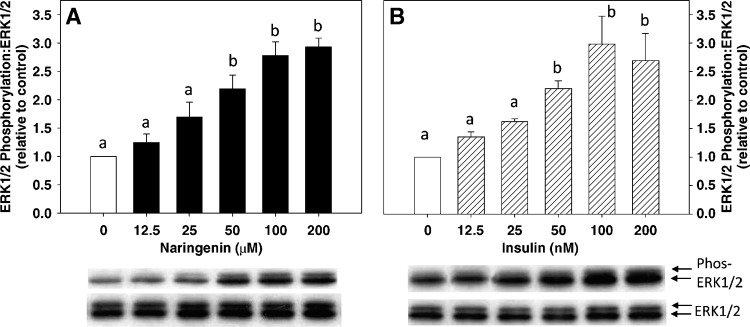
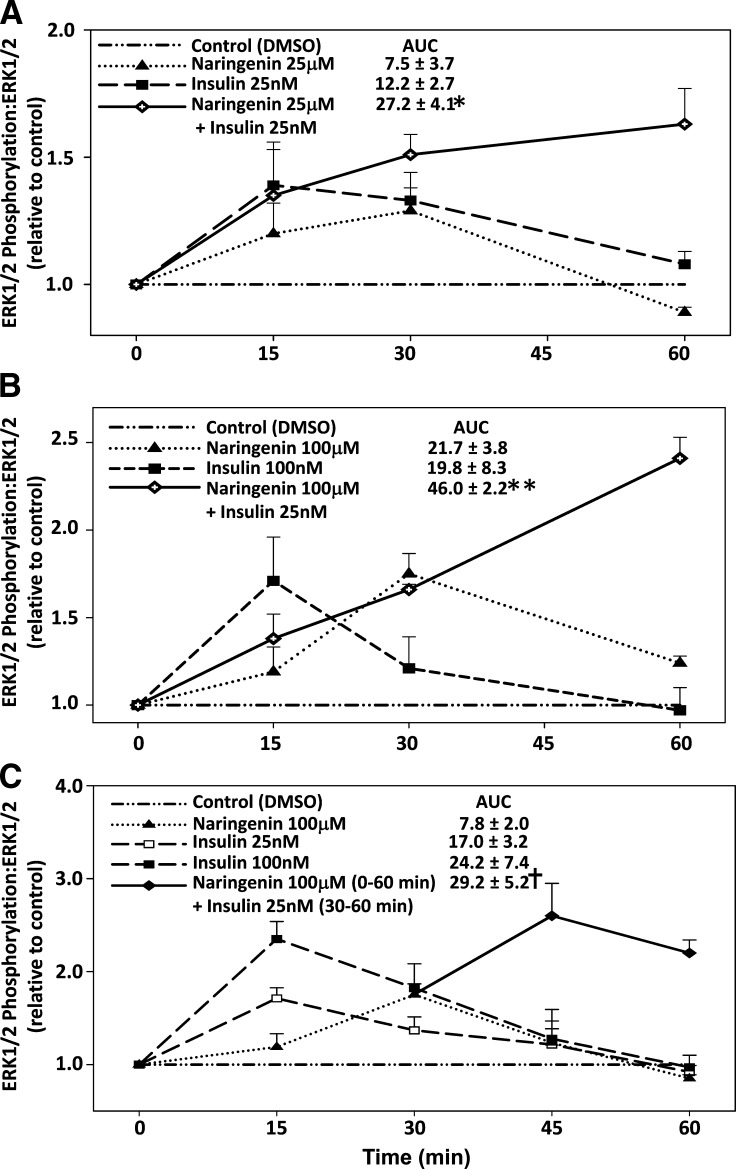
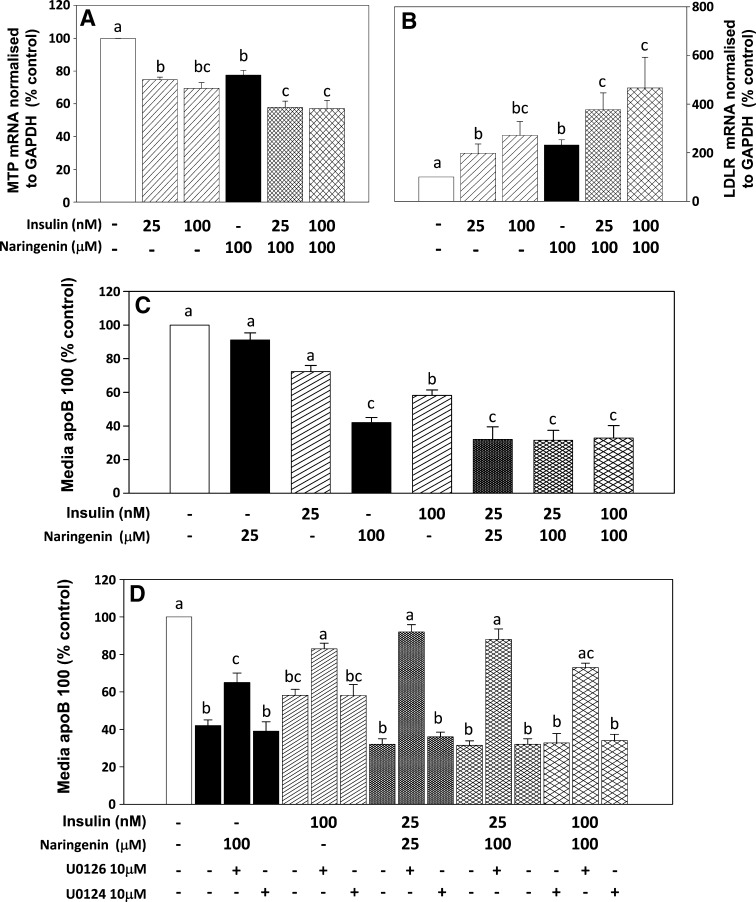
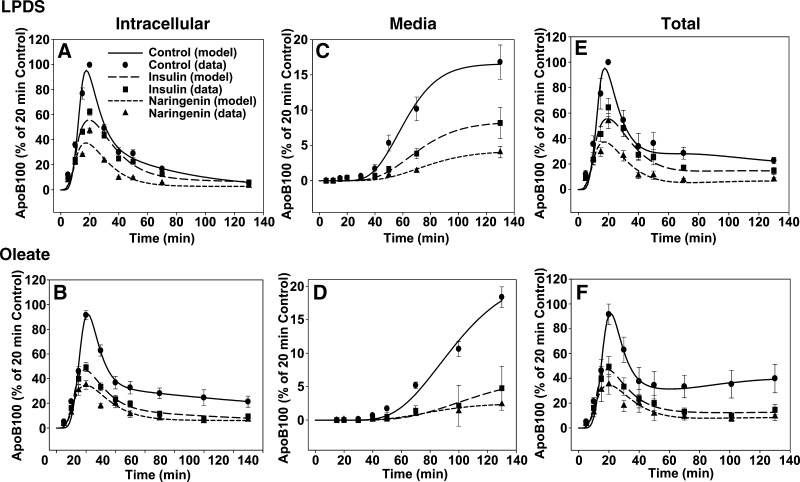
Hepatic overproduction of apolipoprotein B (apoB)-containing lipoproteins is characteristic of the dyslipidemia associated with insulin resistance. Recently, we demonstrated that the flavonoid naringenin, like insulin, decreased apoB secretion from HepG2 cells by activation of both the phosphoinositide-3-kinase (PI3-K) pathway and the mitogen-activated protein kinase/extracellular-regulated kinase (MAPK(erk)) pathway. In the present study, we determined whether naringenin-induced signaling required the insulin receptor (IR) and sensitized the cell to the effects of insulin, and whether the kinetics of apoB assembly and secretion in cells exposed to naringenin were similar to those of insulin. Immunoblot analysis revealed that insulin stimulated maximal phosphorylation of IR and IR substrate-1 after 10 min, whereas naringenin did not affect either at any time point up to 60 min. The combination of naringenin and submaximal concentrations of insulin potentiated extracellular-regulated kinase 1/2 activation and enhanced upregulation of the LDL receptor, downregulation of microsomal triglyceride transfer protein expression, and inhibition of apoB-100 secretion. Multicompartmental modeling of apoB pulse-chase studies revealed that attenuation of secreted radiolabeled apoB in naringenin- or insulin-treated cells was similar under lipoprotein-deficient or oleate-stimulated conditions. Naringenin and insulin both stimulated intracellular apoB degradation via a kinetically defined rapid pathway. Therefore, naringenin, like insulin, inhibits apoB secretion through activation of both PI3-K and MAPK(erk) signaling, resulting in similar kinetics of apoB secretion. However, the mechanism for naringenin-induced signaling is independent of the IR. Naringenin represents a possible strategy for reduction of hepatic apoB secretion, particularly in the setting of insulin resistance.
Figures
Similar articles
-
Inhibition of microsomal triglyceride transfer protein expression and apolipoprotein B100 secretion by the citrus flavonoid naringenin and by insulin involves activation of the mitogen-activated protein kinase pathway in hepatocytes.Diabetes. 2005 Jun;54(6):1676-83. doi: 10.2337/diabetes.54.6.1676. Diabetes. 2005. PMID: 15919788
-
Inhibition of net HepG2 cell apolipoprotein B secretion by the citrus flavonoid naringenin involves activation of phosphatidylinositol 3-kinase, independent of insulin receptor substrate-1 phosphorylation.Diabetes. 2003 Oct;52(10):2554-61. doi: 10.2337/diabetes.52.10.2554. Diabetes. 2003. PMID: 14514640
-
Hepatocyte apoB-containing lipoprotein secretion is decreased by the grapefruit flavonoid, naringenin, via inhibition of MTP-mediated microsomal triglyceride accumulation.Biochemistry. 2003 Feb 11;42(5):1283-91. doi: 10.1021/bi026731o. Biochemistry. 2003. PMID: 12564931
-
Inhibition of hepatocyte apoB secretion by naringenin: enhanced rapid intracellular degradation independent of reduced microsomal cholesteryl esters.J Lipid Res. 2002 Sep;43(9):1544-54. doi: 10.1194/jlr.m200115-jlr200. J Lipid Res. 2002. PMID: 12235187
-
Genetic determinants of apolipoprotein B-100 kinetics.Curr Opin Lipidol. 2010 Apr;21(2):141-7. doi: 10.1097/MOL.0b013e3283378e5a. Curr Opin Lipidol. 2010. PMID: 20154610 Review.
Cited by
-
Flavonoids from Aurantii Fructus Immaturus and Aurantii Fructus: promising phytomedicines for the treatment of liver diseases.Chin Med. 2020 Aug 26;15:89. doi: 10.1186/s13020-020-00371-5. eCollection 2020. Chin Med. 2020. PMID: 32863858 Free PMC article. Review.
-
Naringenin prevents dyslipidemia, apolipoprotein B overproduction, and hyperinsulinemia in LDL receptor-null mice with diet-induced insulin resistance.Diabetes. 2009 Oct;58(10):2198-210. doi: 10.2337/db09-0634. Epub 2009 Jul 10. Diabetes. 2009. PMID: 19592617 Free PMC article.
-
Global view of the RAF-MEK-ERK module and its immediate downstream effectors.Sci Rep. 2019 Jul 26;9(1):10865. doi: 10.1038/s41598-019-47245-x. Sci Rep. 2019. PMID: 31350469 Free PMC article.
-
Chromatic symphony of fleshy fruits: functions, biosynthesis and metabolic engineering of bioactive compounds.Mol Hortic. 2025 Apr 2;5(1):19. doi: 10.1186/s43897-024-00142-y. Mol Hortic. 2025. PMID: 40170175 Free PMC article. Review.
-
Enhancement of naringenin bioavailability by complexation with hydroxypropyl-β-cyclodextrin. [corrected].PLoS One. 2011 Apr 6;6(4):e18033. doi: 10.1371/journal.pone.0018033. PLoS One. 2011. PMID: 21494673 Free PMC article.
References
-
- Allister E. M., N. M. Borradaile, J. Y. Edwards, and M. W. Huff. 2005. Inhibition of microsomal triglyceride transfer protein expression and apolipoprotein B100 secretion by the citrus flavonoid naringenin and by insulin involves activation of the mitogen-activated protein kinase pathway in hepatocytes. Diabetes. 54 1676–1683. - PubMed
-
- Borradaile N. M., L. E. de Dreu, and M. W. Huff. 2003. Inhibition of net HepG2 cell apolipoprotein B secretion by the citrus flavonoid naringenin involves activation of phosphatidylinositol 3-kinase, independent of insulin receptor substrate-1 phosphorylation. Diabetes. 52 2554–2561. - PubMed
-
- Fisher E. A., M. Pan, X. Chen, X. Wu, H. Wang, H. Jamil, J. D. Sparks, and K. J. Williams. 2001. The triple threat to nascent apolipoprotein B. Evidence for multiple, distinct degradative pathways. J. Biol. Chem. 276 27855–27863. - PubMed
-
- Phung T. L., A. Roncone, K. L. Jensen, C. E. Sparks, and J. D. Sparks. 1997. Phosphoinositide 3-kinase activity is necessary for insulin-dependent inhibition of apolipoprotein B secretion by rat hepatocytes and localizes to the endoplasmic reticulum. J. Biol. Chem. 272 30693–30702. - PubMed
-
- Sun X. J., M. Miralpeix, M. G. J. Myers, E. M. Glasheen, J. M. Backer, C. R. Kahn, and M. F. White. 1992. Expression and function of IRS-1 in insulin signal transmission. J. Biol. Chem. 267 22662–22672. - PubMed
Publication types
MeSH terms
Substances
Grants and funding
LinkOut - more resources
Full Text Sources
Medical
Miscellaneous
