

Review
doi: 10.2967/jnumed.107.050203.
Routine quality control of clinical nuclear medicine instrumentation: a brief review
Affiliations
- PMID: 18587088
- PMCID: PMC2703015
- DOI: 10.2967/jnumed.107.050203
Item in Clipboard
Review
Routine quality control of clinical nuclear medicine instrumentation: a brief review
J Nucl Med.
2008 Jul.
Abstract
This article reviews routine quality-control (QC) procedures for current nuclear medicine instrumentation, including the survey meter, dose calibrator, well counter, intraoperative probe, organ ("thyroid") uptake probe, gamma-camera, SPECT and SPECT/CT scanner, and PET and PET/CT scanner. It should be particularly useful for residents, fellows, and other trainees in nuclear medicine, nuclear cardiology, and radiology. The procedures described and their respective frequencies are presented only as general guidelines.
Conflict of interest statement
No potential conflict of interest relevant to this article was reported.
Figures

Set of lead-lined plastic sleeves (CalicheckDose Calibrator Linearity Test Kit; Fluke Biomedical) for evaluation of dose-calibrator linearity by shield method. Set is supplied with 0.64-cm-thick lead base, color-coded unlined sleeve (to provide activity measurement equivalent to 0 time point measurement of decay method), and 6 color-coded lead-lined sleeves providing attenuation factors nominally equivalent to decay over 6, 12, 20, 30, 40, and 50 h, respectively, for 99mTc.

γ-Camera uniformity may be evaluated either intrinsically or extrinsically. Intrinsically, point source is placed at least 3, and preferably 5, crystal dimensions from and centered over un-collimated detector to provide uniform photon flux (left). Extrinsically, uniform flood, or sheet, source of 57Co is placed directly on collimated detector (right).

Sources of γ-camera nonuniformity. (A) Mistuning (or detuning), meaning that photopeak of radionuclide does not coincide with photopeak energy window of camera, perhaps because energy window (as shown) or high voltages of PMTs are not set correctly. (B) Uncoupling of PMT from crystal, resulting in loss of all or part of light signal in resulting air gap between PMT entrance window and crystal. (Courtesy of Dr. Barbara Binkert, New York Presbyterian Hospital, New York, NY.) (C) Cracked crystal, either because of mechanical trauma (impact) or temperature excursion (i.e., temperature increase or decrease at rate faster than ~5°C per hour, causing crystal to expand or contract, respectively, to point of cracking). Note that it is rate of temperature change that is critical. Photographs on right show cracked crystal that produced corresponding image. Even though cracks are grossly imperceptible, artifacts produced are dramatic. (Courtesy of Dr. Barbara Binkert, New York Presbyterian Hospital, New York, NY.) (D) Corrupted, deleted, or switched-off software correction tables. Even perfectly functioning γ-cameras have some nonuniformity due to point-to-point variations in energy spectra, greater sensitivity at and lower sensitivity between PMTs, and residual nonuniformity due to ill-defined factors such as variations in crystal thickness. Associated nonuniformities are measured and used to create energy, linearity, and uniformity (or sensitivity) correction tables. Note that linearity correction table has biggest effect on uniformity: if corrupted, deleted, or switched off, PMT pattern becomes grossly apparent, and IU approaches 20%. Fortunately, in contrast to uniformity correction table and, to lesser extent, energy correction table, linearity correction table rarely needs to be updated once γ-camera is installed; if updating becomes necessary, it is almost always done by field-service personnel of manufacturer, not by end-user.
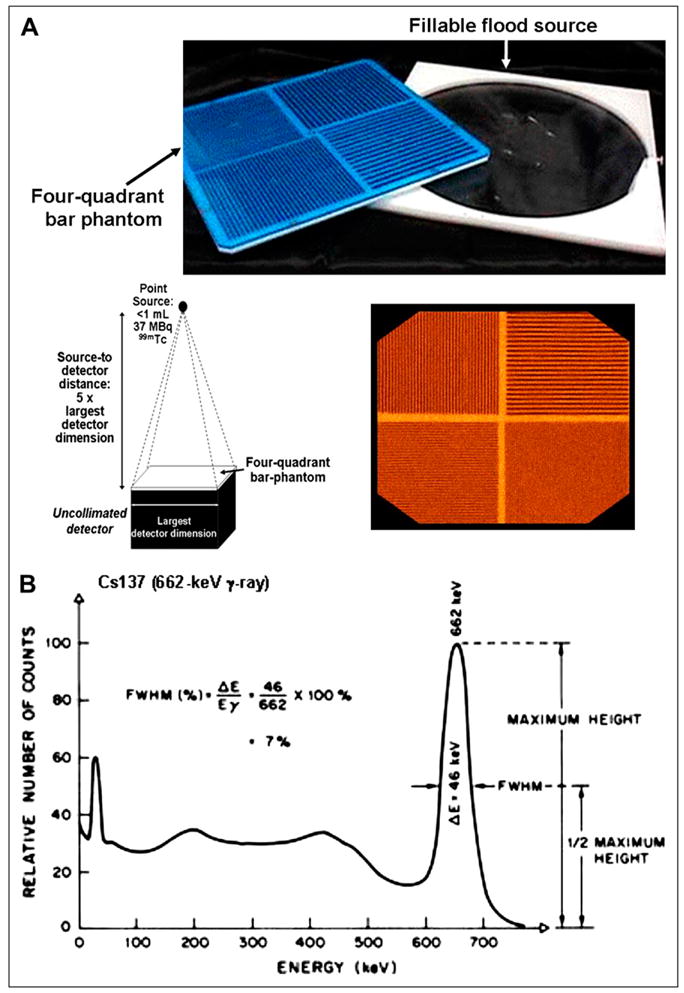
(A) Photograph and γ-camera image of 4-quadrant bar phantom, with schematic diagram illustrating setup for assessment of spatial resolution using such phantom. (Though seldom used in practice, sheet source that may be filled with different radionuclides and used to evaluate extrinsic uniformity is also shown in photograph.) (B) Energy spectrum for 662-keV γ-ray emitted by 137Cs, illustrating definition of energy resolution as percentage FWHM of photopeak energy, Eγ.

(A) COR misalignment and resulting image-blurring artifacts in rotating-γ-camera SPECT. Degree of blurring is related to magnitude of spatial misalignment of mechanical and electronic CORs. Misalignment as small as 3.2 mm (or 0.5 pixel for 64 × 64 image matrix) can produce perceptible blurring in SPECT images, with blurring substantially worse for misalignment of 6.4 mm (1 pixel). (Adapted from reference (29) with permission.) Note that for cross-sectional image of line source, COR misalignment blurs expected point into full or partial circle depending on position of source in FOV: if it is at or near center of FOV, line source appears as full circle in cross-section; if it is near periphery of FOV, it appears as partial circle. (B) COR misalignment can be measured and corrected on basis of acquiring 360° circular SPECT study of 99mTc point source and constructing graphs of x- and y-positions (perpendicular and parallel to axis of rotation, respectively) of position of maximum-count pixel in each projection image vs. angular position. x- and y-position vs. angle graphs should be sinusoidal curve and straight line, respectively. Angle-by-angle deviation between x-position on best-fit sine curve and x-position of actual maximum-count pixel thus yields correction table, indicating offset by which each projection image must be shifted at each angular position to align CORs. Alternatively, average of offsets may used at each angular position. (Adapted from reference (15) with permission.)

(A) Severe ring, or bull’s-eye, artifact in transverse SPECT image through 20-cm diameter 99mTc-filled cylinder phantom resulting from gross γ-camera nonuniformity (i.e., IU ≈ 10%). (B) Appearance of such artifact (arrow) in clinical SPECT image, transverse image from 99mTc-sulfur colloid liver–spleen study. (C) In contrast to A, this is acceptable transverse SPECT image through 99mTc-filled cylinder phantom. No perceptible ring, or bull’s-eye, artifact is demonstrated; IU at time of this acquisition, ~2%, was well within tolerance. In cylinder phantom images, A and B, analytic postprocessing attenuation correction was applied.

Photographs of disassembled (end view) (A) and assembled (side view) (B) phantom (Deluxe Jaszczak Phantom; Data Spectrum Corp.), used for evaluation of overall performance of tomographic imaging systems. This fillable acrylic phantom is 22 cm in diameter by 19 cm in length and includes plain section for evaluation of tomographic uniformity (C), section containing empty (cold) spheres ranging from 9.5 to 31.8 mm in diameter for evaluation of cold-sphere contrast (D), and section containing solid (cold) rods ranging from 3.2 to 11.1 mm in diameter for evaluation of reconstructed spatial resolution (E). Images in C–E have been analytically corrected for attenuation. (Courtesy of Data Spectrum Corp.)

(A) Sinogram (i.e., histogram) presentation of emission tomography (i.e., SPECT or PET) data. (B–D) PET sinograms of uniform-cylinder source without any visually perceptible discontinuities or other artifacts (B), with blank diagonal line indicative of faulty detector (crystal) element (C), and blank diagonal band indicative of faulty detector block (D).

Two-dimensional PET sino-grams and reconstructed transverse images through hot-sphere 18F-filled phantom: sinogram without any perceptible artifacts (A) and corresponding transverse image (B); sinogram with blank diagonal band, suggestive of faulty detector block (C) and corresponding transverse image (D). Despite obvious defect in sinogram C, reconstructed images B and D are virtually indistinguishable. (Courtesy of Dr. Osama Mawlawi, M.D. Anderson Cancer Center, Houston, TX.)
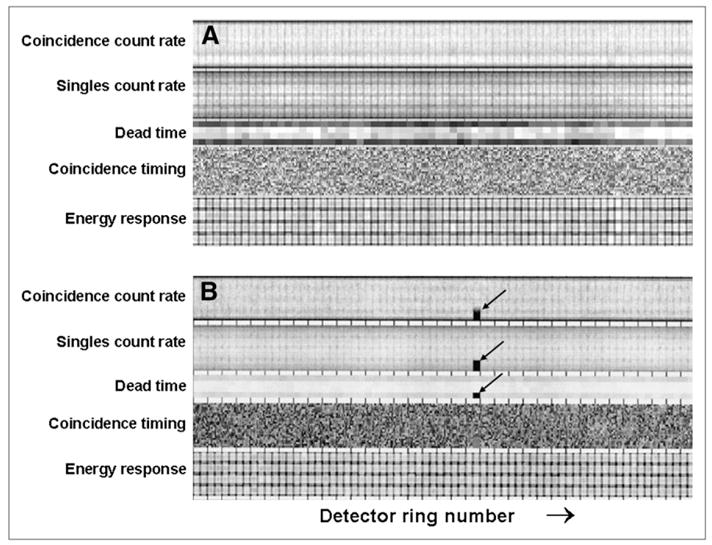
Proprietary graphical display (GE Healthcare), detector block–by–detector block, of relative values of PET scanner operational parameters derived from blank scan, including coincidence counting rate, singles counting rate, detector dead time, coincidence timing window, and energy setting. Such display allows operator to quickly and easily discern out-of-tolerance results, displayed with grossly different (i.e., lower) intensity than within-tolerance results. (A) Display for acceptable blank scan; that is, blank scan for which all detector parameters are within tolerance. (B) Display for blank scan in which coincidence counting rate, singles counting rate, and dead-time results for 1 block detector are out of tolerance, indicated by black areas (arrows) in respective displays. (Courtesy of Dr. Osama Mawlawi, M.D. Anderson Cancer Center, Houston, TX.)

Reconstructed coronal images of 68Ge uniform-cylinder phantom without (A) and with (B) normalization applied. (A) Unnormalized (i.e., uncorrected) image has obvious artifacts attributable to differences in sensitivities between direct and cross planes and presence of separate rings of block detectors. (B) Appropriate normalization virtually eliminates these and other artifacts related to nonuniformity of scanner response.

Cross-sectional diagrams of GE quality assurance phantom (24) illustrating respective sections (inserts) for evaluation of laser-light alignment, image slice thickness, spatial resolution, linearity, and high-contrast contrast resolution (A); low-contrast uniformity (B); and image uniformity and noise (C). Various short black lines in acrylic insert in section shown in A are cavities that fill with water when phantom is filled, providing high contrast between cavities and acrylic; portion of this section outside this insert, although not shown in black, is also water-filled. Diagonally arranged sets of line cavities ranges are 1.6 (lower left), 1.3, 1.0, 0.8, 0.6, and 0.5 (upper right) mm in line width and are used to evaluate spatial resolution. Section shown in B includes polystyrene membrane with series of holes (10, 7.5, 5, 3, and 1 mm in diameter) that also fill with water when phantom is filled, providing low contrast between holes and polystyrene. (D) Side-view diagram (not to scale) of section of phantom in A, showing only 1 of slice-thickness measurement components of insert; these line cavities are air-, not water-, filled. They are staggered (offset) 1 mm apart in longitudinal direction. Also shown in D, as well as in A, is laser-alignment groove around circumference of phantom and 2 corresponding laser-alignment cavities. Boxes indicate pertinent ROIs for different analyses. (See text for details.)

Setup for measurement of CT radiation exposures using ionization chamber and 32-cm-diameter acrylic torso (body) phantom. (Courtesy of Dr. Sadek Nehmeh, Memorial Sloan-Kettering Cancer Center, New York, NY.)

Phantoms adaptable to evaluation of accuracy of multimodality image registration. (A) Uniform phantom with 2 channels for line sources. (Courtesy of Dr. Sadek Nehmeh, Memorial Sloan-Kettering Cancer Center, New York, NY.) (B) Phantom (NEMA IEC Body Phantom; Data Spectrum Corp.) with multiple fillable spheres and cylindric insert that can be filled with polystyrene to provide minimally attenuating material, simulating lung in otherwise uniform water-filled volume.
Similar articles
-
Advances in imaging instrumentation for nuclear cardiology.J Nucl Cardiol. 2019 Apr;26(2):543-556. doi: 10.1007/s12350-017-0979-8. Epub 2017 Jul 17. J Nucl Cardiol. 2019. PMID: 28718074 Review.
-
New instrumentation for cardiovascular nuclear medicine.J Nucl Med. 1994 Apr;35(4):20N-22N. J Nucl Med. 1994. PMID: 8151370 No abstract available.
-
Proceedings of the cardiac PET summit meeting 12 may 2014: Cardiac PET and SPECT instrumentation.J Nucl Cardiol. 2015 Jun;22(3):563-70. doi: 10.1007/s12350-015-0114-7. Epub 2015 Apr 1. J Nucl Cardiol. 2015. PMID: 25824018 Review.
-
Development of NEMA-based software for gamma camera quality control.J Digit Imaging. 2008 Jun;21(2):243-55. doi: 10.1007/s10278-007-9030-y. Epub 2007 Mar 28. J Digit Imaging. 2008. PMID: 17393254 Free PMC article.
-
National Electrical Manufacturers Association recommendations for implementing SPECT instrumentation quality control.J Nucl Med Technol. 1999 Mar;27(1):67-72. J Nucl Med Technol. 1999. PMID: 10322582 No abstract available.
Cited by
-
"Picture-in-Picture" Artifact: Introduction and Characterization of a Hitherto Unrecognized Imaging Artifact in Creating Perfusion Defects in Myocardial Perfusion Single-Photon Emission Computed Tomography.Indian J Nucl Med. 2021 Jan-Mar;36(1):69-72. doi: 10.4103/ijnm.IJNM_55_20. Epub 2021 Mar 4. Indian J Nucl Med. 2021. PMID: 34040303 Free PMC article.
-
Proof-of-Concept Study of the NOTI Chelating Platform: Preclinical Evaluation of 64Cu-Labeled Mono- and Trimeric c(RGDfK) Conjugates.Mol Imaging Biol. 2021 Feb;23(1):95-108. doi: 10.1007/s11307-020-01530-8. Epub 2020 Aug 27. Mol Imaging Biol. 2021. PMID: 32856224 Free PMC article.
-
Human Biodistribution and Radiation Dosimetry of 18F-Clofarabine, a PET Probe Targeting the Deoxyribonucleoside Salvage Pathway.J Nucl Med. 2017 Mar;58(3):374-378. doi: 10.2967/jnumed.116.182394. Epub 2016 Nov 3. J Nucl Med. 2017. PMID: 27811125 Free PMC article.
-
Modular strategy for the construction of radiometalated antibodies for positron emission tomography based on inverse electron demand Diels-Alder click chemistry.Bioconjug Chem. 2011 Oct 19;22(10):2048-59. doi: 10.1021/bc200288d. Epub 2011 Sep 20. Bioconjug Chem. 2011. PMID: 21877749 Free PMC article.
-
Light-Induced Radiosynthesis of 89Zr-DFO-Azepin-Onartuzumab for Imaging the Hepatocyte Growth Factor Receptor.J Nucl Med. 2020 Jul;61(7):1072-1078. doi: 10.2967/jnumed.119.237180. Epub 2020 Jan 10. J Nucl Med. 2020. PMID: 31924725 Free PMC article.
References
-
- Lin PJP, Beck TJ, Borras C, et al. Specification and Acceptance Testing of Computed Tomography Scanners. New York, NY: American Association of Physicists in Medicine; 1993.
-
- Shepard SJ, Lin PJP, Boone JM, et al. Quality Control in Diagnostic Radiology. College Park, MD: American Association of Physicists in Medicine; 2002.
-
- National Electrical Manufacturers Association (NEMA) Performance Measurements of Scintillation Cameras. Rosslyn, VA: NEMA; 2001.
-
- National Electrical Manufacturers Association (NEMA) Performance Measurements of Positron Emission Tomographs. Rosslyn, VA: NEMA; 2001.
-
- Horton PW, Leach KG, Griffiths JT, et al. The Theory, Specification, and Testing of Anger Type Gamma Cameras. London, U.K.: Hospital Physicists’ Association; 1978.
Publication types
MeSH terms
Grants and funding
LinkOut - more resources
Full Text Sources
Other Literature Sources