

Electrostatic readout of DNA microarrays with charged microspheres
- PMID: 18587384
- PMCID: PMC4007654
- DOI: 10.1038/nbt1416
Electrostatic readout of DNA microarrays with charged microspheres
Abstract
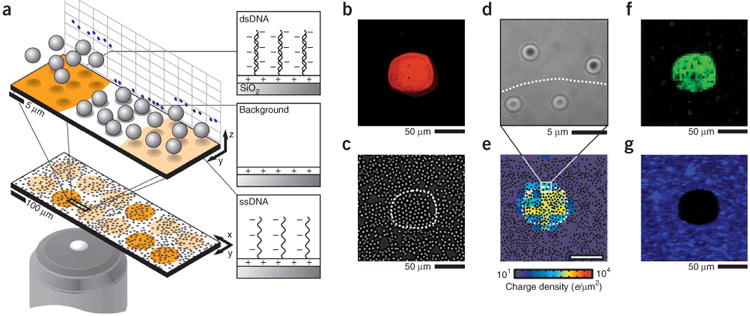
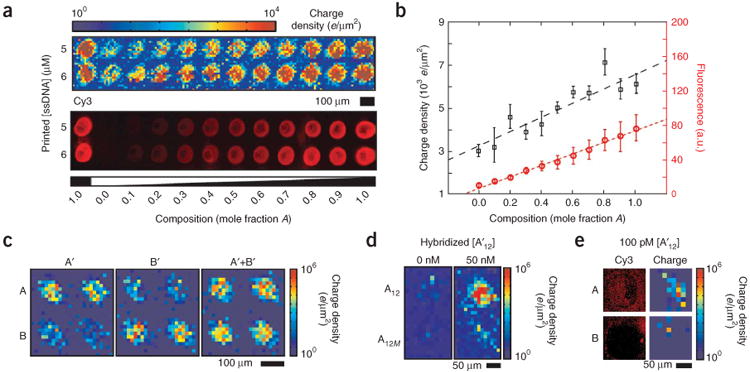
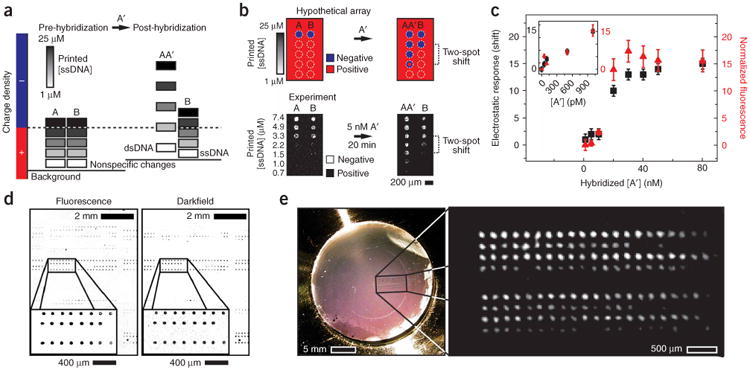
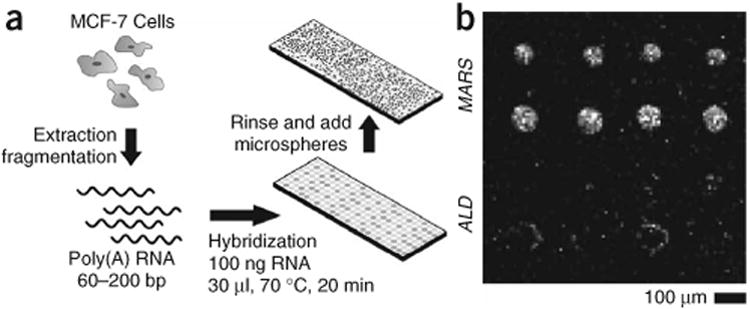
DNA microarrays are used for gene-expression profiling, single-nucleotide polymorphism detection and disease diagnosis. A persistent challenge in this area is the lack of microarray screening technology suitable for integration into routine clinical care. Here, we describe a method for sensitive and label-free electrostatic readout of DNA or RNA hybridization on microarrays. The electrostatic properties of the microarray are measured from the position and motion of charged microspheres randomly dispersed over the surface. We demonstrate nondestructive electrostatic imaging with 10-mum lateral resolution over centimeter-length scales, which is four-orders of magnitude larger than that achievable with conventional scanning electrostatic force microscopy. Changes in surface charge density as a result of specific hybridization can be detected and quantified with 50-pM sensitivity, single base-pair mismatch selectivity and in the presence of complex background. Because the naked eye is sufficient to read out hybridization, this approach may facilitate broad application of multiplexed assays.
Figures
Similar articles
-
Surface electrostatic effects in oligonucleotide microarrays: control and optimization of binding thermodynamics.Biopolymers. 2003 Feb;68(2):265-70. doi: 10.1002/bip.10271. Biopolymers. 2003. PMID: 12548628
-
LabArray: real-time imaging and analytical tool for microarrays.Bioinformatics. 2005 Mar 1;21(5):689-90. doi: 10.1093/bioinformatics/bti088. Epub 2004 Oct 27. Bioinformatics. 2005. PMID: 15509598
-
Multiplexed, targeted gene expression profiling and genetic analysis on electronic microarrays.Clin Chem. 2002 Nov;48(11):1873-82. Clin Chem. 2002. PMID: 12406971
-
Spot detection and image segmentation in DNA microarray data.Appl Bioinformatics. 2005;4(1):1-11. doi: 10.2165/00822942-200504010-00001. Appl Bioinformatics. 2005. PMID: 16000008 Review.
-
[Microarrays: technologies overview and data analysis].Ukr Biokhim Zh (1999). 2004 Mar-Apr;76(2):5-19. Ukr Biokhim Zh (1999). 2004. PMID: 15915706 Review. Ukrainian.
Cited by
-
Engineering supported membranes for cell biology.Med Biol Eng Comput. 2010 Oct;48(10):955-63. doi: 10.1007/s11517-010-0634-x. Epub 2010 Jun 18. Med Biol Eng Comput. 2010. PMID: 20559751 Free PMC article. Review.
-
Integrin-generated forces lead to streptavidin-biotin unbinding in cellular adhesions.Biophys J. 2014 Apr 1;106(7):1436-46. doi: 10.1016/j.bpj.2014.01.049. Biophys J. 2014. PMID: 24703305 Free PMC article.
-
Surface Potential/Charge Sensing Techniques and Applications.Sensors (Basel). 2020 Mar 18;20(6):1690. doi: 10.3390/s20061690. Sensors (Basel). 2020. PMID: 32197397 Free PMC article. Review.
-
DNA-programming multicolor silver nanoclusters for sensitively simultaneous detection of two HIV DNAs.Sens Actuators B Chem. 2019 Oct 1;296:126608. doi: 10.1016/j.snb.2019.05.085. Epub 2019 May 30. Sens Actuators B Chem. 2019. PMID: 32288255 Free PMC article.
-
Encoding microcarriers for biomedicine.Smart Med. 2023 Feb 14;2(1):e20220009. doi: 10.1002/SMMD.20220009. eCollection 2023 Feb. Smart Med. 2023. PMID: 39188559 Free PMC article. Review.
References
-
- Barken K, Haagensen JJ, Tolker-Nielsen T. Advances in nucleic acid-based diagnostics of bacterial infections. Clin Chim Acta. 2007;384:1–11. - PubMed
-
- Abdullah-Sayani A, Bueno-de-Mesquita JM, van de Vijver Marc J. Technology insight: tuning into the genetic orchestra using microarrays—limitations of DNA microarrays in clinical practice. Nat Clin Pract Oncol. 2006;3:501–516. - PubMed
Publication types
MeSH terms
Grants and funding
LinkOut - more resources
Full Text Sources
Other Literature Sources
