

Meta-Analysis
doi: 10.1038/ng.175.
Epub 2008 Jun 29.
Genome-wide association defines more than 30 distinct susceptibility loci for Crohn's disease
Affiliations
- PMID: 18587394
- PMCID: PMC2574810
- DOI: 10.1038/ng.175
Item in Clipboard
Meta-Analysis
Genome-wide association defines more than 30 distinct susceptibility loci for Crohn's disease
Nat Genet.
2008 Aug.
Abstract
Several risk factors for Crohn's disease have been identified in recent genome-wide association studies. To advance gene discovery further, we combined data from three studies on Crohn's disease (a total of 3,230 cases and 4,829 controls) and carried out replication in 3,664 independent cases with a mixture of population-based and family-based controls. The results strongly confirm 11 previously reported loci and provide genome-wide significant evidence for 21 additional loci, including the regions containing STAT3, JAK2, ICOSLG, CDKAL1 and ITLN1. The expanded molecular understanding of the basis of this disease offers promise for informed therapeutic development.
Figures
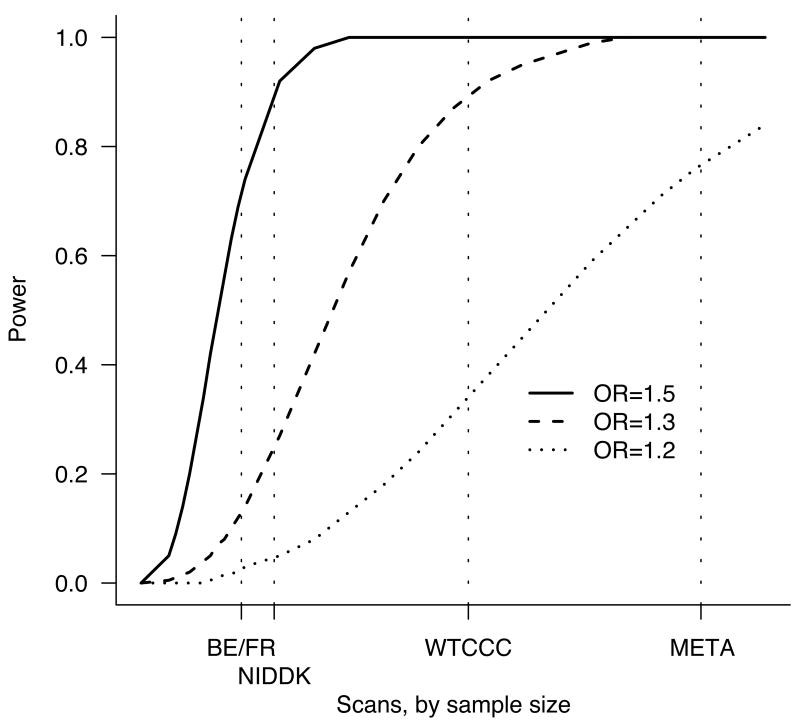
Power to detect a genetic effect of various sizes (odds ratio 1.2, 1.3, 1.5) versus study sample size. Power is reported here as the probability (given a multiplicative model and risk allele frequency of 20%) of p < 5×10⁻⁵ in a scan – the value used to define regions for attempting replication in a larger sample set. Vertical dotted lines show the sample sizes for the three constituent scans and the meta-analysis. Relatively large effects are likely to be detected by any of these scans, whereas only the combined analysis is well powered to detect more modest effects.
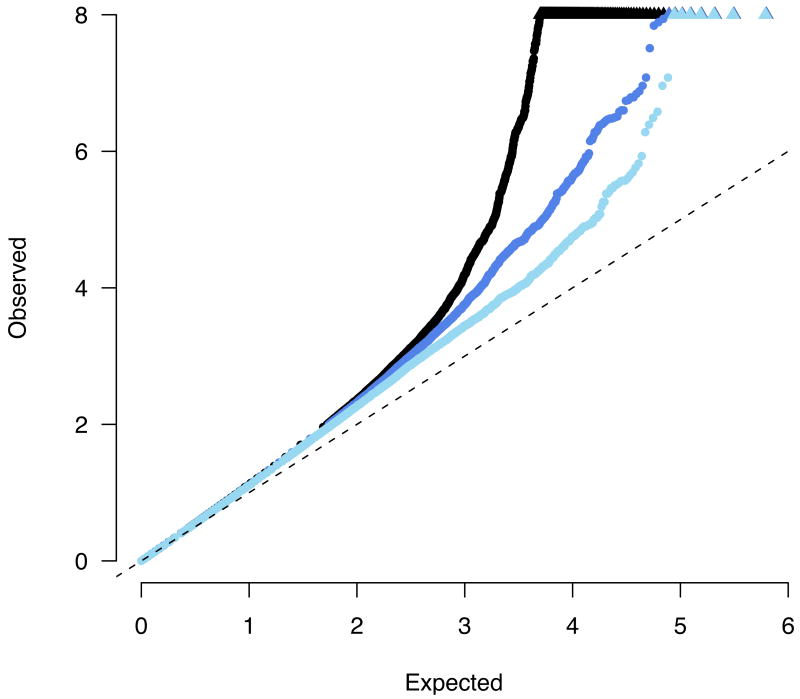
A quantile-quantile plot of observed -log10 p values versus the expectation under the null. Black points represent the complete meta-analysis, with a substantial departure from the null at the tail (values > 8 are represented along the top of the plot as triangles). Dark blue points show the distribution after removing 11 previously published loci, demonstrating a still notable excess. Light blue points show the distribution after removing all 40 loci which replicate at least nominally. In all the cases the overall distribution is marginally inflated (λGC < 1.16).
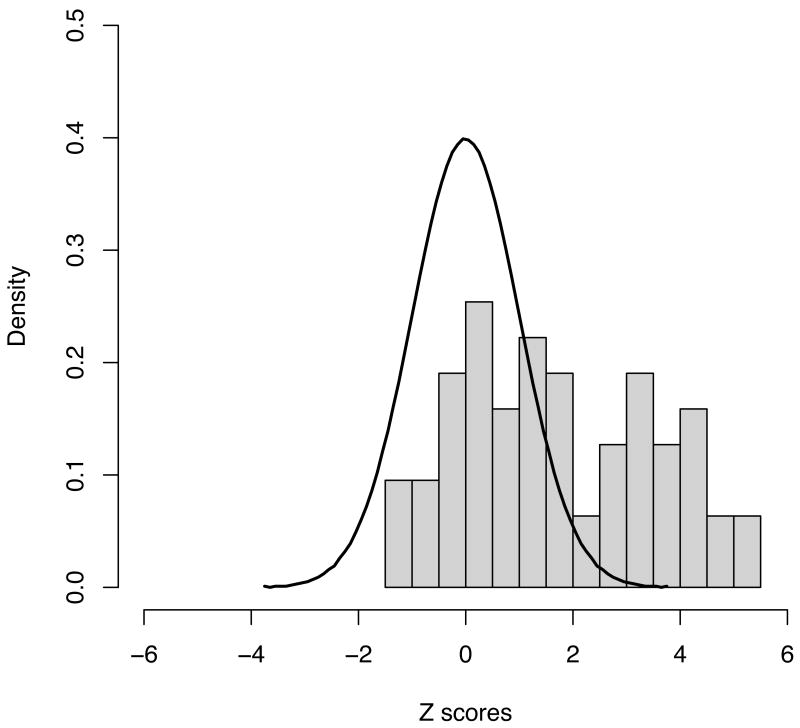
Distribution of observed Z scores from the 63 novel regions explored, along with the expected distribution under the null (a standard normal with mean 0 and variance 1). Even setting aside the 21 regions reaching genome-wide significance, the distribution is highly skewed – 4 more results exceed a Z of 2 (1 would be expected by chance under the null) whilst none showed a Z of less than -2 (same expectation under the null) suggesting that even more of the regions investigated here are likely to constitute true positive associations when additional data become available.
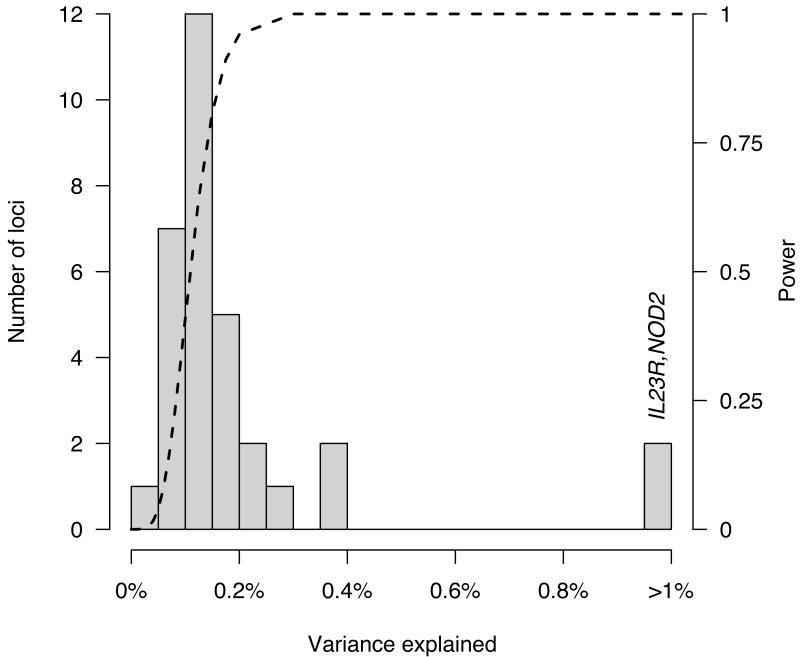
Histogram of percent variance explained by each of the 32 established CD risk loci. The distribution resembles the long postulated exponential distribution of effect sizes. Dashed line shows the joint power for our meta-analysis to detect (p < 5×10⁻⁵), and for our replication sample to replicate (at Bonferroni corrected p values), a 20% variant explaining a given fraction of variance. Note how quickly this curve moves from nearly zero power to detect tiny effects (less than one tenth of one percent) to nearly full power to detect larger effects (presuming they are well covered by the current generation of GWAS chips). Complete power near the origin would likely reveal a more complete exponential distribution, with many very small effects. These are likely to increase somewhat once the causal variant or variants are identified in each locus. Indeed, NOD2 and IL23R are distant outliers, each explaining 1-2% of total variance, partially because multiple causal variants have already been discovered at these loci,.
Comment in
-
Digging out Crohn's disease genes.Inflamm Bowel Dis. 2009 Sep;15(9):1436-7. doi: 10.1002/ibd.20889. Inflamm Bowel Dis. 2009. PMID: 19235911 No abstract available.
-
The genetic universe of inflammatory bowel disease.Gastroenterology. 2009 Jun;136(7):2402-3. doi: 10.1053/j.gastro.2009.04.051. Epub 2009 May 5. Gastroenterology. 2009. PMID: 19422783 No abstract available.
References
-
- Mathew CG. New links to the pathogenesis of Crohn disease provided by genome-wide association scans. Nat Rev Genet. 2008;9:9–14. - PubMed
-
- Hampe J, et al. A genome-wide association scan of nonsynonymous SNPs identifies a susceptibility variant for Crohn disease in ATG16L1. Nat Genet. 2007;39:207–11. - PubMed
Publication types
MeSH terms
Grants and funding
- P30 DK040561/DK/NIDDK NIH HHS/United States
- DK62413/DK/NIDDK NIH HHS/United States
- U01 DK062413/DK/NIDDK NIH HHS/United States
- DK064869/DK/NIDDK NIH HHS/United States
- DK62431/DK/NIDDK NIH HHS/United States
- U01 DK062432/DK/NIDDK NIH HHS/United States
- R01 DK064869/DK/NIDDK NIH HHS/United States
- U01 DK062429/DK/NIDDK NIH HHS/United States
- P30 DK063491/DK/NIDDK NIH HHS/United States
- U01 DK062422/DK/NIDDK NIH HHS/United States
- G0800759/MRC_/Medical Research Council/United Kingdom
- CZB/4/540/CSO_/Chief Scientist Office/United Kingdom
- DK62432/DK/NIDDK NIH HHS/United States
- DK62423/DK/NIDDK NIH HHS/United States
- G0600329/MRC_/Medical Research Council/United Kingdom
- U24 DK062429/DK/NIDDK NIH HHS/United States
- 068545/Z/02/WT_/Wellcome Trust/United Kingdom
- DK62429/DK/NIDDK NIH HHS/United States
- DK62420/DK/NIDDK NIH HHS/United States
- DK62422/DK/NIDDK NIH HHS/United States
- AI06277/AI/NIAID NIH HHS/United States
- R01 AI062773/AI/NIAID NIH HHS/United States
- G0000934/MRC_/Medical Research Council/United Kingdom
- WT_/Wellcome Trust/United Kingdom
- U01 DK062423/DK/NIDDK NIH HHS/United States
- U01 DK062420/DK/NIDDK NIH HHS/United States
- U01 DK062431/DK/NIDDK NIH HHS/United States
LinkOut - more resources
Full Text Sources
Other Literature Sources
Medical
Molecular Biology Databases
Research Materials
Miscellaneous
