. 2008 Aug;40(8):999-1003.
doi: 10.1038/ng.166. Epub 2008 Jun 29.

Gain-of-function mutations in TRPV4 cause autosomal dominant brachyolmia

Affiliations

Gain-of-function mutations in TRPV4 cause autosomal dominant brachyolmia

Matthew J Rock et al. Nat Genet. 2008 Aug.

Abstract

The brachyolmias constitute a clinically and genetically heterogeneous group of skeletal dysplasias characterized by a short trunk, scoliosis and mild short stature. Here, we identify a locus for an autosomal dominant form of brachyolmia on chromosome 12q24.1-12q24.2. Among the genes in the genetic interval, we selected TRPV4, which encodes a calcium permeable cation channel of the transient receptor potential (TRP) vanilloid family, as a candidate gene because of its cartilage-selective gene expression pattern. In two families with the phenotype, we identified point mutations in TRPV4 that encoded R616Q and V620I substitutions, respectively. Patch clamp studies of transfected HEK cells showed that both mutations resulted in a dramatic gain of function characterized by increased constitutive activity and elevated channel activation by either mechano-stimulation or agonist stimulation by arachidonic acid or the TRPV4-specific agonist 4alpha-phorbol 12,13-didecanoate (4alphaPDD). This study thus defines a previously unknown mechanism, activation of a calcium-permeable TRP ion channel, in skeletal dysplasia pathogenesis.


Figures

Figure 1
Figure 1. Pedigree and haplotypes for family R99–102
Filled symbols, affected individuals; open symbols, unaffected individuals; gray boxes, probable affected individuals; *, DNA sample collected. Microsatellite markers are listed to the left of generation III. The haplotype segregating with the disease is boxed, and the shaded boxed loci were excluded by recombination mapping.
Figure 2
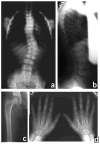
Figure 2. Radiographs of the proband at age 8 years, 3 months
(a) Anterior-posterior view of the spine showing scoliosis and overfaced pedicles. (b) Lateral view of the spine showing anterior rounding of the vertebrae accompanied by flattening of the vertebral bodies. (c) Anterior-posterior view of the proximal femur and acetabulum showing mild irregularity at the proximal femoral metaphyses. (d) Anterior-posterior view of the hands showing delayed ossification.
Figure 3
Figure 3. Gene expression analysis throughout the linked region of chromosome 12
Shown are 230 Affymetrix probe sets representing genes within 12q24.1–24.2 in chromosomal order across the bottom. Data for TRPV4 are marked by the arrow. Cartilage-selective expression (defined in ref. 8) is plotted using the right y axis (black line), and the level of cartilage expression compared to noncartilage tissue (purple bars) or dedifferentiatied chondrocytes (yellow bars) is plotted on the left y axis. Median cartilage selectivity (computed from the linear regression of all points) is represented by the dashed black line. The boundary of the linked region is denoted by the marker loci shown on the x axis.
Figure 4
Figure 4. Expression of human TRPV4 and the R616Q mutant in HEK293 cells
(a) Time course obtained from voltage ramps measured at −100 mV (black boxes) and +100 mV (red circles). 1 μM 4αPDD was applied at the time indicated. HEK cells were transfected with human wild-type TRPV4. The data reflect typical activation of TRPV4. Before application of the specific agonist 4αPDD, currents measured at −100 mV and +100 mV reflect constitutively open channels. After application of 4αPDD, more channels were activated, causing an increase in current at both potentials. (b) Current voltage relationships obtined from the time course shown in a and measured at the points indicated by the filled circles. Note that the IV curves reverse at slightly positive potentials and show a modest inward and outward rectification as typical for TRPV4. No such currents were observed in nontransfected or mock transfected cells (that is, those transfected with the GFP plasmid without the TRPV4 construct (data not shown)). (c) Same experiment as in a; however, cells were transfected with the R616Q mutant of TRPV4. Note the increased current at both potentials before activation with 4αPDD. (d) IV curves from the experiment shown in c. (e) Summarized data from the constitutive current and the 4αPDD activated current measured at −100 mV and +100 mV from wild-type TRPV4 and the mutant channel (mean ± s.e.m., *P < 0.05, n = 14).
Figure 5
Figure 5. Expression of TRPV4 in HEK 293 cells
Same experiments as in Figure 4 and Supplementary Figure 3, except that TRPV4 was stimulated by hypotonic cell swelling (200 mOsm instead of 320 mOsm) and application of 10 μM arachidonic acid (AA). (a) Current voltage relationships (IV) for wild type, R616Q and V620I upon activation by cell swelling. Note the unchanged shape of the IV curves obtained from voltage ramps of the controls before the stimulus (black traces represent the constitutive activity; red traces reflect activity during stimulation). (b) Current activation by 10 mM arachidonic acid measured from voltage ramps at −100 mV and +100 mV. (c) Pooled data from the same series of experiments as shown in a for wild-type TRPV4 (n = 6), R616Q (n = 7) and V620I (n = 7). Averaged values before stimulation (white bars, averaged and s.e.m.) and maximal values during stimulation by hypotonic cell swelling (gray bars). Note that all data on mutants are significantly higher as compared with that of wild type (P < 0.05). Current values are shown for +100 mV and −100 mV. (d) Pooled data from same series of experiments as shown in b for wild-type TRPV4 (n = 6), R616Q (n = 8) and V620I (n = 8). Data are averaged values and s.e.m. Note that values for mutants are significantly higher (P < 0.05) compared with that for wild type, for both constitutively active channels and after stimulation with 200 mOsm or arachidonic acid.

References

    1. Shohat M, Lachman R, Gruber HE, Rimoin DL. Brachyolmia: radiographic and genetic evidence of heterogeneity. Am J Med Genet. 1989;33:209–219. - PubMed
    1. Kornak U, Mundlos S. Genetic disorders of the skeleton: a developmental approach. Am J Hum Genet. 2003;73:447–474. - PMC - PubMed
    1. Superti-Furga A, Bonafe L, Rimoin DL. Molecular-pathogenetic classification of genetic disorders of the skeleton. Am J Med Genet. 2001;106:282–293. - PubMed
    1. Horton WA, Langer LO, Collins DL, Dwyer C. Brachyolmia, recessive type (Hobaek): a clinical, radiographic, and histochemical study. Am J Med Genet. 1983;16:201–211. - PubMed
    1. Toledo SPA, et al. Recessively inherited, late onset spondylar dysplasia and peripheral corneal opacity with anomalies in urinary mucopolysaccharides: a possible error of chondroitin-6-sulfate synthesis. Am J Med Genet. 1978;2:385–395. - PubMed

Publication types

Associated data