. 2008 Jul;14(7):778-82.
doi: 10.1038/nm1785. Epub 2008 Jun 29.

Hepatic insulin resistance directly promotes formation of cholesterol gallstones

Affiliations

Hepatic insulin resistance directly promotes formation of cholesterol gallstones

Sudha B Biddinger et al. Nat Med. 2008 Jul.

Abstract

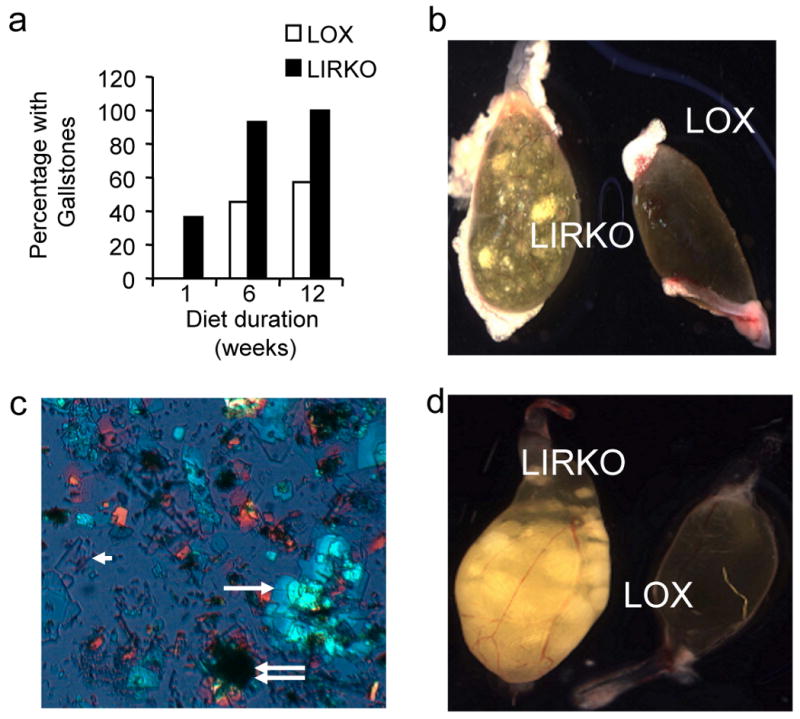
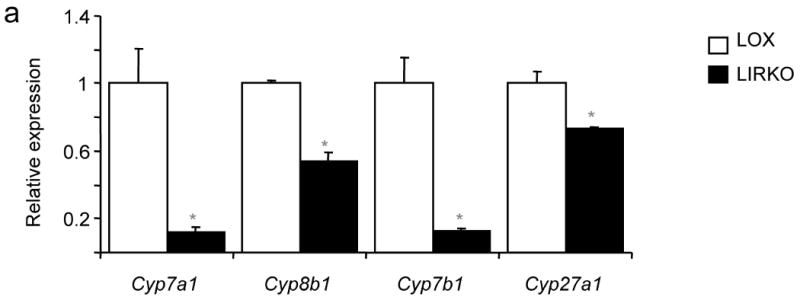
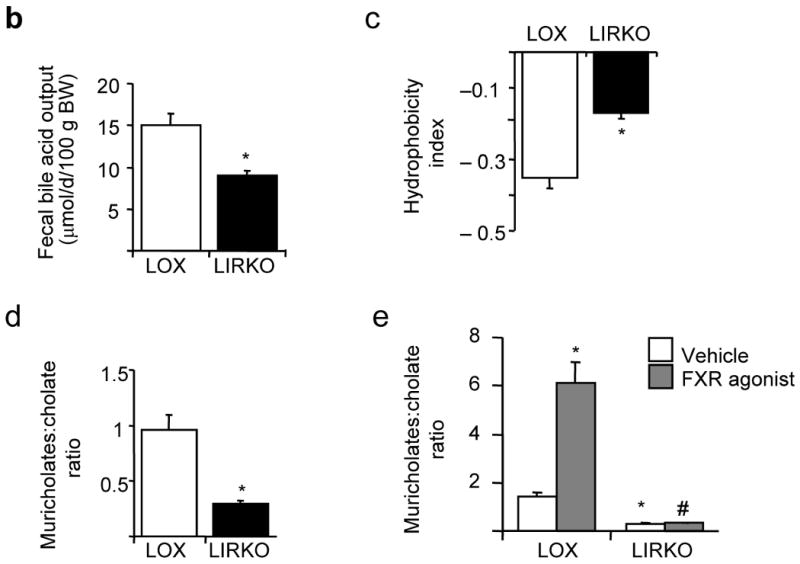
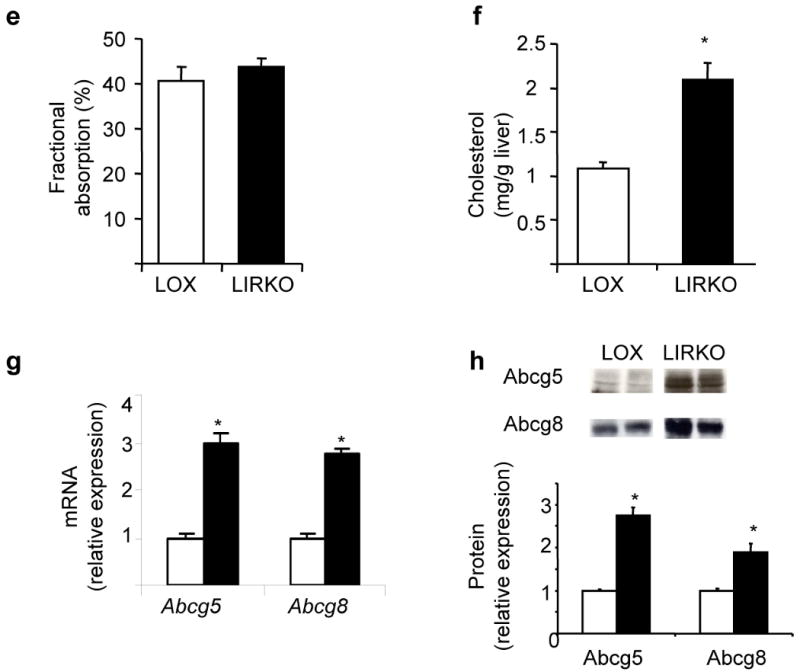
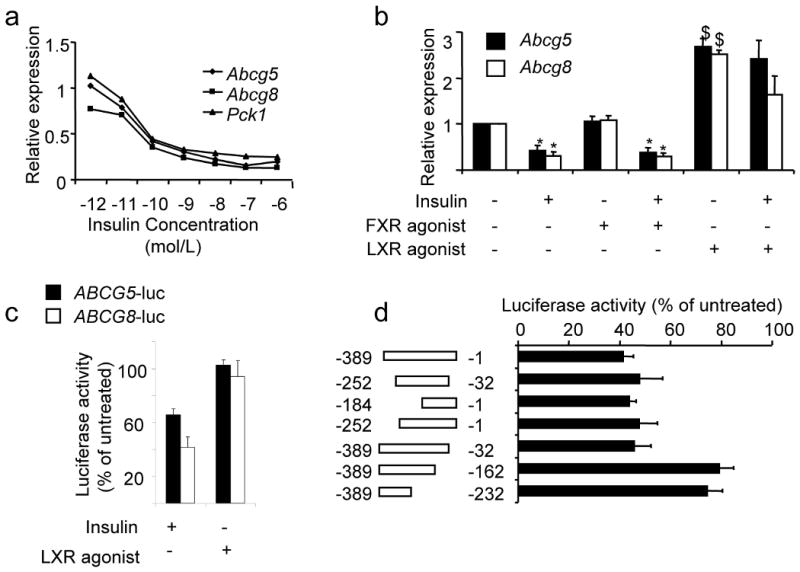
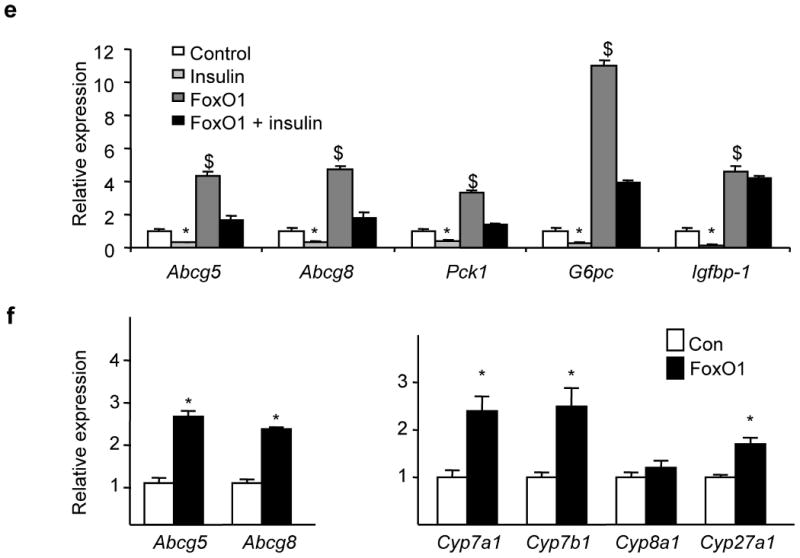
Despite the well-documented association between gallstones and the metabolic syndrome, the mechanistic links between these two disorders remain unknown. Here we show that mice solely with hepatic insulin resistance, created by liver-specific disruption of the insulin receptor (LIRKO mice) are markedly predisposed toward cholesterol gallstone formation due to at least two distinct mechanisms. Disinhibition of the forkhead transcription factor FoxO1, increases expression of the biliary cholesterol transporters Abcg5 and Abcg8, resulting in an increase in biliary cholesterol secretion. Hepatic insulin resistance also decreases expression of the bile acid synthetic enzymes, particularly Cyp7b1, and produces partial resistance to the farnesoid X receptor, leading to a lithogenic bile salt profile. As a result, after twelve weeks on a lithogenic diet, all of the LIRKO mice develop gallstones. Thus, hepatic insulin resistance provides a crucial link between the metabolic syndrome and increased cholesterol gallstone susceptibility.


Figures

Figure 1
Figure 1. LIRKO mice are susceptible to cholesterol gallstone formation
(a) The prevalence of gallstones in male Lox and LIRKO mice after being fed a lithogenic diet for 1, 6 or 12 weeks, and sacrificed at 5-7 months of age (n=10-15 per group). (b) Macroscopic appearance of gallbladders from Lox and LIRKO mice after one week on the lithogenic diet. (c) Polarized light microscopy of bile from a LIRKO mouse fed a lithogenic diet for one week demonstrating solid cholesterol monohydrate crystals (arrowhead) aggregating into sandy stones (single white arrow) and true stones (double arrow) (d) Macroscopic appearance of gallbladders from Lox and LIRKO female mice after 12 weeks of consuming the lithogenic diet. Note that early stones formed after one week on the lithogenic diet developed into numerous large true stones by 12 weeks. Lox mice that did not develop gallstones displayed gallbladders that were normal in appearance and size.
Figure 2
Figure 2. LIRKO mice show quantitative and qualitative defects in bile acid synthesis on a chow diet
(a) Real-time PCR analysis of cDNA prepared from six-week old mice sacrificed during the light cycle following a 24 hour fast; the expression of each gene was normalized to its value in Lox mice (n=5-8, *p=0.05 versus Lox). (b) Since the synthesis of bile acids is equivalent to fecal excretion in the steady state, we assessed bile acid synthesis by collecting feces from 3 month old Lox and LIRKO mice for 72 hours and measuring total bile acid outputs (n=4, p=0.02). Hepatic bile from 5-6 month old Lox and LIRKO mice was subjected to HPLC analysis as described in Methods (n=4-5). (c) Hydrophobicity indices were calculated as described in Methods (*p=0.002). (d) The ratio of muricholates to cholate was calculated using the molar percentages of tauroα- and tauroβ- muricholate and taurocholate (*p=0.001). (e) Three-month old mice were gavaged with an FXR agonist (GW4064) at 100 mg/kg/d or vehicle for 14 days. Mice were fasted overnight, and sacrificed two hours after the last dose of agonist. Bile was expressed from the gallbladder and ratio of muricholates to cholate was determined as above. *p<0.05 versus Lox untreated; #p<0.05 versus Lox treated.
Figure 3
Figure 3. Biliary cholesterol content is increased in LIRKO mice, promoting supersaturated bile
(a) Bile was collected from the common bile duct of 5-6 month old mice. Cholesterol (CH) secretory rates were derived from cholesterol concentrations and normalized to body weight (BW, *p=0.003, n=4-5 per group). (b) Relative lipid compositions (mol per 100 mol) of gallbladder bile obtained from Lox (open circles) and LIRKO (closed triangles) mice fed a chow diet were calculated and plotted on a partial condensed phase diagram (see Methods). The different phases are indicated for equilibrium conditions: micelles only (yellow); micelles and liquid crystals (orange); micelles, liquid crystals and cholesterol monohydrate crystals (red); and micelles and cholesterol monohydrate crystals (gray). Relative lipid compositions of bile from control mice plot in a zone in which only micelles would form at equilibrium, but bile from LIRKO mice plot in zones in which liquid crystals (orange) or both liquid crystals and cholesterol monohydrate crystals (red) in addition to micelles would form at equilibrium. (c) Cholesterol Saturation Indices (CSI) of gallbladder bile obtained from 5-6 month old mice were calculated as described in Methods. (d) Gallbladder volumes from 5-6 month old mice. Each point represents a single mouse, whereas long and short lines represent mean and SEM, respectively (*p=0.004). (e) Cholesterol absorption was measured in 4 month old mice by a fecal dual isotope ratio method. (f) Hepatic lipids were extracted from 2-3 month old Lox and LIRKO mice and total cholesterol content was measured by gas chromatography (n=4-6, *p<0.05). (g) Real-time PCR analysis of RNA isolated from the livers of non-fasted 8-10 week old mice (n=8, *p<1 x 10⁻⁵). (h) Membranes purified from 8-10 week old mice were subjected to immunoblotting with antibodies against ABCG5 or ABCG8, and quantified with ImageJ software (*p<0.05, n=3-4).
Figure 4
Figure 4. Insulin and LXR regulate Abcg5/ABCG8 expression
(a) Fao rat hepatoma cells were serum-starved overnight, and then treated with the indicated amounts of insulin for 6-8 hours. We performed real-time PCR and normalized the expression of each gene to its expression level in the absence of insulin (n=3). (b) Cells were cultured overnight in the presence or absence of 100 nM insulin, and either vehicle (DMSO), 50 nM FXR agonist (GW4064) or 5 μM LXR agonist (T090137). Gene expression was measured by real-time PCR analysis (n=3). (c) Cells were transfected with a luciferase reporter fused to the intragenic region of the ABCG5/ABCG8 gene in either the ABCG5 or ABCG8 orientation, and treated overnight with 100 nM insulin or 5 μM LXR agonist, or left untreated (n=3-5). (d) As described in Methods, we made constructs containing deletions in the ABCG5/ABCG8 intragenic region (in the ABCG8 orientation) and tested their ability to respond to insulin. For each construct, data are presented as luciferase activity in the presence of insulin divided by luciferase activity in the absence of insulin x 100% (n=3-8). (e) Cells were infected with control adenovirus or adenovirus encoding constitutively active FOXO1. Two days following infection, cells were washed, and incubated overnight in the presence or absence of 100 nM insulin, before being harvested for real-time PCR analysis (n=3). (f, g) Real-time PCR was used to measure gene expression in 8-week old male mice overexpressing constitutively active FOXO1 under the α1-antitrypsin promoter and their controls, after being fed a high carbohydrate diet for six hours after a 24 hour fast, as described previously (*p<0.05 versus value in the absence of insulin; $p<0.05 versus value in the absence of agonist or constitutively active FOXO1)

Comment in

References

    1. Third Report of the National Cholesterol Education Program (NCEP) Expert Panel on Detection, Evaluation, and Treatment of High Blood Cholesterol in Adults (Adult Treatment Panel III) final report. Cirulation. 2002;106:3143–3421. - PubMed
    1. Diehl AK. Cholelithiasis and the insulin resistance syndrome. Hepatology. 2000;31:528–530. - PubMed
    1. Everhart JE, Khare M, Hill M, Maurer KR. Prevalence and ethnic differences in gallbladder disease in the United States. Gastroenterology. 1999;117:632–639. - PubMed
    1. Sandler RS, et al. The burden of selected digestive diseases in the United States. Gastroenterology. 2002;122:1500–1511. - PubMed
    1. Osler W. The Principles and Practice of Medicine. D. Appleton and Company; New York: 1892. p. 432.

Publication types

MeSH terms

Substances