Review
. 2008 Dec;8(5-6):396-413.
doi: 10.1016/j.mito.2008.05.003. Epub 2008 May 23.

Neuroimaging of mitochondrial disease

Affiliations
Review

Neuroimaging of mitochondrial disease

Russell P Saneto et al. Mitochondrion. 2008 Dec.

Abstract

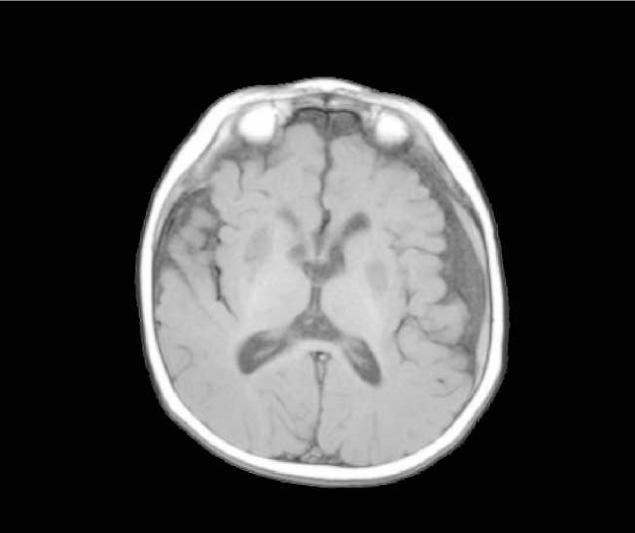
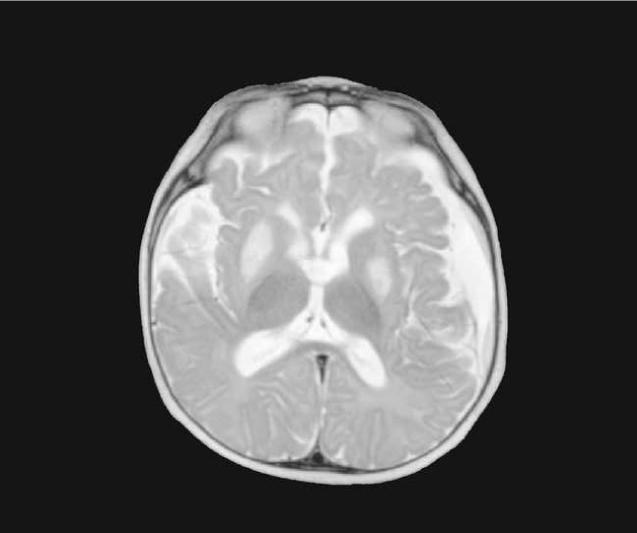
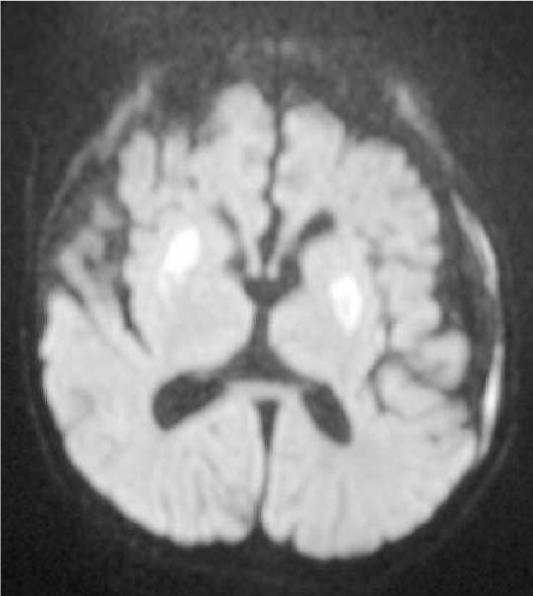
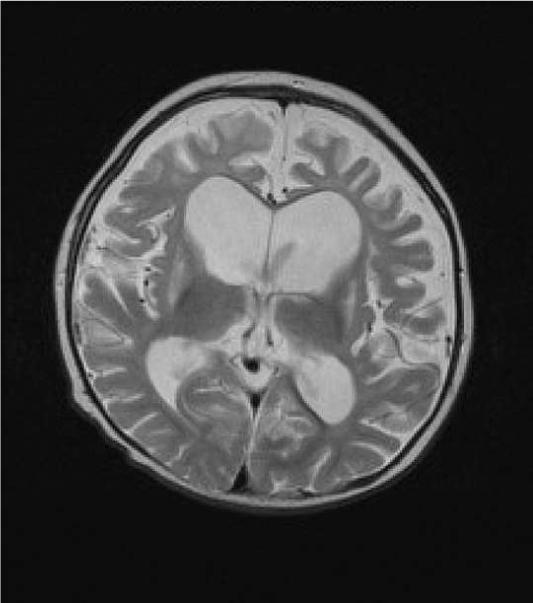
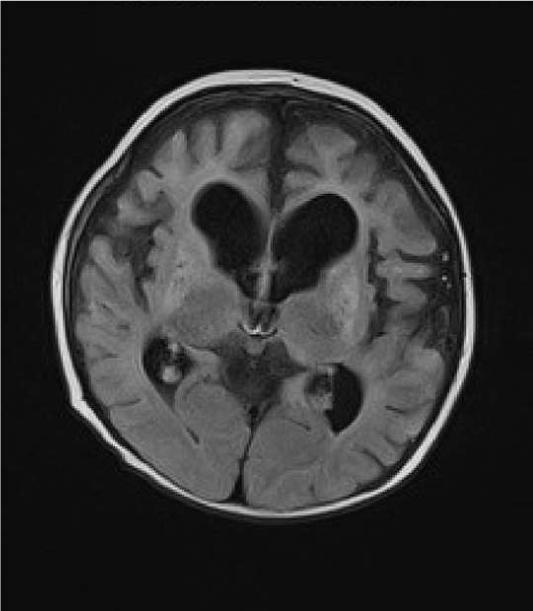
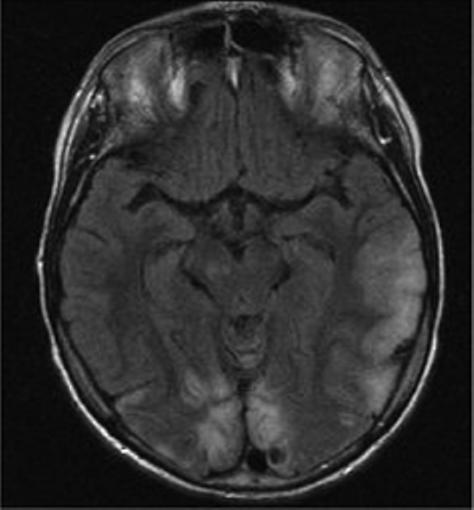
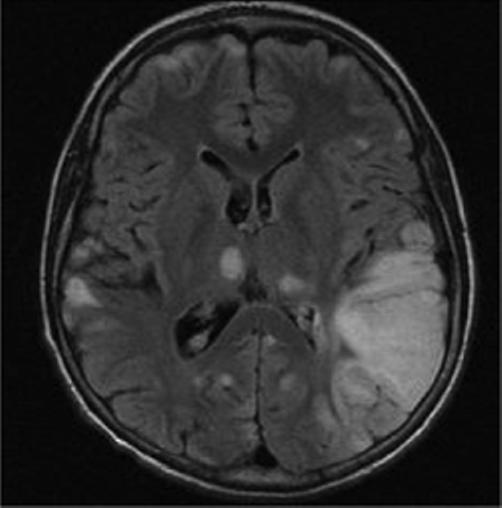
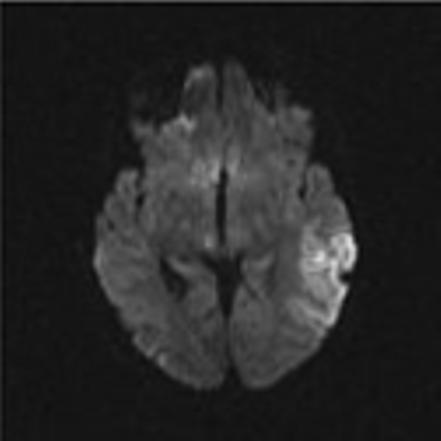
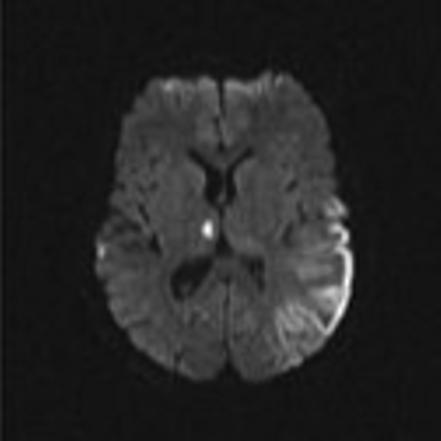
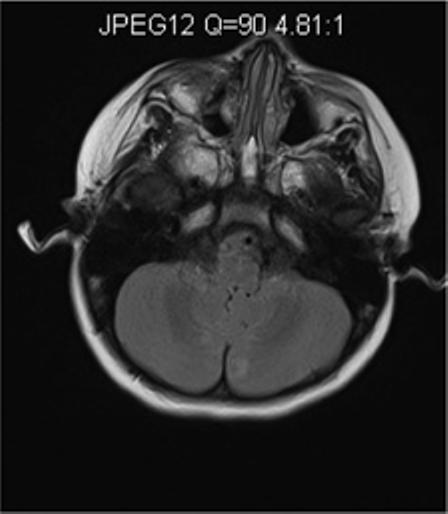
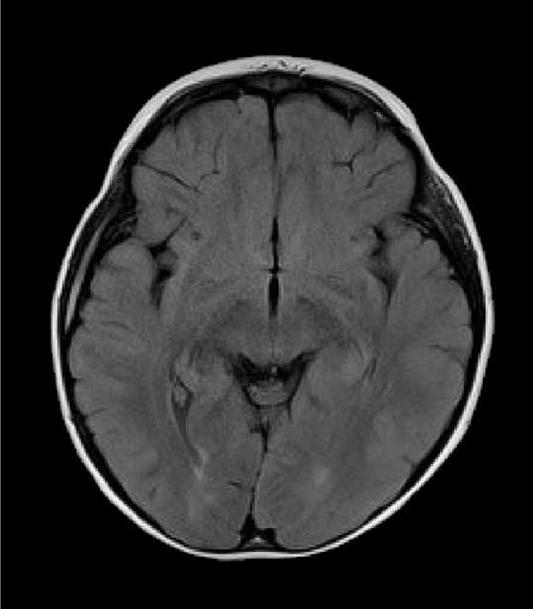
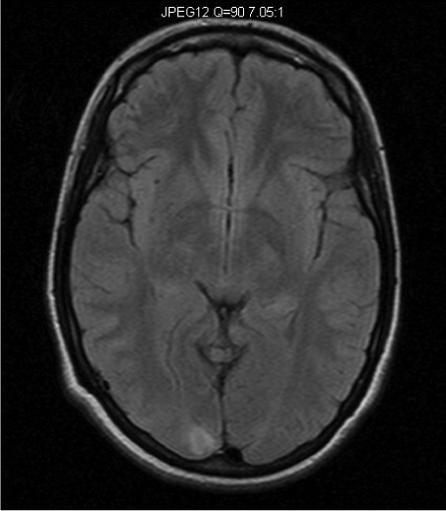
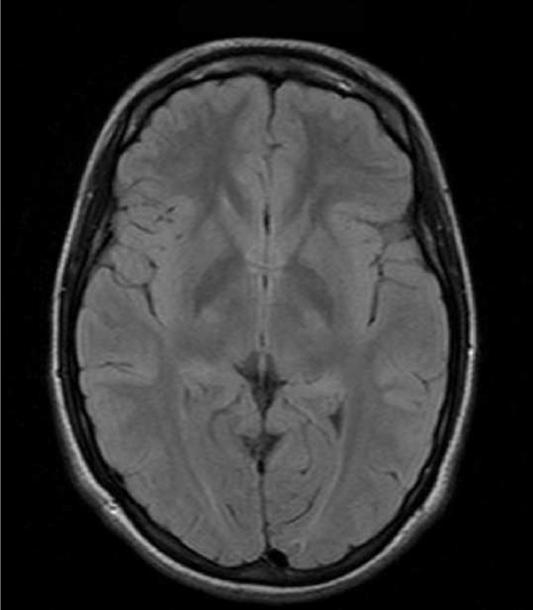
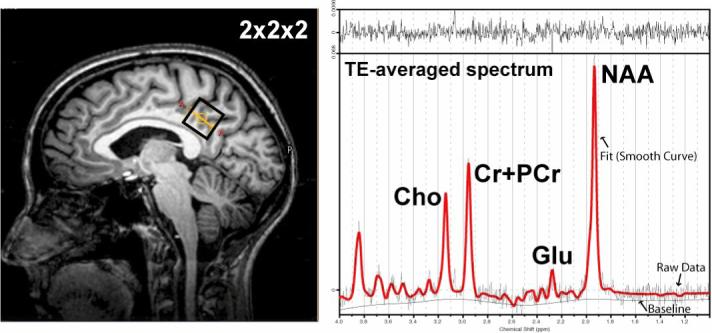
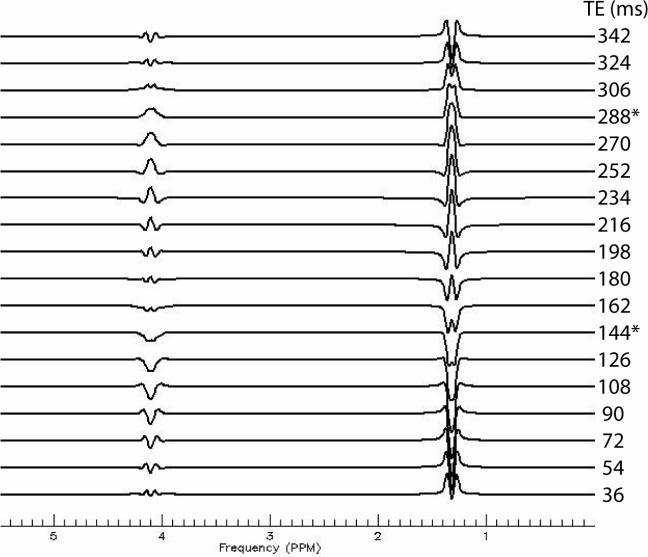
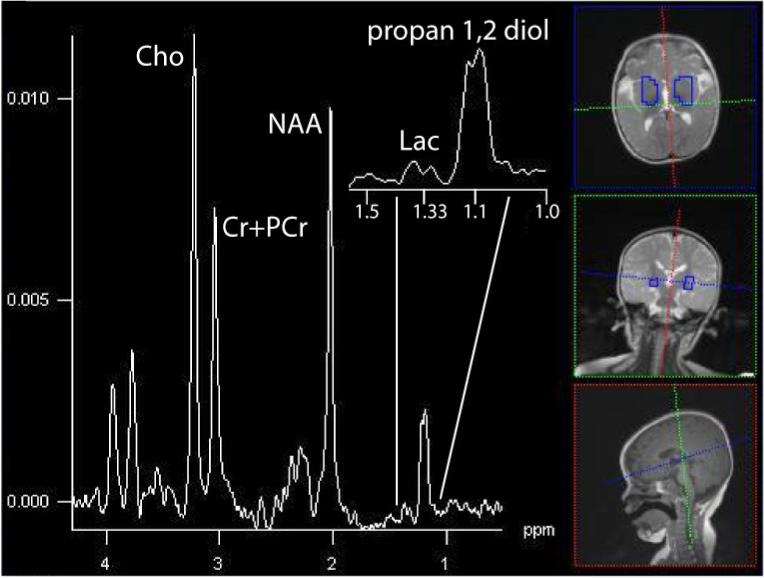
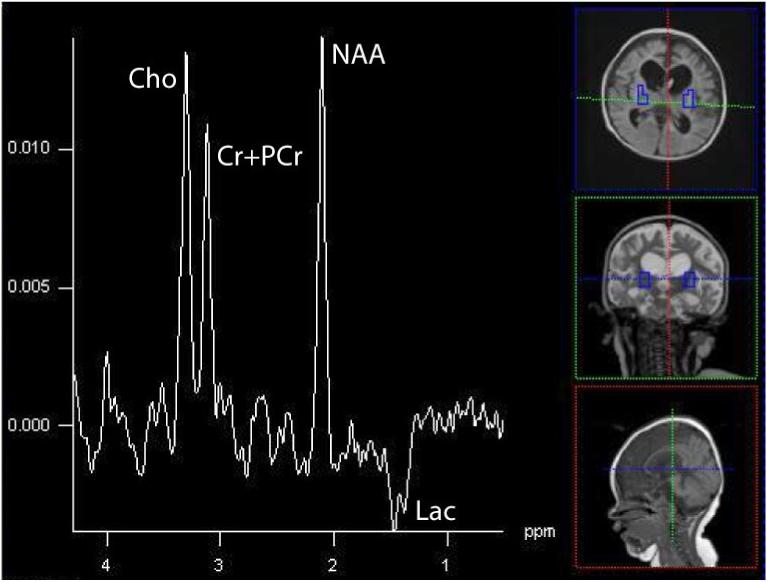
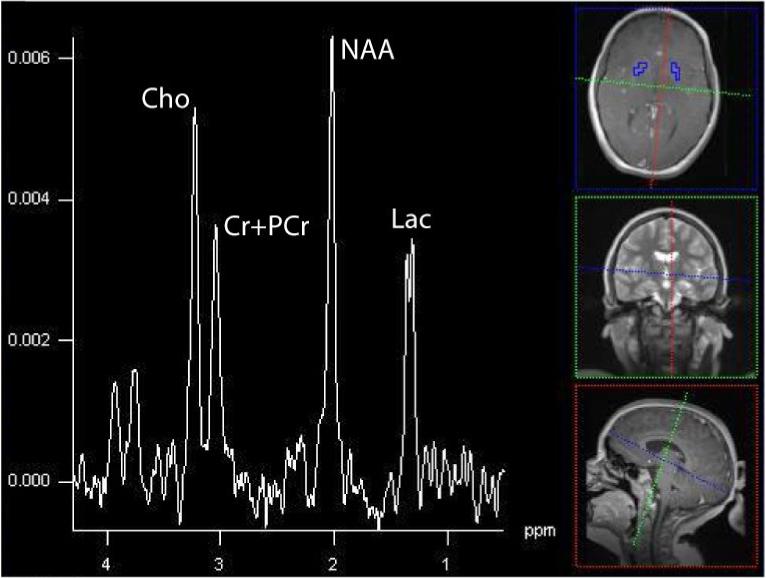
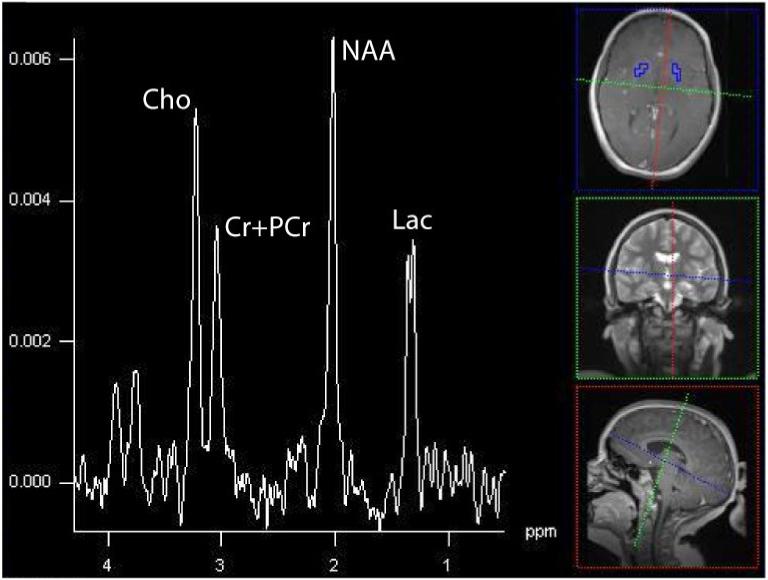
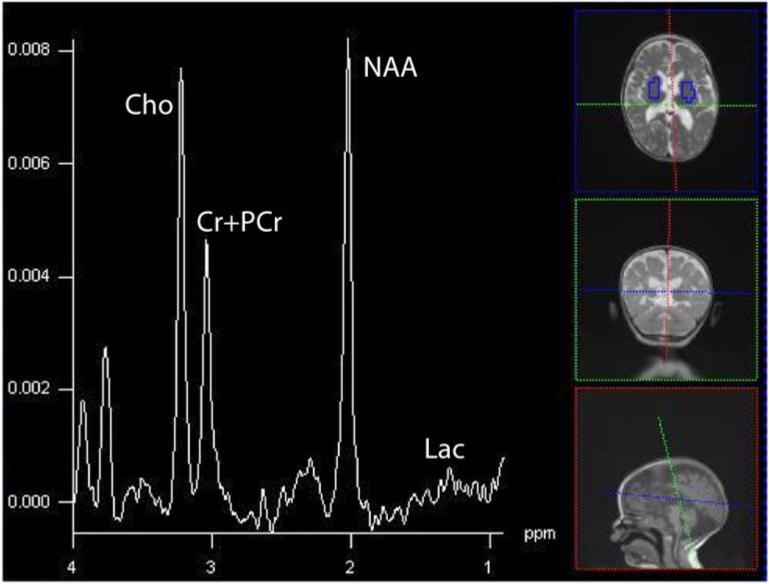
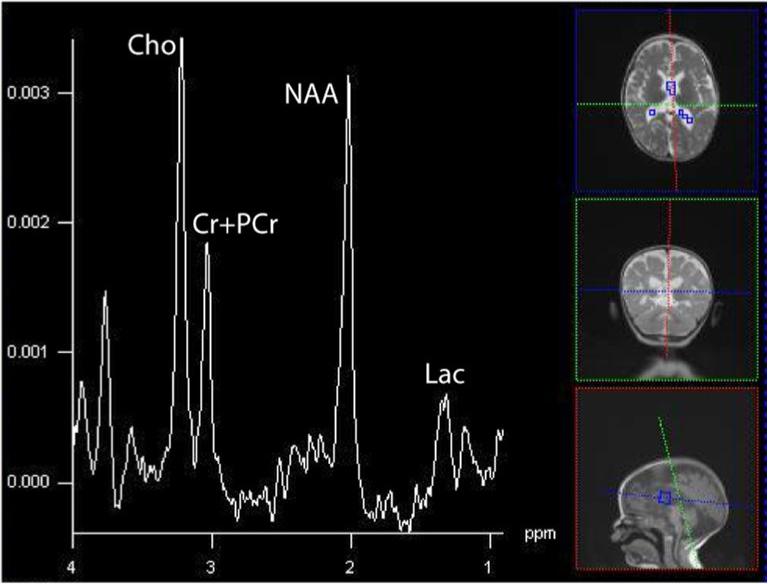
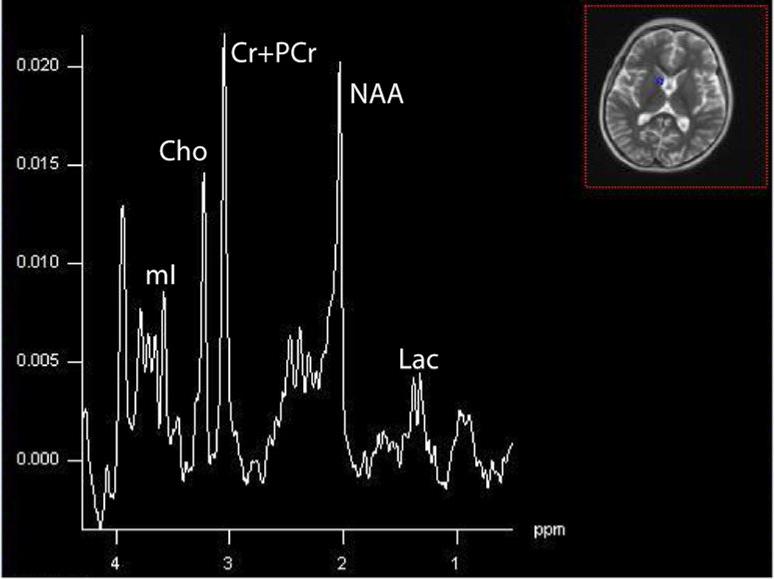
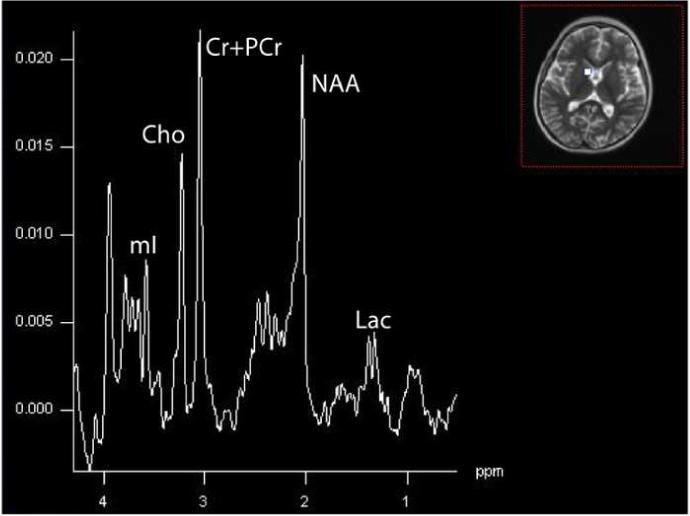
Mitochondrial disease represents a heterogeneous group of genetic disorders that require a variety of diagnostic tests for proper determination. Neuroimaging may play a significant role in diagnosis. The various modalities of nuclear magnetic resonance imaging (MRI) allow for multiple independent detection procedures that can give important anatomical and metabolic clues for diagnosis. The non-invasive nature of neuroimaging also allows for longitudinal studies. To date, no pathonmonic correlation between specific genetic defect and neuroimaging findings have been described. However, certain neuroimaging results can give important clues that a patient may have a mitochondrial disease. Conventional MRI may show deep gray structural abnormalities or stroke-like lesions that do not respect vascular territories. Chemical techniques such as proton magnetic resonance spectroscopy (MRS) may demonstrate high levels of lactate or succinate. When found, these results are suggestive of a mitochondrial disease. MRI and MRS studies may also show non-specific findings such as delayed myelination or non-specific leukodystrophy picture. However, in the context of other biochemical, structural, and clinical findings, even non-specific findings may support further diagnostic testing for potential mitochondrial disease. Once a diagnosis has been established, these non-invasive tools can also aid in following disease progression and evaluate the effects of therapeutic interventions.


Figures

Figure 1
Figure 1
MRI and MRS from a boy with Leigh Syndrome. At 7 months bilateral putamenal lesions demonstrate low signal intensity on T1 weighted (Figure 1A) and hyperintensity on T2 weighted (Figure 1B) images while a diffusion weighted image ( Figure 1C) demonstrates hyperintensity reflecting restricted diffusion typical of acute ischemia in the putamen. Follow up imaging at 19 months demonstrates focal atrophy of the putamen and as well as generalized atrophy on T2 weighted (Figure 1D) and FLAIR imaging (Figure 1E), and increased lactate in the putamen (arrow) on MRS (see figure 8)
Figure 1
Figure 1
MRI and MRS from a boy with Leigh Syndrome. At 7 months bilateral putamenal lesions demonstrate low signal intensity on T1 weighted (Figure 1A) and hyperintensity on T2 weighted (Figure 1B) images while a diffusion weighted image ( Figure 1C) demonstrates hyperintensity reflecting restricted diffusion typical of acute ischemia in the putamen. Follow up imaging at 19 months demonstrates focal atrophy of the putamen and as well as generalized atrophy on T2 weighted (Figure 1D) and FLAIR imaging (Figure 1E), and increased lactate in the putamen (arrow) on MRS (see figure 8)
Figure 2
Figure 2
Axial MR images in a child with MELAS lesions. Patient is a 10 year old boy with a complex I and III defect without the mitochondrial DNA mutation at position 3243. Although he has phenotypic MELAS, he has another unknown genotypic etiology of MELAS. Axial FLAIR imaging through the level of the midbrain (Figure 2A) and basal ganglia (Figure 2B) demonstrates hyperintense lesions bilaterally in the thalami and occipital cortex as well as an extensive area of abnormality involving the left posterior temporal- parietal lobe and a small area in the right parietal operculum. Corresponding diffusion weighted images (Figure 2C and Figure 2D) demonstrate restricted diffusion in the right thalamic, right opercular and left temporal-parietal lesions consistent with acute ischemia, but not in occiptial and left thalamic area abnormal on the FLAIR imaging, suggesting these are likely older lesions. Note also that the diffusion abnormality in the temporal-parietal lesion is concentrated in the gray matter.
Figure 2
Figure 2
Axial MR images in a child with MELAS lesions. Patient is a 10 year old boy with a complex I and III defect without the mitochondrial DNA mutation at position 3243. Although he has phenotypic MELAS, he has another unknown genotypic etiology of MELAS. Axial FLAIR imaging through the level of the midbrain (Figure 2A) and basal ganglia (Figure 2B) demonstrates hyperintense lesions bilaterally in the thalami and occipital cortex as well as an extensive area of abnormality involving the left posterior temporal- parietal lobe and a small area in the right parietal operculum. Corresponding diffusion weighted images (Figure 2C and Figure 2D) demonstrate restricted diffusion in the right thalamic, right opercular and left temporal-parietal lesions consistent with acute ischemia, but not in occiptial and left thalamic area abnormal on the FLAIR imaging, suggesting these are likely older lesions. Note also that the diffusion abnormality in the temporal-parietal lesion is concentrated in the gray matter.
Figure 3
Figure 3
Axial MR images of a young girl with Alpers syndrome. Genetic testing showed she had heterozygous mutations in the polymerase gamma 1 gene (p.Q67X and p.A467T). She presented with epilepticus partialis continua (EPC) arising from the right occipital region as well as hallucinations. Axial FLAIR imaging at this time demonstrated left cerebellar hyperintensity (Figure 3A). Status was stopped but unfortunately seizures continued. Psychomotor deterioration, ataxia and cortical blindness developed over 4 months. She developed fulminate liver failure when Valproic acid was given 3 months after EPC. Axial FLAIR imaging shows newly developed bilateral occipital lobe hyperintensities near the time of death; within 2 months after Valproic acid was initially given (Figure 3B).
Figure 3
Figure 3
Axial MR images of a young girl with Alpers syndrome. Genetic testing showed she had heterozygous mutations in the polymerase gamma 1 gene (p.Q67X and p.A467T). She presented with epilepticus partialis continua (EPC) arising from the right occipital region as well as hallucinations. Axial FLAIR imaging at this time demonstrated left cerebellar hyperintensity (Figure 3A). Status was stopped but unfortunately seizures continued. Psychomotor deterioration, ataxia and cortical blindness developed over 4 months. She developed fulminate liver failure when Valproic acid was given 3 months after EPC. Axial FLAIR imaging shows newly developed bilateral occipital lobe hyperintensities near the time of death; within 2 months after Valproic acid was initially given (Figure 3B).
Figure 4
Figure 4
Axial MR images of an adolescent/young adult woman with Alpers syndrome. Genetic testing revealed that she was homozygous for the p.A467T mutation in the polymerase gamma 1 gene. She presented with episodic ataxia at age 5 with mild sensorineural hearing loss. MR imaging at that time was normal. At age 15 years she developed epilepsia partialis continua (EPC). Axial FLAIR imaging done at this time showed a right occipital lobe hyperintensity (Figure 4A). Seizures were controlled and she remained seizure free for 8 years. She subsequently developed segmental myoclonus and was treated with Valproic acid and developed fulminate liver failure. Axial FLAIR imaging just prior to death showed resolution of right occipital lobe hyperintensity and virtually normal MRI (Figure 4B).
Figure 4
Figure 4
Axial MR images of an adolescent/young adult woman with Alpers syndrome. Genetic testing revealed that she was homozygous for the p.A467T mutation in the polymerase gamma 1 gene. She presented with episodic ataxia at age 5 with mild sensorineural hearing loss. MR imaging at that time was normal. At age 15 years she developed epilepsia partialis continua (EPC). Axial FLAIR imaging done at this time showed a right occipital lobe hyperintensity (Figure 4A). Seizures were controlled and she remained seizure free for 8 years. She subsequently developed segmental myoclonus and was treated with Valproic acid and developed fulminate liver failure. Axial FLAIR imaging just prior to death showed resolution of right occipital lobe hyperintensity and virtually normal MRI (Figure 4B).
Figure 5
Figure 5
Example 1H TE-averaged data-set collected from a 2×2×2 voxel in the posterior-cingulate cortex at 3T. The commonly observed resonances in the 1H spectrum. Choline containing compounds (Cho), Creatine + Phoshocreatine (Cr+PCr), glutamate (Glu), and N-acetylaspartate (NAA) are shown.
Figure 6
Figure 6
Simulated lactate spectrum using the PRESS pulse sequence (point-resolved spectroscopy) pulse sequence (TE1=18 ms, incrementing TE2). The most common echo times employed for measuring lactate are shown with asterisks. No relaxation estimation has been added to the simulation, thus, lactate at 343 ms has not been properly damped in amplitude as would occur in vivo. Furthermore, the lactate commonly reported in the 1Hspectrum is only the doublet at 1.33 ppm because the residual water signal dwarfs the 4.15 multiplet.
Figure 7
Figure 7
The summed spectrum from central gray nuclei shows in a 12-month old patient with a markedly elevated resonance at 1.1 ppm, propan-1,2-diol, that can be mistaken for Lac without careful examination (3T, TE=288 ms, TR=1700 ms, 16×16 acquistion, interpolated to 32×32, 16cm).
Figure 8
Figure 8
Bilateral putaminal nuclei in a 19-month old patient with Leigh syndrome due to the 8993T>G mutation in the mtDNA. An elevated inverted Lac is found at this echo time (135 ms) acquired on a 1.5T Avanto scanner (Siemens Medical System, TE=135, TR=1.5s, 16×16 matrix, interpolated to 32×32, 16cm).
Figure 9
Figure 9
Summed spectra acquired at 3T (Siemens Trio, TE=288, TR=1700, 16×16 matrix, interpolated to 32×32, 16cm) showing dramatically elevated Lac. This patient was 6-year old male who developed respiratory distress, severe muscle weakness, and systemic lactate acidemia and found to have a complex III defect within muscle biopsy.
Figure 10
Figure 10
Summed spectra in CSF within the same 6-year old patient with Leigh-like syndrome as shown above (Figure 9). The inverted Lac is of greater magnitude than in brain, illustrating the potential difference in concentration between compartments.
Figure 11a and 11b
Figure 11a and 11b
Summed spectra in brain and CSF for the 19-month old with a complex IV defect. Clinically, she demonstrated sensorineural hearing loss, seizures, cortical vision impairment, and axial hypotonia.(16×16 acquisition interpolated to 32×32, TE=288, TR=1700, FOV=16cm). Through the spectra are not corrected for the number of voxels, hence the magnitudes are larger in the upper than lower spectrum, it is appreciable by eye that greater Lac is in CSF, whereas little lactate can be seen in brain. The persistent neurochemicals in CSF (Cho, Cr+PCr, and NAA) reflect the partial tissue volume of the ventricular voxels in the axial plane, combined with the applied point-spread-function hamming filter that smoothes data spatially prior to analyses. CSF has few MRS-visible metabolites except for Lac.
Figure 11a and 11b
Figure 11a and 11b
Summed spectra in brain and CSF for the 19-month old with a complex IV defect. Clinically, she demonstrated sensorineural hearing loss, seizures, cortical vision impairment, and axial hypotonia.(16×16 acquisition interpolated to 32×32, TE=288, TR=1700, FOV=16cm). Through the spectra are not corrected for the number of voxels, hence the magnitudes are larger in the upper than lower spectrum, it is appreciable by eye that greater Lac is in CSF, whereas little lactate can be seen in brain. The persistent neurochemicals in CSF (Cho, Cr+PCr, and NAA) reflect the partial tissue volume of the ventricular voxels in the axial plane, combined with the applied point-spread-function hamming filter that smoothes data spatially prior to analyses. CSF has few MRS-visible metabolites except for Lac.
None
None

Similar articles

Cited by

References

    1. Abe K. Cerebral lactic acidosis correlates with neurological impairment in MELAS. Neurology. 2004;53:2458. - PubMed
    1. Abu-Amero KK, Bosley TM, Bohlega S, Hansen E. Mitochondrial T9957C mutation in association with NAION and seizures but not MELAS. Ophthalmic Genet. 2005;26:31–36. - PubMed
    1. Ackrell BAC, Johnson MK, Gunsalus RP, Cecchini G. Structure and function of succinate dehydrogenase and fumarate reductase. In: Muller F, editor. Biochemistry of flavoenzymes. CRC; Boca Raton, FL: 1992. pp. 229–297.
    1. Apostolova LG, White M, Moore SA, Davis PH. Deep white matter pathologic features in watershed regions: a novel pattern of central nervous system involvement in MELAS. Arch. Neurol. 2005;62:1154–1156. - PubMed
    1. Barbiroli B, Frassineti C, Martinelli P, Lotti S, Lodi R, Cortelli P, Montagna P. Coenzyme Q10 improves mitochondrial respiration in patients with mitochondrial cytopathies. An in vivo study on brain and skeletal muscle by phosphorous magnetic resonance spectroscopy. Cell Mol. Biol. (Noisy-le-grand) 1997;43:741–749. - PubMed

Publication types

MeSH terms