. 2008 Aug 15;586(16):3949-62.
doi: 10.1113/jphysiol.2008.151191. Epub 2008 Jun 26.

Regulation of quantal shape by Rab3A: evidence for a fusion pore-dependent mechanism

Affiliations

Regulation of quantal shape by Rab3A: evidence for a fusion pore-dependent mechanism

Xueyong Wang et al. J Physiol. .

Abstract

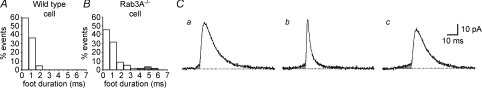
The function of Rab3A, a small GTPase located on synaptic vesicles, is not well understood. Studies in the Rab3A(-/-) mouse support a role in activity-dependent plasticity, but have not reported any effects on spontaneously occurring miniature synaptic currents, except that there is a decrease in resting frequency at the neuromuscular junction. Therefore we were surprised to find an increase in the occurrence of mEPCs with abnormally long half-widths at the neuromuscular junctions of Rab3A(-/-) mice. The abnormal miniature endplate currents (mEPCs), which have significantly greater charge than the average mEPCs for the same fibres, could arise from larger vesicles. However, the type of mEPC most increased in Rab3A(-/-) mice has a slow rise, which suggests it is not the result of full collapse fusion. To test if the slow mEPCs increased after loss of Rab3A could be due to malfunctioning fusion pores, we used carbon fibre amperometry to record pre-spike feet, which have been shown to correspond to the initial opening of a narrow fusion pore, in adrenal chromaffin cells of wild-type and Rab3A(-/-) mice. We found that small amplitude pre-spike feet with abnormally long durations were increased in Rab3A(-/-) cells. The correspondence between mEPC and amperometric data supports our interpretation that slow rising, long half-width mEPCs are caused by reduced diameter fusion pores that remain open longer. These data could be explained by a direct action of Rab3A on the fusion pore, or by Rab3A-dependent control of vesicles with unusual fusion pore characteristics.


Figures

Figure 1
Figure 1. Abnormal miniature endplate currents (mEPCs) at the neuromuscular junctions of wild-type and Rab3A−/− mice
A and B, selected 125 ms records of spontaneously occurring mEPCs in a wild-type fibre and Rab3A−/− fibre, respectively. Records were chosen to illustrate shapes of normal and ‘abnormal’ (*) events, and were separated by 1 or more records without events. C and D, overlays of 100 aligned mEPCs from the wild-type and Rab3A−/− fibres in A and B. The white traces are the averages of the aligned mEPCs. E and F, frequency histograms of amplitudes, and G and H, frequency histograms of half-widths, for wild-type and Rab3A−/− fibres from A and B. Outliers, shown in red, are defined by being outside the y = 0.05 value of the Gaussian fit (smooth line).
Figure 2
Figure 2. Fibres have higher percentages of mEPCs that qualify as half-width outliers in Rab3A−/− animals
A and B, frequency histograms for percentage of mEPCs that are half-width outliers, for wild-type fibres and Rab3A−/− fibres, respectively. C, cumulative plots for the same data in A and B. For each fibre, the percentage of half-width outliers was determined by counting the number of mEPCs with values greater than the y = 0.05 point on the Gaussian fit of the half-width frequency histogram, dividing by the total number of mEPCs, and multiplying by 100. The two groups are statistically different, P < 0.001, Mann–Whitney U test on fibres; P < 0.001, Kolmogorov–Smirnov on fibres; P = 0.017, ANOVA on animals. 149 fibres from 7 wild-type animals; 125 fibres from 6 Rab3A−/− animals.
Figure 3
Figure 3. Unusual time courses for mEPCs identified as half-width outliers: examples selected from a Rab3A−/− fibre
A mEPC with a normal half-width (a) closely follows the average mEPC, shown in red, whereas three mEPCs with outlier half-widths, bd, do not match the average mEPC. The average mEPC trace is obtained by averaging all mEPC traces recorded in the fibre. The examples in b and c follow the average mEPC initially, but diverge because the current continues past the peak of the average mEPC. In contrast, the example in d immediately deviates from the average mEPC with a much reduced slope on the rising phase. The overlay is the same as that shown in Fig. 1D.
Figure 4
Figure 4. Three categories of long half-width mEPCs can be distinguished based on shape of the rising phase
A, example of a mEPC in Category I, which includes wide mEPCs that rise to a peak with the same time course as the average mEPC, shown in red. B, example of a mEPC in Category II, which includes wide mEPCs that initially follow the rising phase of the average mEPC, but continue, and have a 10–90% rise time ≥ 0.65 ms. C, example of a mEPC in Category III, which includes wide mEPCs that immediately deviate from the average mEPC, and have a rise time ≥ 0.65 ms. Note that the average mEPC used for comparision (red trace) is different for each fibre.
Figure 5
Figure 5. Amperometric currents were elicited by perfusion with 25 mm KCl for 8 min
A and B, representative traces recorded in a wild-type and a Rab3A−/− chromaffin cell, respectively. C, individual amperometric spike, showing the parameters examined for comparison between wild-type and Rab3A−/− cells. The dotted lines indicating baseline, foot and half-width locations were added by the Quantal Analysis automated detection software (see Methods).
Figure 7
Figure 7. Examples of amperometric spikes with small amplitude pre-spike feet, a normal amplitude foot, and no foot
Traces were selected with similar main spike amplitudes to show a normal amplitude foot, 6.1 pA, 3.3 ms duration (A); two small amplitude feet, 1.7 pA, 2.7 ms duration (B) and 1.5 pA, 1.8 ms duration (C); and a spike with no foot (D). The traces on the left and right are the same, shown with different axes. The feet are highlighted in grey on the right only. The dotted lines were added by the Quantal Analysis macro automated detection program (see Methods).
Figure 6
Figure 6. Increased percentage of amperometric spikes with small amplitude feet in Rab3A−/− chromaffin cells
A and B, frequency distributions of pre-spike foot amplitudes for a respresentative wild-type cell and Rab3A−/− cell, respectively. C, average distributions for wild-type (^) and Rab3A−/− (▪) cells, generated by obtaining the mean across cells of the percentage in each bin. D, mean percentage of spikes with foot amplitude in the first bin, < 2 pA. *P < 0.005, Student's t test, n = 31 wild-type cells, 32 Rab3A−/− cells.
Figure 8
Figure 8. Increased occurrence of long duration feet in Rab3A−/− chromaffin cells
A and B, frequency histograms of pre-spike foot durations, for feet < 2 pA, in the same wild-type cell and Rab3A−/− cell shown in Fig. 6A and B. Outliers, foot durations ≥ 4 ms, are indicated in gray. C, examples of amperometric spikes with feet < 2 pA and ≥ 4 ms. Foot parameters 1.8 pA, 4.1 ms (a); 1.9 pA, 9.4 ms (b); and 1.9 pA, 14.5 ms (c).
Figure 9
Figure 9. Rab3A−/− chromaffin cells have higher percentages of small amplitude pre-spike feet with long durations
A and B, frequency histograms for percentage of feet that are duration outliers, wild-type cells and Rab3A−/− cells, respectively. For each cell, the percentage of duration outliers was determined by counting the number of feet with < 2 pA that had durations ≥ than 4 ms, and dividing by the total number of feet < 2 pA. The value of 4 ms was arbitrarily chosen based on examination of foot duration histograms of individual wild-type and Rab3A−/− cells, and determination that for the majority of histograms, there were no values above 4 ms. Only cells with at least 14 feet < 2 pA were included in analysis. The two groups are statistically different, P < 0.05, Mann–Whitney U test; P < 0.05, Kolmogorov–Smirnov. n = 20 wild-type cells, 29 Rab3A−/− cells.
Figure 10
Figure 10. The effect of fusion pore behaviour on mEPCs and amperometric currents (IAmp)
A, a large diameter fusion pore, open for a brief time (shaded area), produces a normal mEPC. The fusion pore/vesicle cartoons below show that when the fusion pore closes, some transmitter remains in the vesicle. B, idealized amperometric current (IAmp) produced by a fusion pore with the same relative characteristics as in A. C, a small diameter fusion pore, open for a long time, produces a slowly rising mEPC with a wide half-width. A greater fraction of the vesicle contents is released than in A. D, idealized amperometric current produced by a fusion pore with the same relative characteristics as in C. Note that for IAmp, the fusion pore determines the shape of the pre-spike foot. The amount of catecholamine released during the foot is a small fraction of the total contained in the vesicle. Therefore changes in foot characteristics do not necessarily affect those of the main spike, when the major part of the vesicle content is released through a wide fusion pore or full collapse fusion.

Similar articles

Cited by

References

    1. Albillos A, Dernick G, Horstmann H, Almers W, Alvarez de Toledo G, Lindau M. The exocytotic event in chromaffin cells revealed by patch amperometry. Nature. 1997;389:509–512. - PubMed
    1. Ales E, Tabares L, Poyato JM, Valero V, Lindau M, Alvarez de Toledo G. High calcium concentrations shift the mode of exocytosis to the kiss-and-run mechanism. Nat Cell Biol. 1999;1:40–44. - PubMed
    1. Alkadhi KA. Giant miniature end-plate potentials at the untreated and emetine-treated frog neuromuscular junction. J Physiol. 1989;412:475–491. - PMC - PubMed
    1. Ardiles AO, Gonzalez-Jamett AM, Maripillan J, Naranjo D, Caviedes P, Cardenas AM. Calcium channel subtypes differentially regulate fusion pore stability and expansion. J Neurochem. 2007;103:1574–1581. - PubMed
    1. Becherer U, Guatimosim C, Betz W. Effects of staurosporine on exocytosis and endocytosis at frog motor nerve terminals. J Neurosci. 2001;21:782–787. - PMC - PubMed

Publication types

Substances

LinkOut - more resources