. 2008 Nov;57(11):3034-44.
doi: 10.2337/db07-1802. Epub 2008 Jun 30.

Cytokine-induced beta-cell death is independent of endoplasmic reticulum stress signaling

Affiliations

Cytokine-induced beta-cell death is independent of endoplasmic reticulum stress signaling

Mia C Akerfeldt et al. Diabetes. 2008 Nov.

Abstract

Objective: Cytokines contribute to beta-cell destruction in type 1 diabetes. Endoplasmic reticulum (ER) stress-mediated apoptosis has been proposed as a mechanism for beta-cell death. We tested whether ER stress was necessary for cytokine-induced beta-cell death and also whether ER stress gene activation was present in beta-cells of the NOD mouse model of type 1 diabetes.

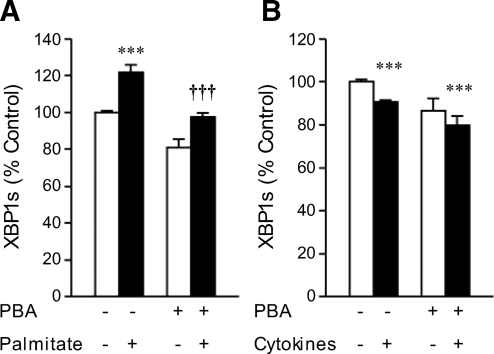
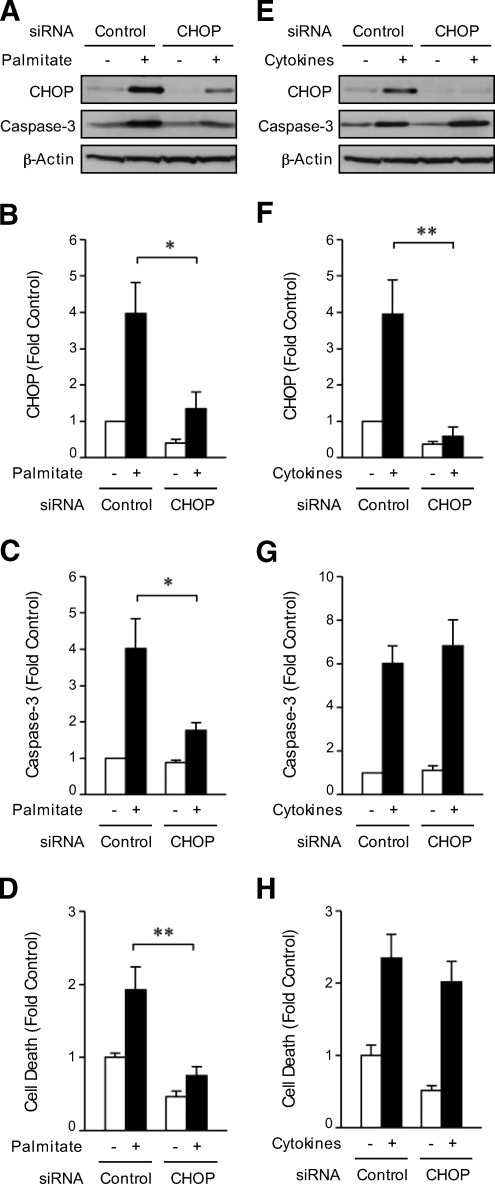
Research design and methods: INS-1 beta-cells or rat islets were treated with the chemical chaperone phenyl butyric acid (PBA) and exposed or not to interleukin (IL)-1beta and gamma-interferon (IFN-gamma). Small interfering RNA (siRNA) was used to silence C/EBP homologous protein (CHOP) expression in INS-1 beta-cells. Additionally, the role of ER stress in lipid-induced cell death was assessed.

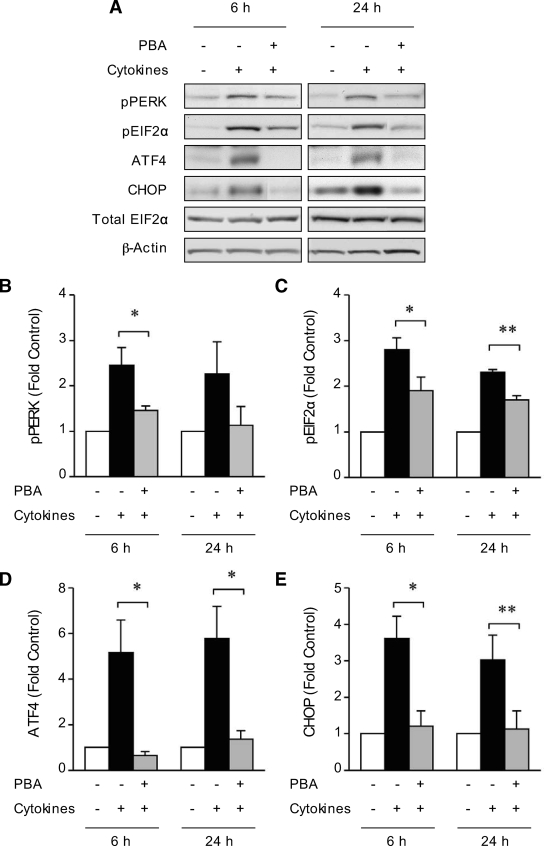
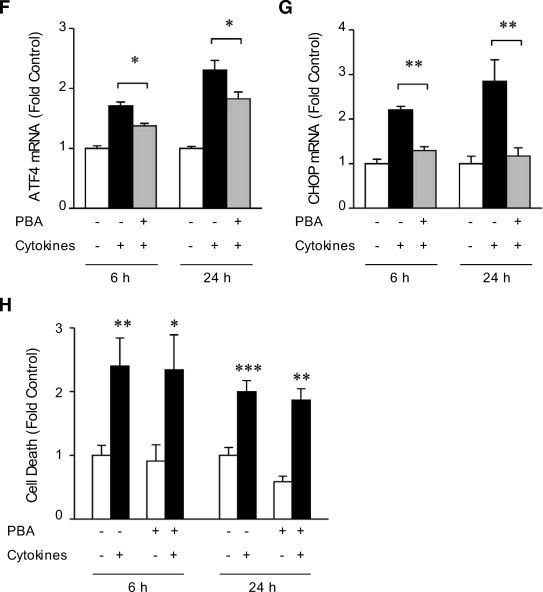
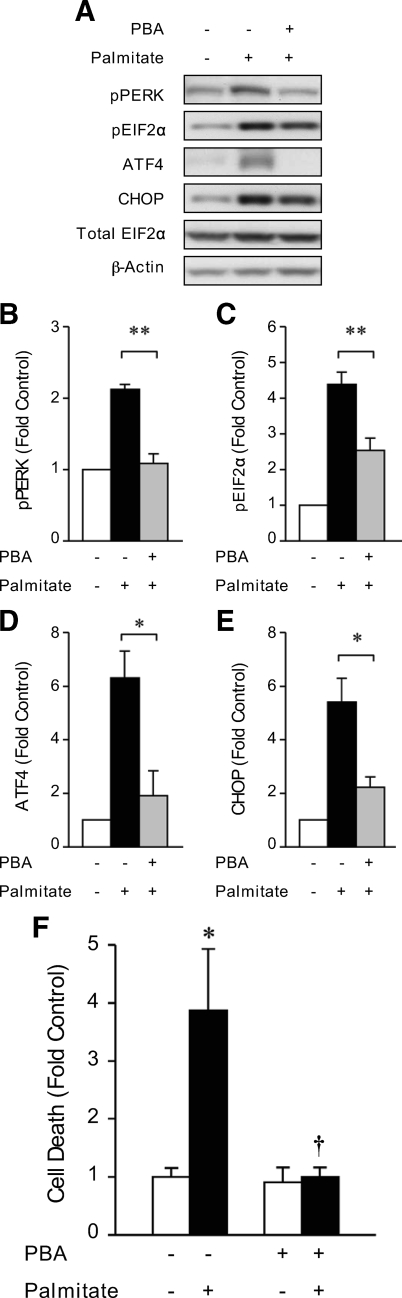
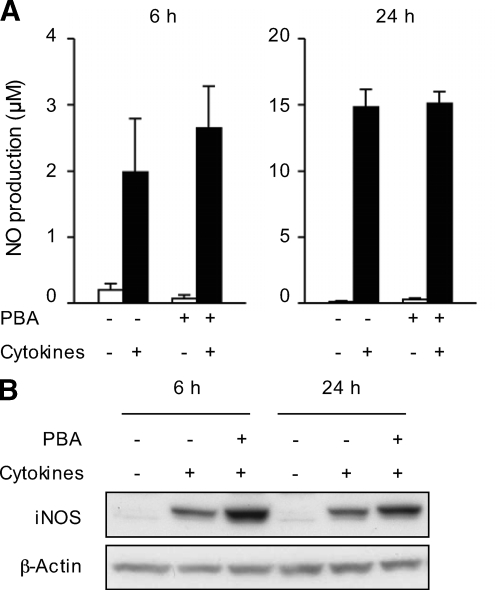
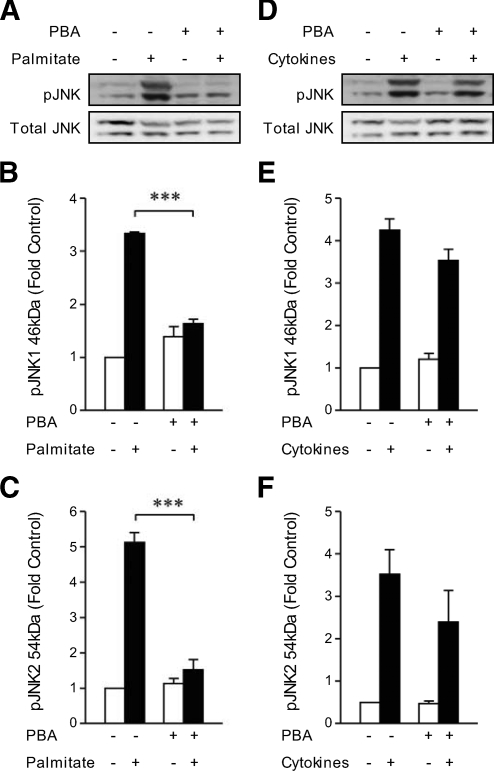
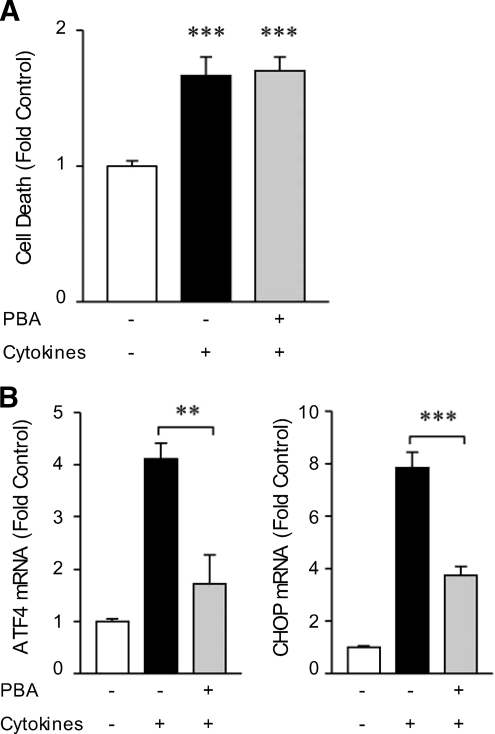
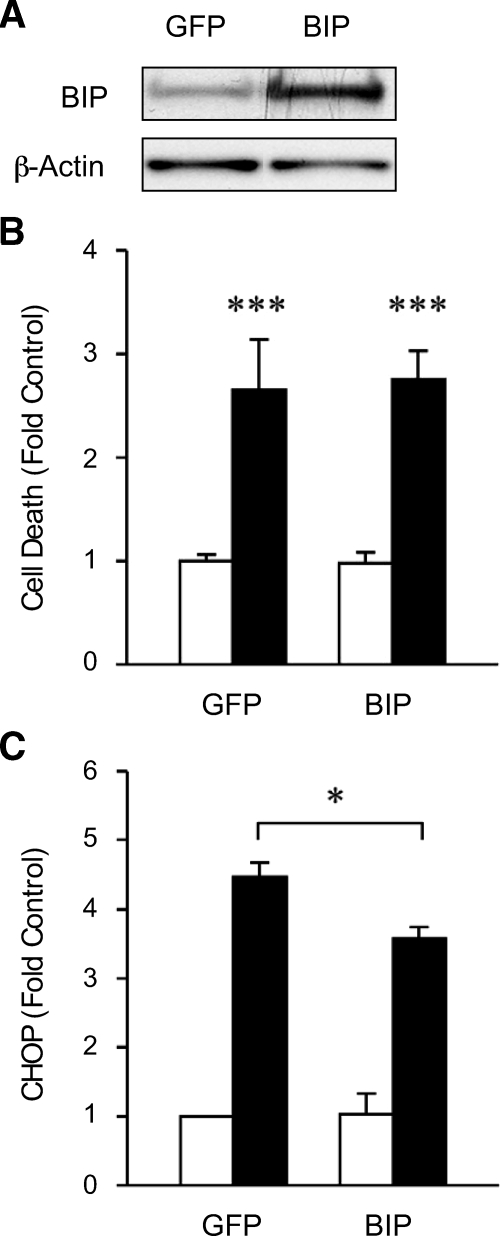
Results: Cytokines and palmitate triggered ER stress in beta-cells as evidenced by increased phosphorylation of PKR-like ER kinase (PERK), eukaryotic initiation factor (EIF)2alpha, and Jun NH(2)-terminal kinase (JNK) and increased expression of activating transcription factor (ATF)4 and CHOP. PBA treatment attenuated ER stress, but JNK phosphorylation was reduced only in response to palmitate, not in response to cytokines. PBA had no effect on cytokine-induced cell death but was associated with protection against palmitate-induced cell death. Similarly, siRNA-mediated reduction in CHOP expression protected against palmitate- but not against cytokine-induced cell death. In NOD islets, mRNA levels of several ER stress genes were reduced (ATF4, BiP [binding protein], GRP94 [glucose regulated protein 94], p58, and XBP-1 [X-box binding protein 1] splicing) or unchanged (CHOP and Edem1 [ER degradation enhancer, mannosidase alpha-like 1]).

Conclusions: While both cytokines and palmitate can induce ER stress, our results suggest that, in contrast to lipoapoptosis, the PERK-ATF4-CHOP ER stress-signaling pathway is not necessary for cytokine-induced beta-cell death.


Figures

FIG. 1.
FIG. 1.
The chemical chaperone PBA reduces cytokine activation of genes involved in ER stress in INS-1 cells but does not protect against cytokine-induced cell death. INS-1 cells grown in RPMI-1640 were pretreated in the absence or presence of PBA (2.5 mmol/l) for 24 h and then cultured in combination with IL-1β (50 units/ml) and IFN-γ (100 units/ml) for 6 or 24 h as indicated. A: Western blot analysis comparing changes in PERK and EIF2α phosphorylation (p) and expression of ATF4 and CHOP. Total EIF2α and β-actin protein served as loading controls. pPERK (B), pEIF2α (C), ATF4 (D), and CHOP (E) bands were quantified by densitometry and are expressed as fold change compared with control. Results are means ± SEM determined from three to four experiments. *P < 0.05, **P < 0.01 for PBA + cytokine-treated versus control cytokine-treated INS-1 cells at the same time point. ATF4 (F) and CHOP (G) mRNA levels. Total RNA was extracted and analyzed by real-time RT-PCR. Results are means ± SEM determined from three experiments performed in triplicate or quadruplicate and are expressed as fold-change of mRNA levels in control INS-1 cells. *P < 0.05, **P < 0.01 for PBA + cytokine-treated versus control cytokine-treated INS-1 cells at the same time point. H: Cell death was measured using a cell death detection ELISA. Results are means ± SEM determined from three experiments performed in triplicate and are expressed as fold change compared with control untreated INS-1 cells at each time point. *P < 0.05, **P < 0.01, ***P < 0.001 versus control untreated INS-1 cells at the same time point.
FIG. 1.
FIG. 1.
The chemical chaperone PBA reduces cytokine activation of genes involved in ER stress in INS-1 cells but does not protect against cytokine-induced cell death. INS-1 cells grown in RPMI-1640 were pretreated in the absence or presence of PBA (2.5 mmol/l) for 24 h and then cultured in combination with IL-1β (50 units/ml) and IFN-γ (100 units/ml) for 6 or 24 h as indicated. A: Western blot analysis comparing changes in PERK and EIF2α phosphorylation (p) and expression of ATF4 and CHOP. Total EIF2α and β-actin protein served as loading controls. pPERK (B), pEIF2α (C), ATF4 (D), and CHOP (E) bands were quantified by densitometry and are expressed as fold change compared with control. Results are means ± SEM determined from three to four experiments. *P < 0.05, **P < 0.01 for PBA + cytokine-treated versus control cytokine-treated INS-1 cells at the same time point. ATF4 (F) and CHOP (G) mRNA levels. Total RNA was extracted and analyzed by real-time RT-PCR. Results are means ± SEM determined from three experiments performed in triplicate or quadruplicate and are expressed as fold-change of mRNA levels in control INS-1 cells. *P < 0.05, **P < 0.01 for PBA + cytokine-treated versus control cytokine-treated INS-1 cells at the same time point. H: Cell death was measured using a cell death detection ELISA. Results are means ± SEM determined from three experiments performed in triplicate and are expressed as fold change compared with control untreated INS-1 cells at each time point. *P < 0.05, **P < 0.01, ***P < 0.001 versus control untreated INS-1 cells at the same time point.
FIG. 2.
FIG. 2.
PBA treatment protects against palmitate-induced ER stress and cell death in INS-1 cells. INS-1 cells grown in RPMI-1640 were pretreated in the absence or presence of PBA (2.5 mmol/l) for 24 h and then cultured in combination with 0.4 mmol/l palmitate coupled to 0.92% BSA for 6 h as indicated. A: Western blot analysis comparing changes in PERK and EIF2α phosphorylation (p) and expression of ATF4 and CHOP. Total EIF2α and β-actin protein served as loading controls. pPERK (B), pEIF2α (C), ATF4 (D), and CHOP (E) bands were quantified by densitometry and are expressed as fold change compared with control. Results are means ± SEM determined from three to four experiments. *P < 0.05, **P < 0.01 for PBA + palmitate-treated versus control palmitate-treated INS-1 cells. F: Cell death was measured using a cell death detection ELISA. Results are means ± SEM determined from three experiments performed in triplicate and are expressed as fold change compared with control. *P < 0.05 for control palmitate-treated versus control untreated INS-1 cells, †P < 0.05 for PBA + palmitate-treated versus control palmitate-treated INS-1 cells.
FIG. 3.
FIG. 3.
PBA treatment does not lower cytokine-induced iNOS expression or NO production in INS-1 cells. INS-1 cells were treated with PBA (2.5 mmol/l) for 24 h and then cultured in combination with IL-1β (50 units/ml) and IFN-γ (100 units/ml) for 6 or 24 h as indicated. A: Medium was taken to determine levels of NO production by the Griess reaction. Results are means ± SEM. n = 5 in each group. B: Western blot analysis comparing changes in iNOS expression. Representative images are shown from two experiments.
FIG. 4.
FIG. 4.
Palmitate activates, whereas cytokines reduce, XBP1 splicing in INS-1 cells. PBA treatment lowers palmitate-induced XBP1 splicing. INS-1 cells were pretreated in the absence or presence of PBA (2.5 mmol/l) for 24 h and then cultured for 6 h in combination with the absence (□) or presence (▪) of either 0.4 mmol/l palmitate coupled to 0.92% BSA (A), or IL-1β (50 units/ml) and IFN-γ (100 units/ml) (B). Total RNA was extracted and reverse transcribed. Xbp1 cDNA was amplified by PCR and digested with PstI, which cuts unprocessed Xbp1 cDNA into fragments. Processed (activated) Xbp1 cDNA lacks the restriction site and remains intact. Processed (intact) and unprocessed (cut) Xbp1 was quantified by densitometry. The value obtained for processed Xbp1 was expressed as a ratio of the total (processed + unprocessed) Xbp1 mRNA levels for each sample. These ratios are expressed as a percentage of the ratio in control INS-1 cells. Results are means ± SEM determined from three experiments performed in triplicate or quadruplicate. A: ***P < 0.001 versus control untreated INS-1 cells, †††P < 0.001 for PBA + palmitate-treated versus control palmitate-treated INS-1 cells. B: ***P < 0.001 versus control untreated INS-1 cells.
FIG. 5.
FIG. 5.
PBA treatment reduces JNK phosphorylation in response to palmitate but not in response to cytokines. INS-1 cells were pretreated in the absence or presence of PBA (2.5 mmol/l) for 24 h and then cultured for 6 h in combination with the absence or presence of 0.4 mmol/l palmitate coupled to 0.92% BSA (AC) or IL-1β (50 units/ml) and IFN-γ (100 units/ml) (DF). A and D: Western blot analysis comparing changes in JNK phosphorylation (p). Total JNK protein served as loading control. pJNK1 (46 kDa) (B and E) and pJNK2 (54 kDa) (C and F) bands were quantified by densitometry and are expressed as fold change compared with control. Results are means ± SEM determined from three experiments. ***P < 0.001 for PBA + palmitate-treated versus control palmitate-treated INS-1 cells.
FIG. 6.
FIG. 6.
Attenuation of ER stress with PBA does not protect against cytokine-induced cell death in primary rat islets. Isolated rat islets were pretreated in the absence or presence of PBA (2.5 mmol/l) for 24 h and then cultured in combination with the IL-1β (50 units/ml) and IFN-γ (100 units/ml) for 16 h. A: Cell death was measured using a cell death detection ELISA. Results are means ± SEM determined from three experiments performed in triplicate and are expressed as fold change compared with control untreated islets. ***P < 0.001 versus control untreated islets. B: Total RNA was extracted from islets and ATF4 and CHOP mRNA levels analyzed by real-time RT-PCR. Results are means ± SEM determined from four experiments performed in duplicate and are expressed as fold change of mRNA levels in control untreated islets. **P < 0.01, ***P < 0.001 for PBA + cytokine-treated versus control cytokine-treated islets.
FIG. 7.
FIG. 7.
BiP overexpression does not protect INS-1 cells from cytokine-induced cell death. INS-1 cells were transfected with an expression vector encoding for BIP (pBIP-DEST40) or GFP (pmaxGFP) by lipofectamine. A: Western blot analysis of BiP in GFP- and BiP-overexpressing INS-1 cells. β-Actin served as a loading control. B: Effect of BiP overexpression on cytokine-induced cell death in INS-1 cells. BiP- and GFP-overexpressing INS-1 cells were cultured in the absence (□) or presence (▪) of IL-1β (50 units/ml) and IFN-γ (100 units/ml). Cell death was measured using a cell death detection ELISA. Results are means ± SEM determined from three experiments performed in triplicate. ***P < 0.001 versus untreated GFP-overexpressing cells. C: Effect of BiP overexpression on cytokine-induced CHOP expression in INS-1 cells. Western blots analyzing CHOP protein were quantified by densitometry and are expressed as fold change compared with untreated GFP-overexpressing cells. Results are means ± SEM determined from three experiments. *P < 0.05 for cytokine-treated BiP-overexpressing cells versus cytokine-treated GFP-overexpressing cells.
FIG. 8.
FIG. 8.
siRNA-mediated silencing of CHOP expression in INS-1 cells protects against palmitate- but not against cytokine-induced cell death. INS-1 cells were transfected with CHOP ON-TARGETplus SMARTpool siRNA or negative control nontargeting siRNA using DharmaFECT Transfection Reagent and treated with 0.4 mmol/l palmitate coupled to 0.92% BSA (AD) or IL-1β (50 units/ml) and IFN-γ (100 units/ml) (EH). A and E: Western blot analysis of CHOP and cleaved caspase-3. β-Actin served as a loading control. CHOP (B and F) and cleaved caspase-3 bands (C and G) were quantified by densitometry and are expressed as fold change compared with untreated control siRNA. Results are means ± SEM, n = 5–6 in each group. *P < 0.05, **P < 0.01 versus treated control siRNA. D and H: Cell death was measured using a cell death detection ELISA. Results are means ± SEM, n = 6–7 in each group. **P < 0.01 versus palmitate-treated control siRNA.

References

    1. Eizirik DL, Mandrup-Poulsen T: A choice of death: the signal-transduction of immune-mediated beta-cell apoptosis. Diabetologia 44: 2115–2133, 2001 - PubMed
    1. Rabinovitch A, Suarez-Pinzon WL: Role of cytokines in the pathogenesis of autoimmune diabetes mellitus. Rev Endocr Metab Disord 4: 291–299, 2003 - PubMed
    1. Thomas HE, Darwiche R, Corbett JA, Kay TW: Interleukin-1 plus γ-interferon–induced pancreatic β-cell dysfunction is mediated by β-cell nitric oxide production. Diabetes 51: 311–316, 2002 - PubMed
    1. Corbett JA, McDaniel ML: Reversibility of interleukin-1 beta-induced islet destruction and dysfunction by the inhibition of nitric oxide synthase. Biochem J 299: 719–724, 1994 - PMC - PubMed
    1. Cnop M, Welsh N, Jonas JC, Jorns A, Lenzen S, Eizirik DL: Mechanisms of pancreatic β-cell death in type 1 and type 2 diabetes: many differences, few similarities. Diabetes 54: S97–S107, 2005 - PubMed

Publication types

MeSH terms