. 2008 Jul 7;205(7):1621-34.
doi: 10.1084/jem.20071365.

Clearance of influenza virus from the lung depends on migratory langerin+CD11b- but not plasmacytoid dendritic cells

Affiliations

Clearance of influenza virus from the lung depends on migratory langerin+CD11b- but not plasmacytoid dendritic cells

Corine H GeurtsvanKessel et al. J Exp Med. .

Abstract

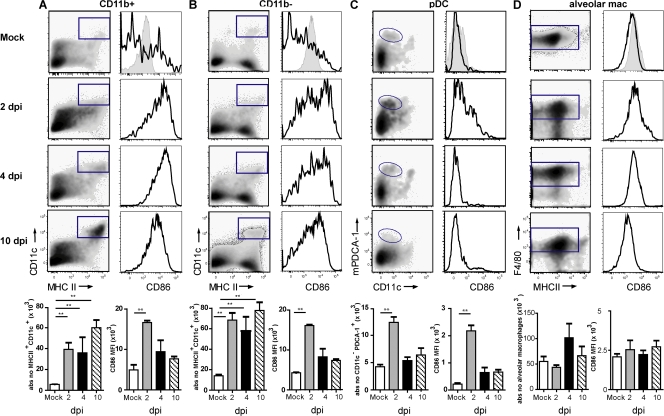
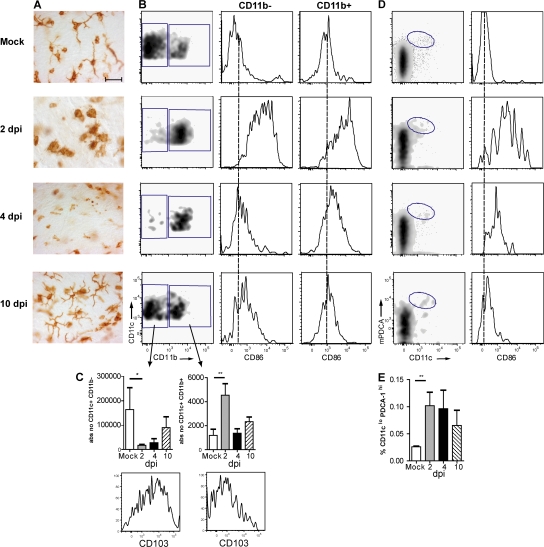
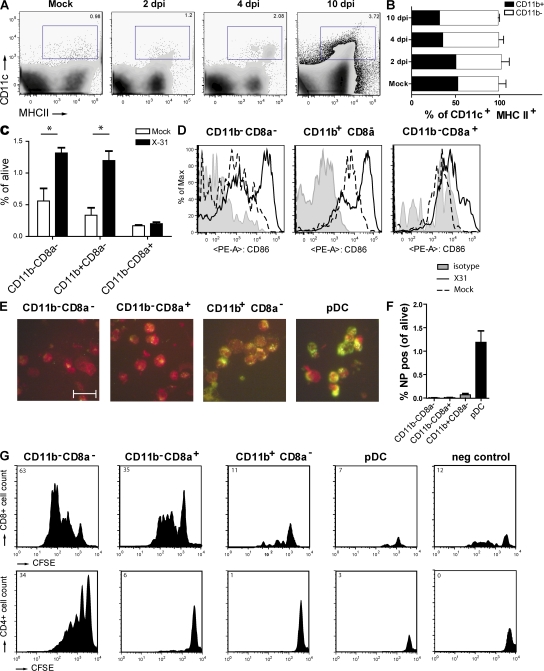
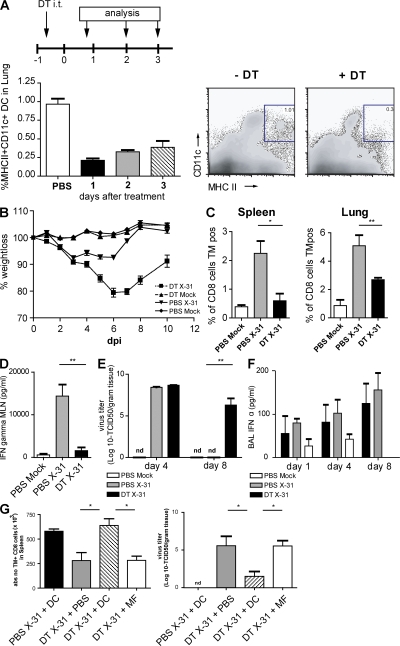
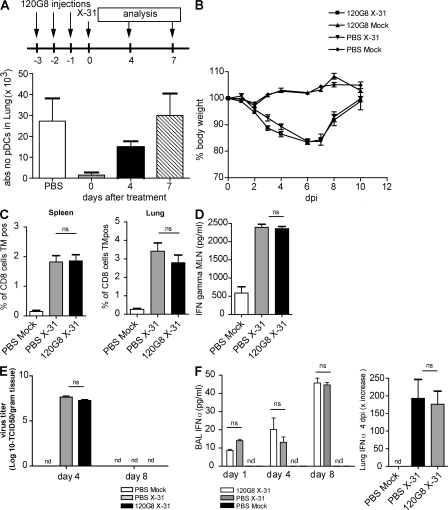
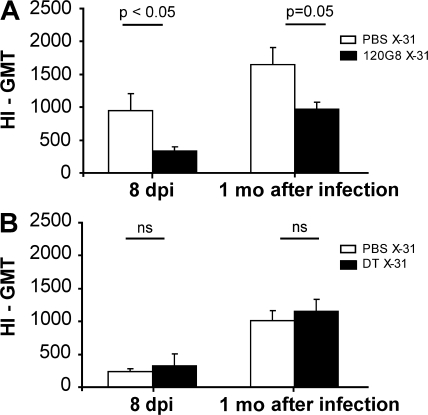
Although dendritic cells (DCs) play an important role in mediating protection against influenza virus, the precise role of lung DC subsets, such as CD11b- and CD11b+ conventional DCs or plasmacytoid DCs (pDCs), in different lung compartments is currently unknown. Early after intranasal infection, tracheal CD11b-CD11chi DCs migrated to the mediastinal lymph nodes (MLNs), acquiring co-stimulatory molecules in the process. This emigration from the lung was followed by an accumulation of CD11b+CD11chi DCs in the trachea and lung interstitium. In the MLNs, the CD11b+ DCs contained abundant viral nucleoprotein (NP), but these cells failed to present antigen to CD4 or CD8 T cells, whereas resident CD11b-CD8+ DCs presented to CD8 cells, and migratory CD11b-CD8- DCs presented to CD4 and CD8 T cells. When lung CD11chi DCs and macrophages or langerin+CD11b-CD11chi DCs were depleted using either CD11c-diphtheria toxin receptor (DTR) or langerin-DTR mice, the development of virus-specific CD8+ T cells was severely delayed, which correlated with increased clinical severity and a delayed viral clearance. 120G8+ CD11cint pDCs also accumulated in the lung and LNs carrying viral NP, but in their absence, there was no effect on viral clearance or clinical severity. Rather, in pDC-depleted mice, there was a reduction in antiviral antibody production after lung clearance of the virus. This suggests that multiple DCs are endowed with different tasks in mediating protection against influenza virus.


Figures

Figure 1.
Figure 1.
Number and surface phenotype of mouse lung CD11b+ and CD11b DCs, pDCs, and alveolar macrophages after influenza infection. Populations were gated as shown in Fig. S2 (available at http://www.jem.org/cgi/content/full/jem.20071365/DC1) and as indicated by the gates in the left column of each panel. (A) CD11b+ DCs significantly increased after infection and remained increased up to 10 dpi (left). CD86 expression was plotted in histograms (right), with MFI shown in the graph (bottom). (B) The increase in CD11b DCs is demonstrated in flow cytometric plots (left), with absolute numbers shown in the graph (bottom). CD86 expression was up-regulated and plotted as MFI (C, bottom). pDCs increased significantly at 2 dpi and then returned to baseline. Recruitment of pDCs was accompanied by up-regulation of CD86 (right). (D) Alveolar macrophages slightly increased in number, but CD86 expression was not increased. Gray histograms represent isotype controls and were measured at 4 dpi. The values are representative of five mice per group and are expressed as mean ± SEM. Similar results were obtained from at least three separate experiments. *, P < 0.05; **, P < 0.01.
Figure 2.
Figure 2.
DC subtypes in tracheal tissue after influenza infection. (A) Tracheal whole mount sections stained for MHCII expression were performed at various days after infection. Bar, 35 μm. (B) Flow cytometric analysis of DCs in tracheal cell suspensions stained for CD45, CD11c, CD11b, F4/80, and CD103. CD11c+ cells contained two subsets, one CD11b and the other CD11b+. Histograms represent CD86 expression on both subsets. The dotted lines indicate MFI in a mock situation. (C) Absolute numbers of the two subsets after influenza infection expressed as mean values ± SEM. *, P < 0.05; **, P < 0.01. Histograms represent CD103 expression on both subsets. (D) pDCs were identified as CD11cintPDCA-1+ cells representing a minor percentage of CD45+ leukocytes in tracheal cell suspensions and only temporarily expressing CD86 (histogram). (E) Absolute number of pDCs at various days after infection expressed as mean values ± SEM. **, P < 0.01.
Figure 3.
Figure 3.
DC subsets in MLNs after influenza virus infection. (A) Kinetics of CD11c+MHCII+ DCs demonstrating an almost fourfold increase after infection. Percentages of living cells are shown. (B) Expression of CD11b by CD11c+ DCs gated in A. The values are representative of five mice per group and are expressed as mean ± SEM. Similar results were obtained from separate experiments. (C) CD8α expression on different DC subsets was demonstrated in combination with CD11b, with percentages of the different populations plotted in the graph. The values are representative of five mice per group and are expressed as mean ± SEM. Similar results were obtained from separate experiments. *, P < 0.05. (D) CD86 expression on different MLN subsets. The gray histogram represents isotype control, the dotted histogram represents mock controls, and the black histogram represents infected animals. (E) Sorted DC subsets were stained for intracellular NP. Uninfected cells stain dull red because of Evan's blue in the solution, and the green fluorescence indicates NP. Bar, 20 μm. These images are representative of one experiment out of at least five performed. (F) Flow cytometric analysis of the total detectable amount of intracellular NP in DC subsets as a percentage of total live LN cells per DC subset. The values are representative of five mice per group and are expressed as mean ± SEM. Similar results were obtained from two separate experiments. (G) Plots represent CFSE-labeled T cell proliferation 4 d after co-culture with the various sorted DC populations obtained from pooled LNs of 20 influenza-infected mice. (top) CD8+ T cells and (bottom) CD4+ T cell proliferation are shown. Numbers (top left corners) represent the percentage of cells recruited into cell division. Cell sortings with co-culture were performed three times each, and the results shown are representative plots of these experiments.
Figure 4.
Figure 4.
Infection parameters after conditional depletion of CD11chi cells in a CD11c-DTR Tg mouse model. CD11c-DTR Tg mice received an i.t. injection of DT on day −1, followed by X-31 i.n. infection. (A) Efficient depletion of lung CD11chi cells by DT treatment compared with PBS treatment. (right) Plots demonstrate flow cytometry data, and numbers indicate the percentage of live cells within each gate. (B) Body weight after influenza infection. A weight loss of 20% represents a sublethal infection. (C) Virus-specific CTL response in spleen and lung as measured by Flupeptide/H-2Db tetramer (TM) staining. (D) IFN-γ levels in supernatants of MLN cell cultures restimulated with anti-CD3 antibody. (E) Viral titers measured in lung tissue after influenza X-31 infection. Virus is normally completely cleared at 8 dpi. nd, nondetectable. (F) IFN-α levels in BAL fluid. (G) Adoptive transfer of wild-type DCs and alveolar macrophages into DT-treated CD11c-DTR Tg mice before viral infection. CD11c-DTR Tg mice were either treated with PBS or DT, and received either DCs or macrophages before influenza infection. Numbers of Flupeptide/H-2Db–specific CTLs in spleen suspensions (left) and viral titer in lung tissue (right) are shown. The values are representative of five mice per group and are expressed as mean ± SEM. Similar results were obtained from at least two separate experiments. *, P < 0.05; **, P < 0.01.
Figure 5.
Figure 5.
Effect of conditional depletion of langerin+ DCs cells during influenza infection. Langerin-DTR Tg mice received an i.t. injection of DT on day −1, followed by X-31 i.n. infection. (A) Efficient depletion of MHCII+CD11c DCs in lung after DT treatment. Numbers indicate percentages of live cells within the gate. (B) Body weight after influenza infection. A weight loss of >20% represents a sublethal infection. (C) Virus-specific CTL response in spleen and lung measured by Flupeptide/H-2Db tetramer (TM) staining. (D) Viral titers measured in lung tissue after influenza X-31 infection. Virus is normally cleared completely at 8 dpi. The values are representative of five mice per group and are expressed as mean ± SEM. Similar results were obtained from at least two separate experiments. *, P < 0.05; **, P < 0.01. nd, nondetectable.
Figure 6.
Figure 6.
Infection parameters after influenza in mice depleted of pDCs. Mice received three i.p. injections of the depleting mAb 120G8 before infection with influenza on day 0. (A) Efficient depletion of lung pDCs after 3 d of 120G8 i.p. treatment compared with PBS treatment. (B) Body weight after infection. (C) Virus-specific CTL responses in spleen and lung cell suspensions, as measured by Flupeptide/H-2Db tetramer staining. (D) IFN-γ levels in supernatants of MLN cell cultures restimulated with anti-CD3 antibody. (E) Viral titers in lung after influenza infection. (F) IFN-α levels in BAL fluid. The values are representative of five mice per group and are expressed as mean ± SEM. Similar results were obtained from at least two separate experiments. *, P < 0.05; **, P < 0.01.
Figure 7.
Figure 7.
Virus-specific serum antibodies of influenza virus–infected mice after DC subset depletion. (A) Virus-specific antibodies in the serum of C57BL/6 mice after i.p. treatment with 120G8 depleting antibody or PBS, or (B) in the serum of CD11c-DTR mice after i.t. treatment with DT or PBS, measured at 8 dpi and 1 mo after infection. The values are representative of at least five mice per group and are expressed as geometric mean titer (GMT) of HI ± SEM. The differences in HI titer can be explained by the background of the mice. CD11c-DTR mice were F1 (BALB/c × C57BL/6) animals and developed less high viral and HI titers than the pure C57BL/6 mice that were used in 120G8 depletion experiments. Similar results were obtained from at least two separate experiments. *, P < 0.05; **, P < 0.01.

References

    1. Eichelberger, M., W. Allan, M. Zijlstra, R. Jaenisch, and P.C. Doherty. 1991. Clearance of influenza virus respiratory infection in mice lacking class I major histocompatibility complex-restricted CD8+ T cells. J. Exp. Med. 174:875–880. - PMC - PubMed
    1. Legge, K.L., and T.J. Braciale. 2005. Lymph node dendritic cells control CD8+ T cell responses through regulated FasL expression. Immunity. 23:649–659. - PubMed
    1. Pichlmair, A., O. Schulz, C.P. Tan, T.I. Naslund, P. Liljestrom, F. Weber, and C. Reis e Sousa. 2006. RIG-I-mediated antiviral responses to single-stranded RNA bearing 5′-phosphates. Science. 314:997–1001. - PubMed
    1. Tecle, T., M.R. White, and K.L. Hartshorn. 2005. Innate immunity to influenza A virus infection. Current Respir. Med. Rev. 1:127–145.
    1. Kumagai, Y., O. Takeuchi, H. Kato, H. Kumar, K. Matsui, E. Morii, K. Aozasa, T. Kawai, and S. Akira. 2007. Alveolar macrophages are the primary interferon-alpha producer in pulmonary infection with RNA viruses. Immunity. 27:240–252. - PubMed

Publication types

MeSH terms