. 2008 Jul;132(1):145-60.
doi: 10.1085/jgp.200709933.

A close association of RyRs with highly dense clusters of Ca2+-activated Cl- channels underlies the activation of STICs by Ca2+ sparks in mouse airway smooth muscle

Affiliations

A close association of RyRs with highly dense clusters of Ca2+-activated Cl- channels underlies the activation of STICs by Ca2+ sparks in mouse airway smooth muscle

Rongfeng Bao et al. J Gen Physiol. 2008 Jul.

Abstract

Ca(2+) sparks are highly localized, transient releases of Ca(2+) from sarcoplasmic reticulum through ryanodine receptors (RyRs). In smooth muscle, Ca(2+) sparks trigger spontaneous transient outward currents (STOCs) by opening nearby clusters of large-conductance Ca(2+)-activated K(+) channels, and also gate Ca(2+)-activated Cl(-) (Cl((Ca))) channels to induce spontaneous transient inward currents (STICs). While the molecular mechanisms underlying the activation of STOCs by Ca(2+) sparks is well understood, little information is available on how Ca(2+) sparks activate STICs. In the present study, we investigated the spatial organization of RyRs and Cl((Ca)) channels in spark sites in airway myocytes from mouse. Ca(2+) sparks and STICs were simultaneously recorded, respectively, with high-speed, widefield digital microscopy and whole-cell patch-clamp. An image-based approach was applied to measure the Ca(2+) current underlying a Ca(2+) spark (I(Ca(spark))), with an appropriate correction for endogenous fixed Ca(2+) buffer, which was characterized by flash photolysis of NPEGTA. We found that I(Ca(spark)) rises to a peak in 9 ms and decays with a single exponential with a time constant of 12 ms, suggesting that Ca(2+) sparks result from the nonsimultaneous opening and closure of multiple RyRs. The onset of the STIC lags the onset of the I(Ca(spark)) by less than 3 ms, and its rising phase matches the duration of the I(Ca(spark)). We further determined that Cl((Ca)) channels on average are exposed to a [Ca(2+)] of 2.4 microM or greater during Ca(2+) sparks. The area of the plasma membrane reaching this level is <600 nm in radius, as revealed by the spatiotemporal profile of [Ca(2+)] produced by a reaction-diffusion simulation with measured I(Ca(spark)). Finally we estimated that the number of Cl((Ca)) channels localized in Ca(2+) spark sites could account for all the Cl((Ca)) channels in the entire cell. Taken together these results lead us to propose a model in which RyRs and Cl((Ca)) channels in Ca(2+) spark sites localize near to each other, and, moreover, Cl((Ca)) channels concentrate in an area with a radius of approximately 600 nm, where their density reaches as high as 300 channels/microm(2). This model reveals that Cl((Ca)) channels are tightly controlled by Ca(2+) sparks via local Ca(2+) signaling.


Figures

Figure 1.
Figure 1.
Estimate of endogenous fixed Ca2+ buffer with flash photolysis of NPEGTA. (A) [Ca2+]cyto is increased throughout the cell upon flash photolysis of caged Ca2+ compound NPEGTA. The voltage-clamped cells were loaded, via patch pipettes, with variable [NPEGTA] and 50 μM fluo3, and liberation of Ca2+ from NPEGTA was accomplished by flash photolysis of 100 ms (see Materials and methods for detail). Examples of fluorescence change upon photolysis of NPEGTA at the concentrations shown on the left. The images were acquired at a rate of 20 Hz with an exposure time of 5 ms pre- and post-flash photolysis. Images shown are fluorescence before laser illumination (Frest), the first frame after the illumination (F), and their ratios, i.e., F/Frest = R, with 20% correction for bleaching. The color scale under fluorescence images denotes absolute readout in the CCD camera, and the two on the right of ratio images are for [NPEGTA] at 833 μM and at all other concentrations, respectively. (B). Relationship between [Ca2+]cyto estimated with fluo-3 and the total calcium released upon photolysis of NPEGTA, i.e., [Ca2+]ΔT. [Ca2+]cyto was calculated using results from experiments in A with Eq. 4 in the text, and [Ca2+]ΔT was determined as 52–57% of [NPEGTA] in the patch pipette given our experimental conditions (see Materials and methods). To simplify the fitting with Eq. 5, [Ca2+]cyto is plotted along the x axis and [Ca2+]ΔT along the y axis. (C). The relationship between [Ca2+]cyto and [Ca2+]ΔT in the absence of fluo-3. Data were derived based on the estimate of endogenous fixed Ca2+ buffer determined in B.
Figure 2.
Figure 2.
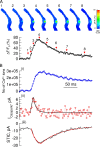
An STIC evoked by a Ca2+ spark recorded with high-speed wide-field imaging. (A) Images display the spatio-temporal evolution of a single Ca2+ spark and the trace exhibits the time course of change in fluorescence at the epicenter pixel of the spark. The cell was voltage-clamped at a membrane potential of −80 mV, i.e., EK, and the images were acquired at a rate of 333 Hz with an exposure time of 3 ms. Cytosolic Ca2+ was measured using fluo-3 (50 μM), which was introduced into the cell in the K+ form through the patch pipette. Changes in Ca2+ concentration in the images are expressed as ΔF/F0 (%) and displayed on a pseudocolor scale calibrated at the right of images. Numbers above the images correspond to the numbers in the bottom panel and indicate the time at which the images were obtained. (B) The time course of signal mass (i), its time derivative calibrated to give the underlying Ca2+ current flowing from the intracellular Ca2+ store into the cytosol, i.e., ICa(spark) (ii) for the spark shown in A, and the corresponding STIC (iii). The abscissa in B and in the bottom panel of A has the same scale. Black lines in the panel ii are fits of linear function to the rise, and of single exponential function to the decay with a time constant of 13 ms. Red lines in the bottom panel represent fits of STIC rise with I(t) = Imax(1 − exp(−t/tau)) with a time constant of 26 ms, and of its decay by single exponential function with a time constant of 91 ms. Note that the endogenous fixed Ca2+ buffer as estimated in Fig. 1 was taken into account in this and following figures' calculation of signal mass and ICa(spark).
Figure 3.
Figure 3.
Quantitative relationships between Ca2+ sparks and STICs. (A, a)Time between the onset of the STIC and the onset of its decay, designated as time to onset of decay (TTDSTIC), is close to the duration of ICa(spark). The graph displays the scatter plot and linear fit of these variables (n = 23, r = 0.879, P < 0.0001). The duration of ICa(spark) was measured as the sum of the rise time, obtained by linear fitting of the rising phase, and 2.5 times of the decay constant. (A, b) TTDSTIC is independent of the peak amplitude of ICa(spark) (n = 23, r = 0.316, P > 0.14). (B) No correlation between Ca2+ spark signal mass (SM) and STIC amplitude (r = 0.056 and P = 0.487 [n = 159] for all sparks; r = −0.053 and P = 0.551 [n = 133] for STIC-generating sparks only). To increase the number of data in this panel and panel C, a subset of Ca2+ sparks were recorded at a speed of 100 Hz, an acquisition rate sufficient to accurately estimate the signal mass since this signal sustains at its plateau for additional ∼30 ms after reaching the peak (see Fig. 2). Signal mass is expressed in term of the number of Ca2+ liberated during Ca2+ sparks. Note that the values of signal mass from a subset of Ca2+ sparks intersect with the abscissa, being designated as STIC-less sparks in the text. (C) Lack of correlation between ICa(spark) and STIC amplitude (r = −0.112 and P = 0.093 [n = 159] for all sparks; r = −0.248 and P = 0.004 [n = 133] for STIC-generating sparks only). This analysis pools data from two sets of Ca2+ sparks. For one set, ICa(spark)s were estimated by the first time differentiation of signal mass as shown in Fig. 2. For another one where ICa(spark)s could not be resolved by the differentiation because of low signal-noise ratio of signal mass, they were obtained by linear fitting 10–90% of the rising phase of signal mass (Inset). Though the latter approach tends to underestimate the peak amplitude of underlying ICa(spark), their correlation with STIC amplitude is not different from that when ICa(spark) was estimated with the first approach.
Figure 4.
Figure 4.
Characterization of Cl(Ca) channels using flash photolysis of NPEGTA. (A) Examples showing the response of Cl(Ca) channels to changes in [Ca2+] by flash photolysis of NPEGTA. The cells were held at −80 mV with pipette and bath solution that block K+ currents. No fluo-3 was present in the patch pipette to eliminate possible interference of Ca2+ indicator to the response of Cl(Ca) channels to [Ca2+]. [Ca2+]cyto marked on the right of the traces is estimated with the parameters of endogenous fixed Ca2+ buffer shown in Fig. 1. (B) Dose dependence of ICl(Ca) as a function of [Ca2+]. The filled circles are averaged peak currents from the sort of experiments shown in A (N = 5–12). The solid line denotes fit to the data with Hill equation, i.e.,formula imagewith n = 0.9 and EC50 = 3.3 μM.
Figure 5.
Figure 5.
Voltage dependence of STIC conductance. (A) Traces of STICs recorded at different holding potentials (Vh). Note that STICs reverse from inward to outward between −25 and −5 mV, as expected for an ECl of −15 mV in this series of experiments. (B) Relationship between mean conductance of STIC (g(STIC)) and Vh. The data were averaged across experiments (n = 9). The value at −25 mV in this panel was not included because the amplitudes of STICs are too small at this voltage for the parameter to be estimated with confidence. To test the voltage dependence of g(STIC), the values at potentials below ECl were pooled as a low voltage group and those above ECl as a high voltage group. Using analysis of variance for a general linear mixed model (Kempthorne, 1975), it was found that g(STIC) in the high voltage group is significantly greater than that in the low voltage group (P < 0.0001). Note that models were fit using restricted maximum likelihood estimation, and compliance with the distributional assumptions of the model was evaluated both with the Kolmogorov-Smirnov goodness of fit test for normality and by inspection of frequency histograms. Analyses were performed using the Mixed Procedure in the SAS 9.1.3 statistical software package.
Figure 6.
Figure 6.
Comparison between voltage dependence of g(STIC) and Po for Cl(Ca) channels. Black filled circles show g(STIC) (right ordinate) as a function of Vh based on the experiments in Fig. 5. The three colored lines show the relationship between the conductance of Cl(Ca) channels (gCl(ca), left ordinate) and voltage at a constant [Ca2+] of 1 μM (green diamond), 2.4 μM (red square), and 40 μM (blue circle) in excised inside–outside patches of Xenopus oocytes (adapted from Fig. 6 B, Kuruma and Hartzell, 2000). Since for a given patch, the unitary conductance of Cl(Ca) channels and their number should be constant across holding potentials, the curves should reflect the relationship between Po and voltage. Furthermore, since g(STIC) reaches the peak at −5 mV and gCl(Ca) lacks voltage dependence at 40 μM Ca2+, we scale the g(STIC) value at −5 mV to the gCl(Ca) at 40 μM Ca2+. It is worth noting that the relationship between g(STIC) and membrane potential follows closest to the relationship between Po and voltage at 2.4 μM [Ca2+] or greater.
Figure 7.
Figure 7.
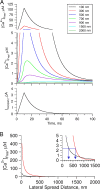
Area of Cl(Ca) channels activated by Ca2+ sparks as revealed by spatial and temporal profile of [Ca2+] derived from a simulation using measured ICa(spark). (A) Spatio-temporal profile of [Ca2+] produced by ICa(spark). Traces denote time courses of [Ca2+] at various distances from the release source with measured ICa(spark) shown in the bottom panel. The amplitude of ICa(spark), i.e., 1.2 pA as measured from averaging across the whole population of Ca2+ sparks in the present study, was adjusted (up to 3.5 pA) to compensate for the estimated endogenous fixed Ca2+ buffer with an on-rate of 8 × 10⁴ mM−1s−1. Note that to visualize better the low end of [Ca2+], values >5 μM are shown at a compressed scale. (B) Spatial profile of [Ca2+] at the peak (red solid line) and at 40 ms (black solid line) of ICa(spark). Inset is the same plot on an expanded scale in order to reveal the low end of [Ca2+]. Blue lines with arrows mark the lateral distance from Ca2+ release site where [Ca2+] reaches 2.4 μM at two time points. Note that a several hundred fold [Ca2+] gradient exists within ∼300 nm of the ICa(spark) site of origin. This demonstrates that F/F0, even if determined for a single pixel, fails to reflect the complex dynamics of the [Ca2+] generated by a Ca2+ spark.
Figure 8.
Figure 8.
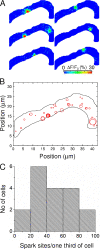
Number of spark-generating sites in airway smooth muscle cells. (A) Images shown are examples of Ca2+ sparks at their peak from a single mouse airway smooth muscle cell loaded with fluo-3 AM (5 μM) for 30 min at room temperature. Ca2+ fluorescence images were acquired at a rate of 67 Hz with an exposure of 5 ms per image. (B) A map of Ca2+ spark location and amplitude for the cell shown in A. Ca2+ sparks were recorded during ten 3-s periods for a total of 30 s. Each circle denotes the occurrence of one Ca2+ spark, and the area of the circle is proportional to the peak intensity (ΔF/F0 (%)) of the spark (not the spatial extent of the spark). (C) Histogram of number of spark-generating sites in the field of view per cell. The mean number of spark-generating sites per field of view is 36. Since approximately one third of the cell was in the field, the mean number of spark-generating sites for the entire cell is around 108.

Similar articles

Cited by

References

    1. Amberg, G.C., and L.F. Santana. 2003. Downregulation of the BK channel β1 subunit in genetic hypertension. Circ. Res. 93:965–971. - PubMed
    1. Angermann, J.E., A.R. Sanguinetti, J.L. Kenyon, N. Leblanc, and I.A. Greenwood. 2006. Mechanism of the inhibition of Ca2+-activated Cl− currents by phosphorylation in pulmonary arterial smooth muscle cells. J. Gen. Physiol. 128:73–87. - PMC - PubMed
    1. Becker, P.L., J.J. Singer, J.V. Walsh Jr., and F.S. Fay. 1989. Regulation of calcium concentration in voltage-clamped smooth muscle cells. Science. 244:211–214. - PubMed
    1. Berkefeld, H., C.A. Sailer, W. Bildl, V. Rohde, J.O. Thumfart, S. Eble, N. Klugbauer, E. Reisinger, J. Bischofberger, D. Oliver, et al. 2006. BKCa-Cav channel complexes mediate rapid and localized Ca2+-activated K+ signaling. Science. 314:615–620. - PubMed
    1. Block, B.A., T. Imagawa, K.P. Campbell, and C. Franzini-Armstrong. 1988. Structural evidence for direct interaction between the molecular components of the transverse tubule/sarcoplasmic reticulum junction in skeletal muscle. J. Cell Biol. 107:2587–2600. - PMC - PubMed

Publication types

MeSH terms