. 2009 Apr;21(4):791-802.
doi: 10.1162/jocn.2009.21055.

Motor-induced suppression of the auditory cortex

Affiliations

Motor-induced suppression of the auditory cortex

Sheye O Aliu et al. J Cogn Neurosci. 2009 Apr.

Abstract

Sensory responses to stimuli that are triggered by a self-initiated motor act are suppressed when compared with the response to the same stimuli triggered externally, a phenomenon referred to as motor-induced suppression (MIS) of sensory cortical feedback. Studies in the somatosensory system suggest that such suppression might be sensitive to delays between the motor act and the stimulus onset, and a recent study in the auditory system suggests that such MIS develops rapidly. In three MEG experiments, we characterize the properties of MIS by examining the M100 response from the auditory cortex to a simple tone triggered by a button press. In Experiment 1, we found that MIS develops for zero delays but does not generalize to nonzero delays. In Experiment 2, we found that MIS developed for 100-msec delays within 300 trials and occurs in excess of auditory habituation. In Experiment 3, we found that unlike MIS for zero delays, MIS for nonzero delays does not exhibit sensitivity to sensory, delay, or motor-command changes. These results are discussed in relation to suppression to self-produced speech and a general model of sensory motor processing and control.


Figures

Figure 1
Figure 1
1a,b. Representative M100 current dipole sources superimposed on a subject’s MR image. Left (L) and right (R) hemisphere sources are shown. Temporal region sensors were used in estimating current dipoles.
Figure 2
Figure 2
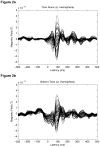
2a,b,c,d. Representative sensor waveforms for the control block (Tone Alone) and zero-delay test block (Button+Tone) in Experiment 1. Waveforms are shown separately for the left (a,b) and right hemispheres (c,d). Notice the attenuation in waveform strength during “Button+Tone” relative to “Tone Alone” in the left hemisphere. RMS values computed from temporal region sensors confirm this to be the case in 8 of 13 subjects. 2e,f,g,h. Representative source strength and RMS amplitude timecourses for the control block (Tone Alone) and zero-delay test block (Button+Tone) in Experiment 1. Timecourses are shown separately for the left (a,b) and right hemisphere (c,d). Solid lines denote the “Tone Alone” condition while the “Button+Tone” condition is denoted with broken lines. Notice the development of MIS in the left hemisphere – both source strength and RMS amplitude timecourses are suppressed in strength during “Button+Tone” relative to “Tone Alone”. This effect was not observed in the right hemisphere.
Figure 2
Figure 2
2a,b,c,d. Representative sensor waveforms for the control block (Tone Alone) and zero-delay test block (Button+Tone) in Experiment 1. Waveforms are shown separately for the left (a,b) and right hemispheres (c,d). Notice the attenuation in waveform strength during “Button+Tone” relative to “Tone Alone” in the left hemisphere. RMS values computed from temporal region sensors confirm this to be the case in 8 of 13 subjects. 2e,f,g,h. Representative source strength and RMS amplitude timecourses for the control block (Tone Alone) and zero-delay test block (Button+Tone) in Experiment 1. Timecourses are shown separately for the left (a,b) and right hemisphere (c,d). Solid lines denote the “Tone Alone” condition while the “Button+Tone” condition is denoted with broken lines. Notice the development of MIS in the left hemisphere – both source strength and RMS amplitude timecourses are suppressed in strength during “Button+Tone” relative to “Tone Alone”. This effect was not observed in the right hemisphere.
Figure 3
Figure 3
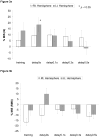
3a. Experiment 1: % Motor induced suppression (MIS) in terms of dipole strength (Q). % MIS is computed as the difference ratio between control blocks and test blocks. % MIS is shown for the right and left hemisphere during the training and test blocks. MIS in the left hemisphere exhibits a delay tuning pattern of decreasing sensitivity with increasing delay. MIS during the zero-delay condition (delay0s) is statistically significant. Error bars in the plot denote standard error. 3b. Experiment 1: % MIS in terms of RMS amplitude.. Consistent with dipole strength results, there is substantial suppression during the zero-delay condition in the left hemisphere. No significant differences were observed between the training and control blocks for either Q or RMS, suggesting that at least one block of training is necessary for suppression to develop. Error bars in the plot denote standard error.
Figure 4
Figure 4
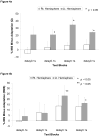
4a. Experiment 2: % MIS minus adaptation (in terms of Q). “True” suppression is shown for all training blocks in the right and left hemispheres. Since control blocks were conducted before and after the training blocks, adaptation is classified as the difference between control blocks. This effect is subtracted from % MIS. MIS is found to be in excess of adaptation for the last three training blocks in the left hemisphere. Although suppression is observed in the right hemisphere, such suppression was not found to be in excess of adaptation. Building upon Experiment 1, these results establish that MIS extends to non-zero delays. Error bars in the plot denote standard error. 4b. Experiment 2: % MIS minus adaptation (in terms of RMS).. MIS is found to be in excess of habituation in the left hemisphere – the last training block attains statistical significance and there is a strong trend in the preceding training block. While suppression was observed in the right hemisphere, this suppression did not survive correction for adaptation. In concordance with Experiment 1, there was no statistical difference between the first training block and the control blocks (for either Q or RMS), suggesting that MIS requires at least one block of training to develop. Error bars in the plot denote standard error.
Figure 5
Figure 5
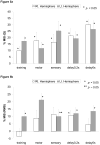
5a. Experiment 3: % MIS in terms of Q. % MIS is shown for the training blocks (averaged) and all test blocks, both in the right and left hemispheres. MIS develops for the training blocks, affirming findings in Experiment 2 that MIS extends to non-zero delays. MIS also develops for all test blocks (motor, sensory and delays), suggesting that MIS generalizes with motor act across hemispheres, across sensory stimuli induced by the motor-act, and lacks delay specificity. Error bars in the plot denote standard error. 5b. Experiment 3: % MIS in terms of RMS.. % MIS is shown for the training blocks (averaged) and all test blocks, both in the right and left hemispheres. RMS results are consistent with Q results in the left hemisphere: substantial MIS is noticeable for all test blocks. Error bars in the plot denote standard error.

References

    1. Begleiter H, Porjesz B, Yerre C, Kissin B. Evoked potential correlates of expected stimulus intensity. Science. 1973;179:814–816. - PubMed
    1. Blakemore SJ, Frith CD, Wolpert DM. Spatio-temporal prediction modulates the perception of self-produced stimuli. J Cogn Neurosci. 1999;11:551–559. - PubMed
    1. Blakemore SJ, Rees G, Frith CD. How do we predict the consequences of our actions? a functional imaging study. Neuropsychologia. 1998;36(6):521–529. - PubMed
    1. Blakemore SJ, Wolpert DM, Frith CD. Central cancellation of self-produced tickle sensation. Nature Neuroscience. 1998;1:635–640. - PubMed
    1. Blakemore SJ, Wolpert DM, Frith CD. Why can’t you tickle yourself? Neuroreport. 2000;11:R11–16. - PubMed

Publication types