. 2008 Jul 3;3(1):55-68.
doi: 10.1016/j.stem.2008.04.004.

Mesp1 coordinately regulates cardiovascular fate restriction and epithelial-mesenchymal transition in differentiating ESCs

Affiliations

Mesp1 coordinately regulates cardiovascular fate restriction and epithelial-mesenchymal transition in differentiating ESCs

R Coleman Lindsley et al. Cell Stem Cell. .

Abstract

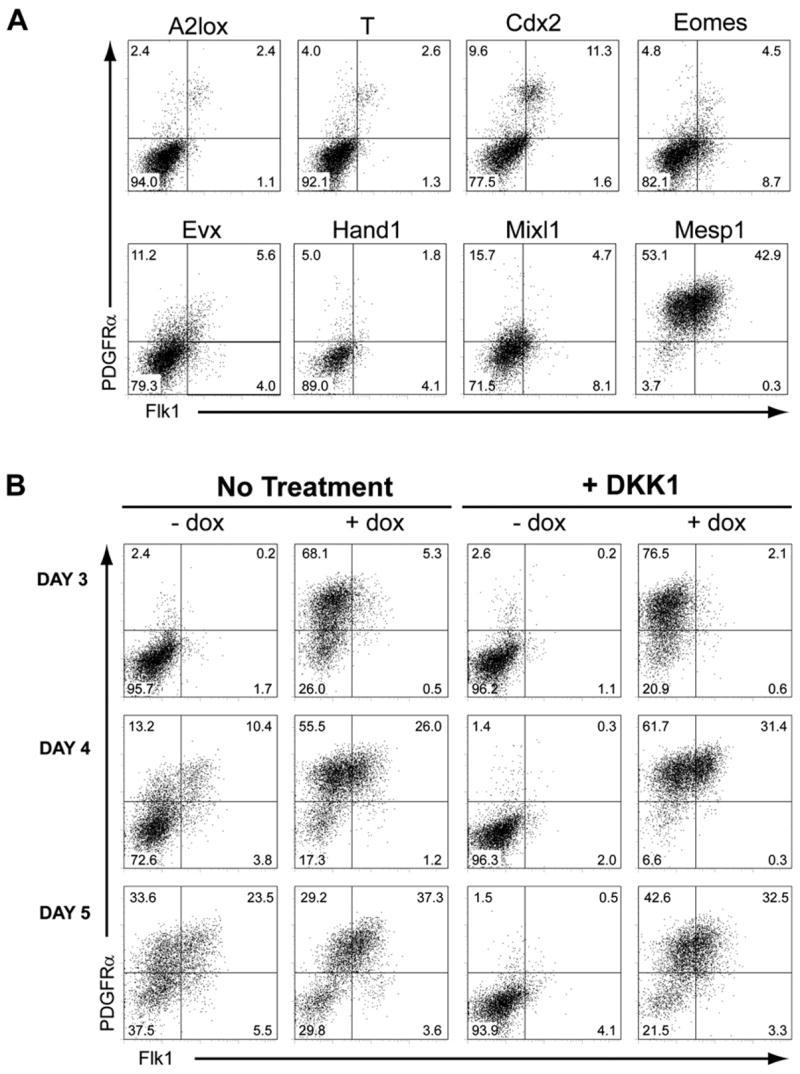
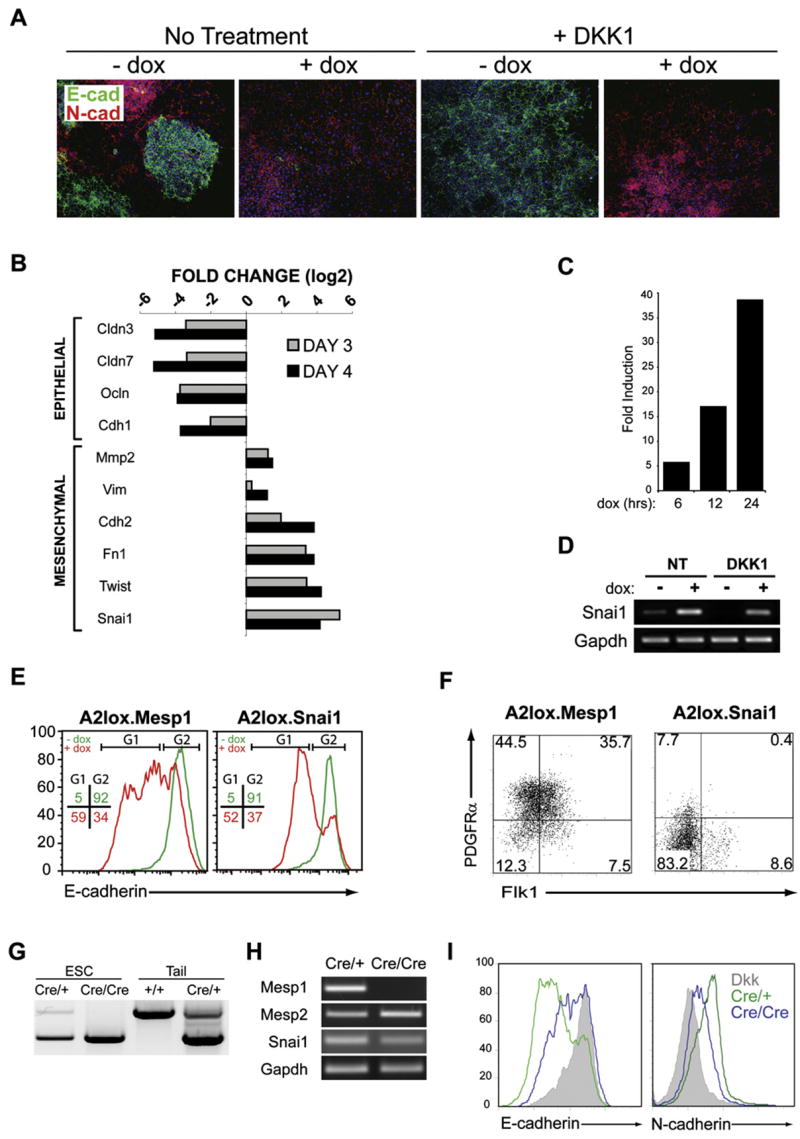
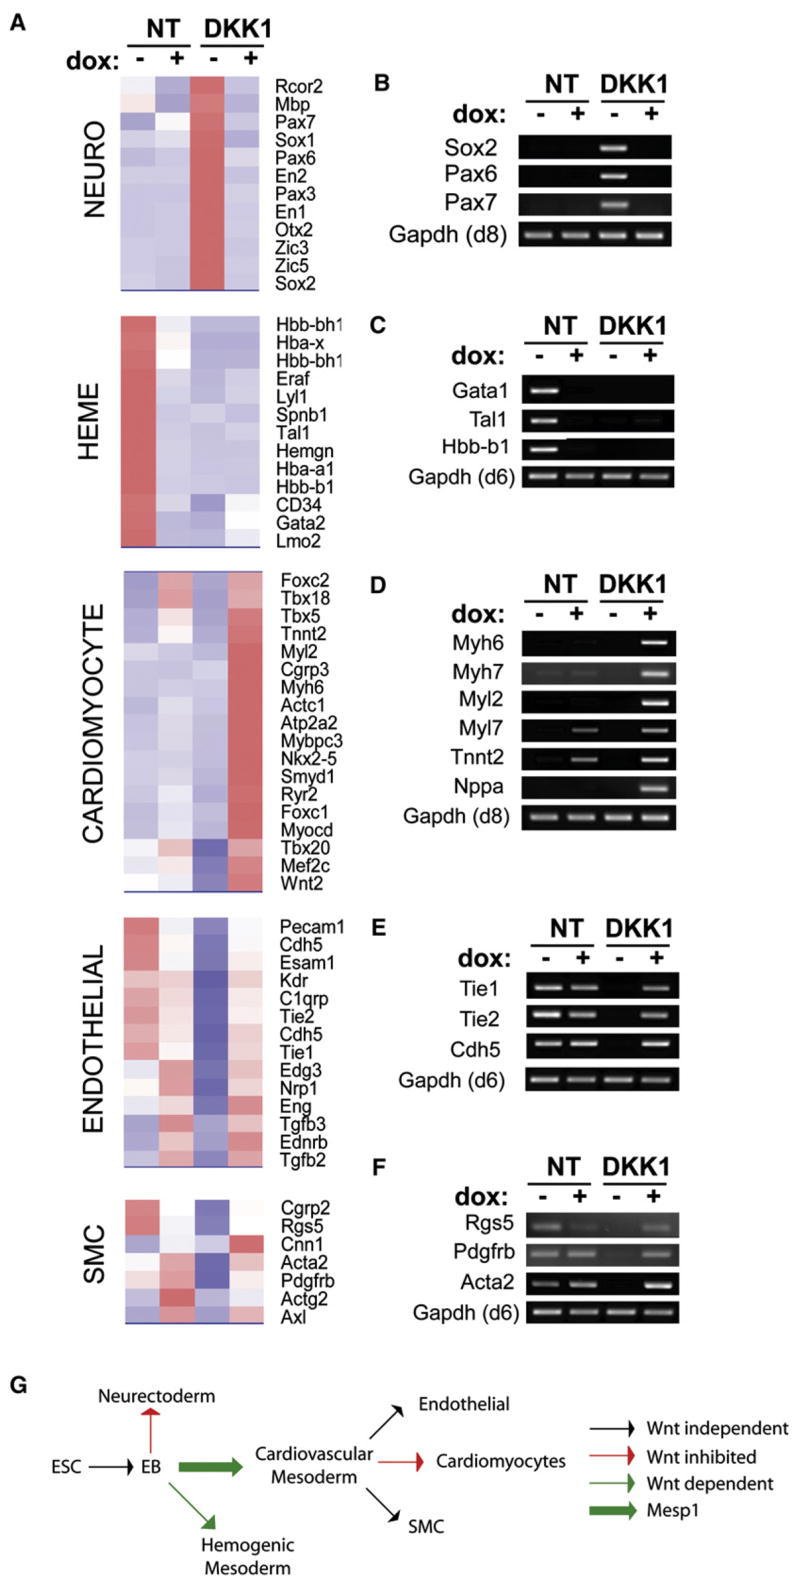
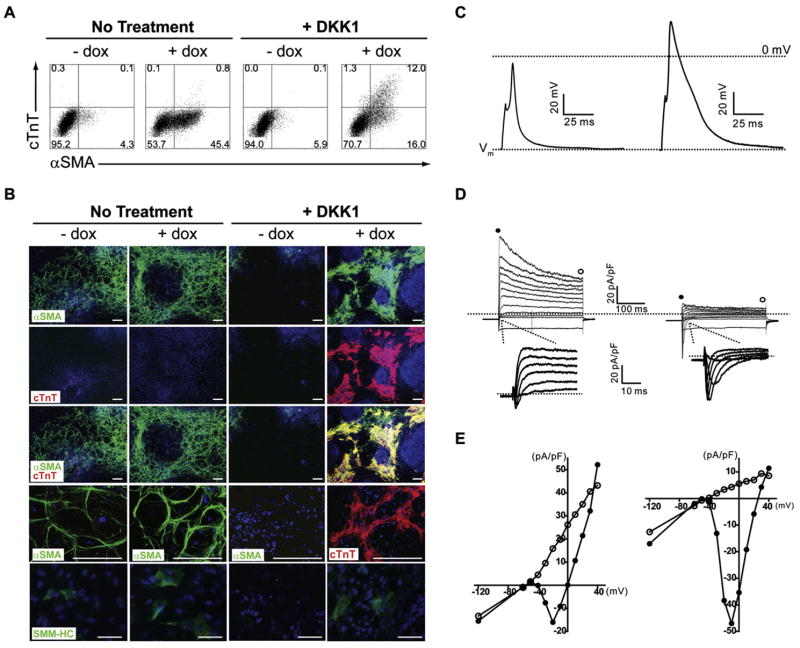
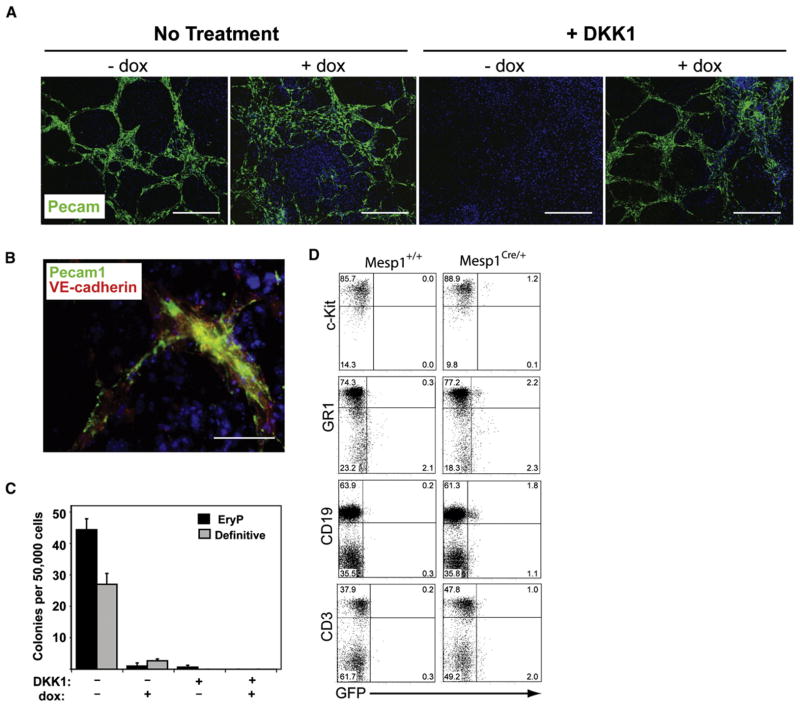
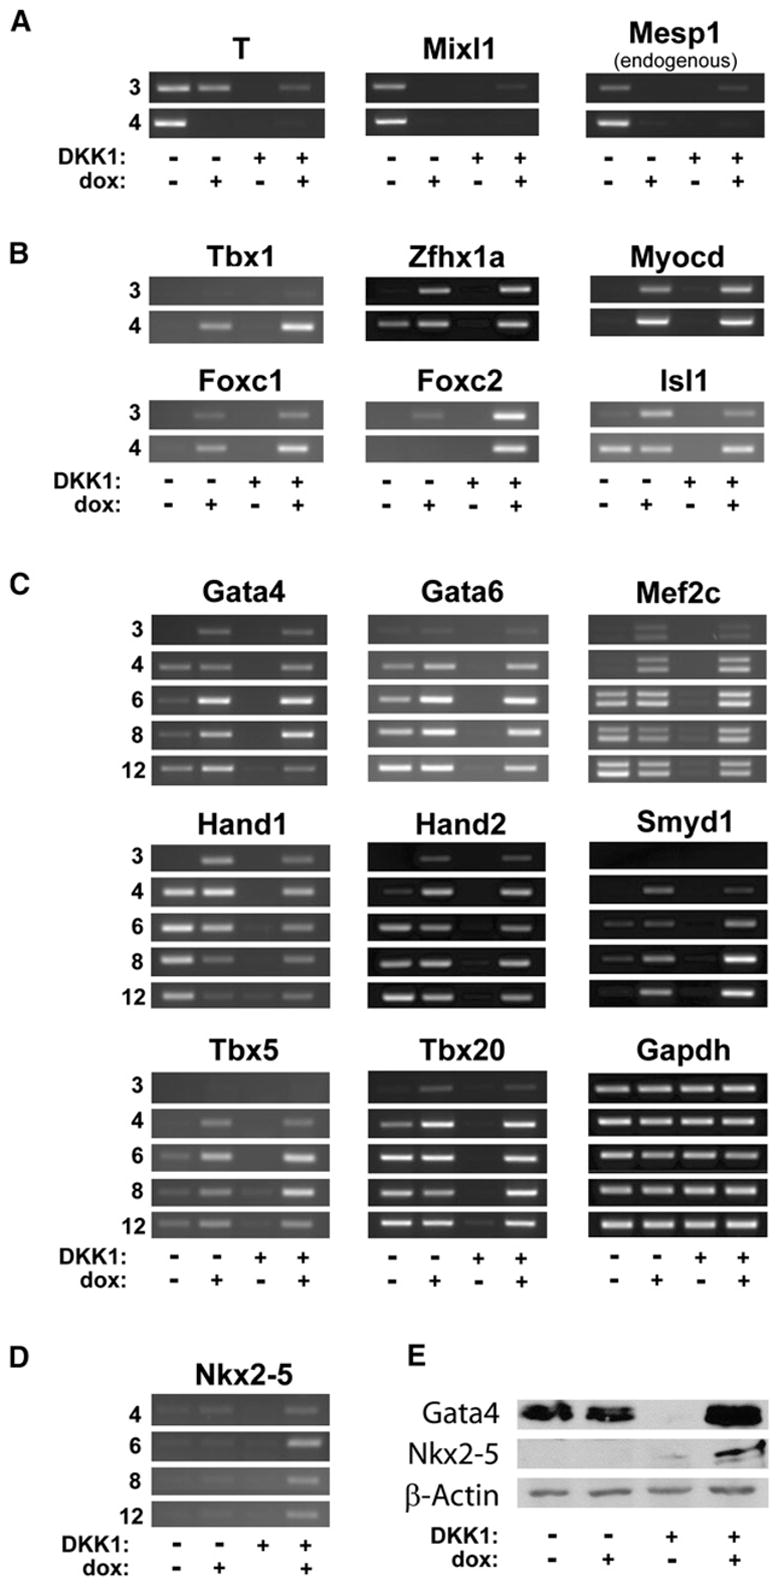
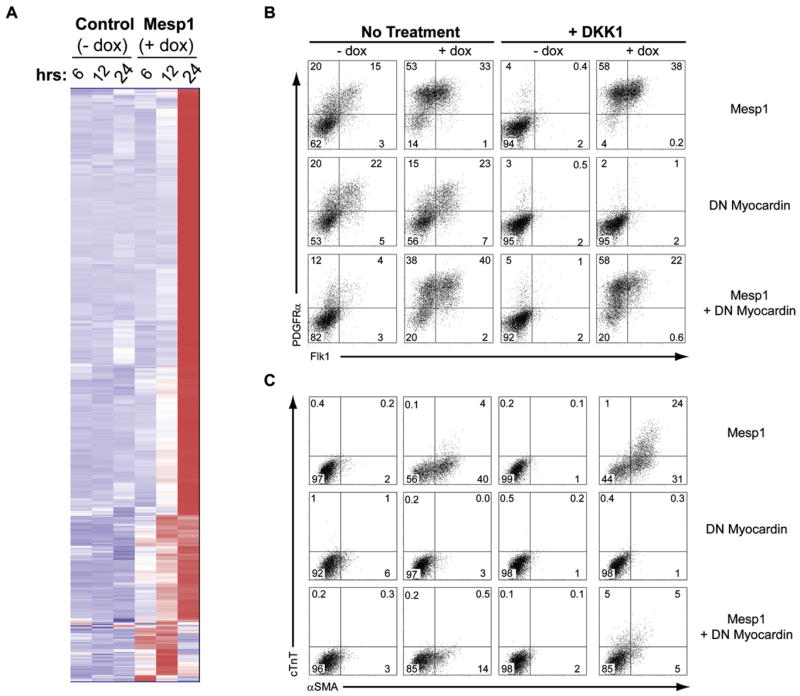
Wnt signaling is required for development of mesoderm-derived lineages and expression of transcription factors associated with the primitive streak. In a functional screen, we examined the mesoderm-inducing capacity of transcription factors whose expression was Wnt-dependent in differentiating ESCs. In contrast to many inactive factors, we found that mesoderm posterior 1 (Mesp1) promoted mesoderm development independently of Wnt signaling. Transient Mesp1 expression in ESCs promotes changes associated with epithelial-mesenchymal transition (EMT) and induction of Snai1, consistent with a role in gastrulation. Mesp1 expression also restricted the potential fates derived from ESCs, generating mesoderm progenitors with cardiovascular, but not hematopoietic, potential. Thus, in addition to its effects on EMT, Mesp1 may be capable of generating the recently identified multipotent cardiovascular progenitor from ESCs in vitro.


Figures

Figure 1
Figure 1. Mesp1 Induces Wnt-Independent Development of Flk1+ Mesoderm
(A) A2lox ESCs, or A2lox cells targeted with the indicated cDNAs, were treated with both DKK1 and dox between days 2 and 4 of differentiation. On day 4, cells were analyzed by flow cytometry for Flk1 and PDGFRα expression. Numbers indicate the percentage of live-gated cells within each quadrant. (B) A2lox.Mesp1 ESCs were differentiated in the absence (No Treatment) or presence (+ DKK1) of recombinant DKK1 from days 2–4 of differentiation, either with (+ dox) or without (− dox) doxycycline from days 2–4 of differentiation. Cells were analyzed at the indicated times as in (A).
Figure 2
Figure 2. Mesp1 Expression Is Sufficient to Induce Wnt-Independent Epithelial to Mesenchymal Transition
(A) A2lox.Mesp1 cells differentiated as described in Figure S1B were plated on day 2 onto Collagen I-coated slides and stained with antibodies to E-cadherin (green) and N-cadherin (red) on day 4. Nuclei were stained using Hoechst 33342 (blue). (B) A2lox.Mesp1 cells were differentiated in the presence of DKK1, either with or without dox addition at day 2. On day 3 or day 4, gene expression was analyzed using Mouse Genome 430 2.0 arrays (Affymetrix). Shown are log2 fold change of expression of the indicated genes on day 3 (gray bar) and day 4 (black bar). Genes are arranged according to their association with either epithelial or mesenchymal phenotypes. (C) Snai1 gene expression analysis at 6, 12, and 24 hr after Mesp1 induction. A2lox.Mesp1 cells were differentiated as in (B) and were harvested 6, 12, or 24 hr after dox addition, and gene expression was analyzed as in (B). Shown is the fold increase of Snai1 expression in cells treated with DKK1 and dox compared to timematched controls treated with DKK1 only. (D) Snai1 and Gapdh expression were measured on day 3 of differentiation by RT-PCR. A2lox.Mesp1 ESCs were differentiated in the absence (NT) or presence of DKK1 (DKK1) beginning at day 2, either without (−) or with (+) addition of dox at day 2. (E) A2lox.Mesp1 and A2lox.Snai1 ESCs differentiated as in (D) were analyzed on day 4 for E-cadherin levels by flow cytometry. Shown are histogram overlays of E-cadherin staining for each cell line treated with DKK1 alone (green) and DKK1 plus dox (red). Numbers represent the frequency of live-gated cells found within the indicated gates (G1 or G2) for DKK-treated (green) or DKK and dox-treated (red) cells. (F) A2lox.Mesp1 and A2lox.Snai1 ESCs were treated with both DKK1 and dox. Cells were harvested on day 4 and analyzed by flow cytometry as in Figure 1. (G) Mesp1 heterozygous or Mesp1-deficient ESCs were derived from blastocysts of crosses between Mesp1cre/+ heterozygous knockin mice. Heterozygous (Cre/+) or Mesp1-deficient (Cre/Cre) ESCs and wild-type (+/+) or heterozygous (Cre/+) mice were genotyped by PCR. (H) Mesp1, Mesp2, Snai1, and Gapdh expression in heterozygous (Cre/+) or Mesp1-deficient (Cre/Cre) cells were measured by RT-PCR on day 5 of differentiation. (I) Mesp1 heterozygous (green) or Mesp1-deficient (blue) ESCs, differentiated as embryoid bodies, were harvested on day 5. E-cadherin and N-cadherin levels, determined by flow cytometry, were compared to levels on DKK-treated cultures (shaded).
Figure 3
Figure 3. Mesp1 Induces Expression of a Restricted Subset of Mesoderm-Associated Genes
(A) A2lox.Mesp1 ESCs were differentiated in the absence (NT) or presence (DKK1) of DKK1, either without (−) or with (+) addition of dox from days 2 to 4. On day 6, gene expression was analyzed by microarray analysis. Normalized sample data were evaluated for 5-fold changes following Mesp1 induction: (NT+ dox versus NT−) or (DKK1+ dox versus DKK1−). Representative clusters of the indicated lineage-specific genes are shown as heat maps with red shading indicating increased expression and blue shading indicating decreased expression. (B–F) Cells differentiated as in (A) were harvested at day 6 (C, E, and F) or day 8 (B and D), and expression of the indicated genes was analyzed by RT-PCR. (G) Results described in ([A]–[F], and Figures 2A–2D) are shown schematically. ESC, embryonic stem cell; EB, embryoid bodies; EMT, epithelial mesenchymal transition.
Figure 4
Figure 4. Mesp1-Induced Expression of Cardiac Troponin T Requires Blockade of Wnt Signaling
(A) A2.Mesp1 ESCs were differentiated with (+ dox) or without (− dox) dox and left without DKK1 treatment (No Treatment) or treated with the DKK1 from day 2–6. On day 6, cells were fixed, permeabilized, and stained with FITC-anti-αSMA, mouse-anti-cTnT, and APC-anti-mouse Ig. The numbers shown indicate the percent of live cells present within the indicated region. (B) A2.Mesp1 ESCs were differentiated as in (A) and plated on Collagen I-coated slides on day 4 or day 7 (SMM-HC). On day 8, cells were stained with antibodies to αSMA (green), cTnT (red), and SM-MHC (green, bottom panel). Nuclei were stained using Hoechst 33342 (blue). Representative images are shown, where the scale bar is 200 μm (αSMA/cTnT) or 50 μm (SM-MHC). (C–E) Action potentials and ionic currents were recorded from spontaneously beating clusters in DKK+dox cultures on day 10. Whole-cell action potentials (C) and macroscopic currents (D) were recorded with K+- (left panels) or Cs+-containing (right panels) pipette solution (D) In voltage-clamp mode, currents were evoked in response to a series of 300 ms voltage steps (−120 to +40 mV) from the holding potential of −70 mV; the dotted lines indicate the zero current level. Insets show inward currents evoked by depolarizing steps from −40 to +10 mV at a higher gain. (E) Peak (filled circles) and plateau (empty circles) current densities are plotted as a function of the test potential.
Figure 5
Figure 5. Mesp1 Expression Induces Endothelial Differentiation and Inhibits Hematopoietic Potential of Differentiating ESCs
(A and B) A2lox.Mesp1 ESCs were differentiated as in Figure S1B and were plated on Collagen I-coated slides on day 4 of differentiation. On day 12, cells were stained with antibodies to Pecam1 (green) and VE-cadherin (red) as indicated. Nuclei were stained using Hoechst 33342 (blue). (A) Representative images are shown where the scale bar is 200 μm. (B) Higher power image (scale bar, 50 μm) of culture treated with both DKK1 (day 2–6) and dox (day 2–4). (C) A2lox.Mesp1 ESCs were differentiated as in Figure S1B. On day 6, cells were assessed for hematopoietic precursor potential using methycellulose colony forming assays. Primitive erythroid (black) and definitive hematopoietic (gray) colonies were counted at days 12 and 16, respectively. (D) Cells were obtained from adult Rosa R26R-eGFP+/−mice that were either Mesp1+/+ or Mesp1Cre/+. Bone marrow cells were analyzed by flow cytometry for GFP expression in cKithi lineage live cells or Gr1+ cells contained in a granulocyte live-cell gate. Splenocytes were analyzed for GFP expression in either CD19+ or CD3+ cells contained in a lymphocyte live gate. Numbers shown are the percentage of live-gated cells in each quadrant.
Figure 6
Figure 6. Mesp1 Activates Stable Expression of the Core Regulatory Network of Cardiomyogenic Transcription Factors
(A–D) A2lox.Mesp1 ESCs were differentiated as in Figure S1B. Cells were harvested on days 3, 4, 6, 8, and 12, and expression of the indicated genes was analyzed by RT-PCR. (E) A2lox.Mesp1 ESCs, differentiated as indicated in Figure S1B, were harvested on day 6. Expression of the indicated proteins was analyzed by western blotting (see the Supplemental Experimental Procedures).
Figure 7
Figure 7. Mesp1 Rapidly Induces Expression of Many Genes, Including Myocardin, which Is Required for Differentiation of Cardiomyocyte and SMC Lineages
(A) A2lox.Mesp1 ESCs were differentiated in the presence of DKK1 without dox (Control) or with addition of dox (Mesp1) at day 2. Gene expression was assessed by microarray analysis at the indicated times (hrs) after doxcycyline addition. Normalized expression values were compared for 3-fold changes between time-matched samples that were either untreated or treated with dox. 592 genes satisfying the comparison criteria are shown using hierarchical clustering analysis. (B and C) A2lox.Mesp1 ESCs containing inducible Mesp1 (Mesp1), A2lox.Myocd DN ESCs containing inducible DN myocardin (Δ585) lacking the transactivation domain (DN Myocardin) (Wang et al., 2001), and A2lox.Mesp1-Myocd DN ESCs containing simultaneously inducible Mesp1 and DN myocardin (Mesp1 + DN Myocardin) were differentiated as in Figure S1B, and cells were harvested on day 4 (B) and day 6 (C). (B) Expression of PDGFRα and Flk1 was assessed by flow cytometry as in Figure 1B. (C) Expression of αSMA and cTnT was assessed by flow cytometry as in Figure 4B. The numbers shown indicate the percent of live cells present within each quadrant.

Comment in

References

    1. Ai D, Fu X, Wang J, Lu MF, Chen L, Baldini A, Klein WH, Martin JF. Canonical Wnt signaling functions in second heart field to promote right ventricular growth. Proc Natl Acad Sci USA. 2007;104:9319–9324. - PMC - PubMed
    1. Ball SG, Shuttleworth CA, Kielty CM. Platelet-derived growth factor receptor-alpha is a key determinant of smooth muscle alpha-actin filaments in bone marrow-derived mesenchymal stem cells. Int J Biochem Cell Biol. 2007;39:379–391. - PubMed
    1. Carver EA, Jiang R, Lan Y, Oram KF, Gridley T. The Mouse Snail Gene Encodes a Key Regulator of the Epithelial-Mesenchymal Transition. Mol Cell Biol. 2001;21:8184–8188. - PMC - PubMed
    1. Cohen ED, Wang Z, Lepore JJ, Lu MM, Taketo MM, Epstein DJ, Morrisey EE. Wnt/beta-catenin signaling promotes expansion of Isl-1-positive cardiac progenitor cells through regulation of FGF signaling. J Clin Invest. 2007;117:1794–1804. - PMC - PubMed
    1. Cooper TA, Ordahl CP. A single cardiac troponin T gene generates embryonic and adult isoforms via developmentally regulated alternate splicing. J Biol Chem. 1985;260:11140–11148. - PubMed

Publication types

MeSH terms