. 2008 Sep 5;283(36):24334-42.
doi: 10.1074/jbc.M802097200. Epub 2008 Jul 1.

Islet oxygen consumption and insulin secretion tightly coupled to calcium derived from L-type calcium channels but not from the endoplasmic reticulum

Affiliations

Islet oxygen consumption and insulin secretion tightly coupled to calcium derived from L-type calcium channels but not from the endoplasmic reticulum

Merle Gilbert et al. J Biol Chem. .

Abstract

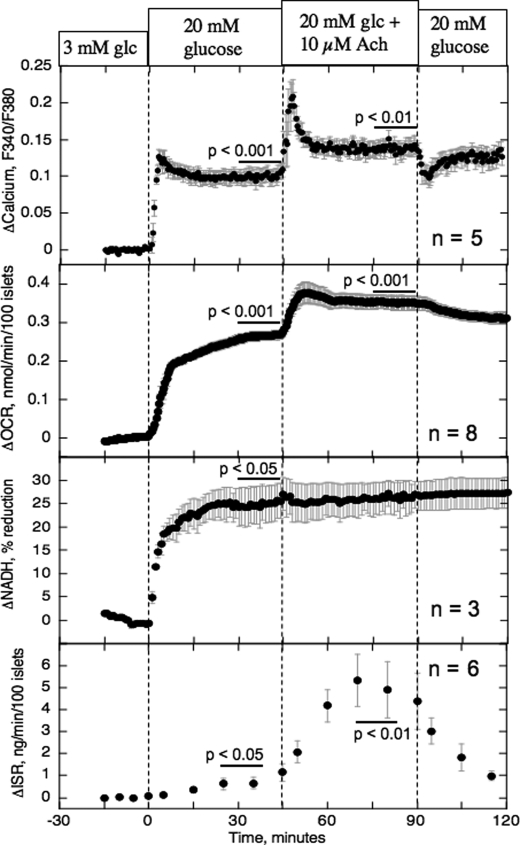
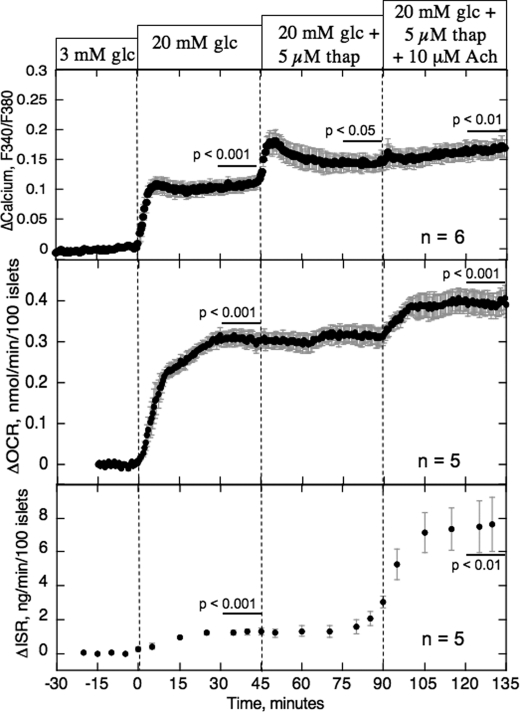
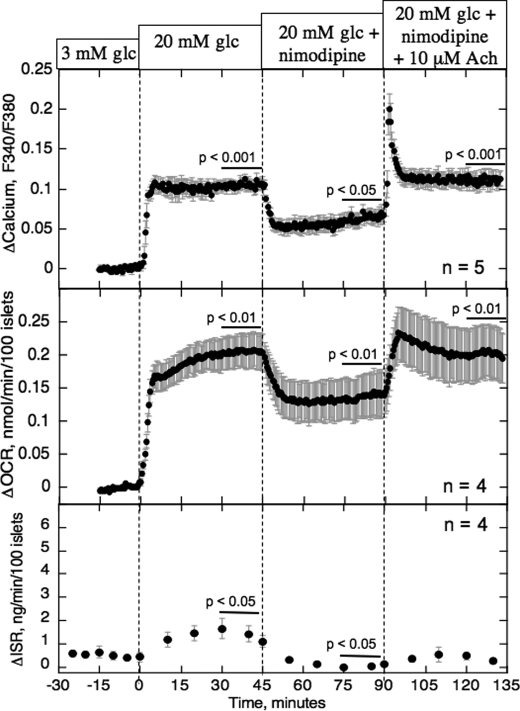
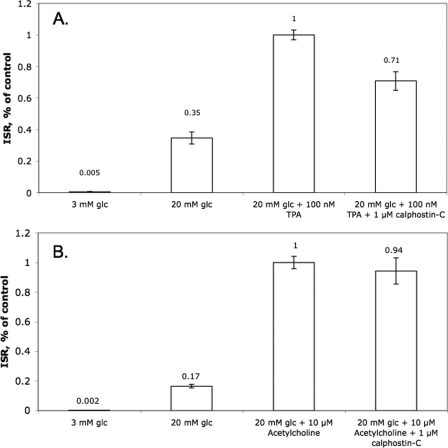
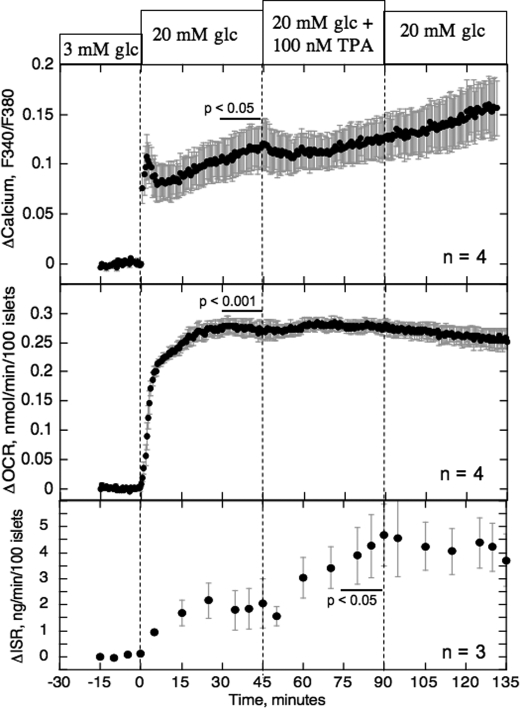
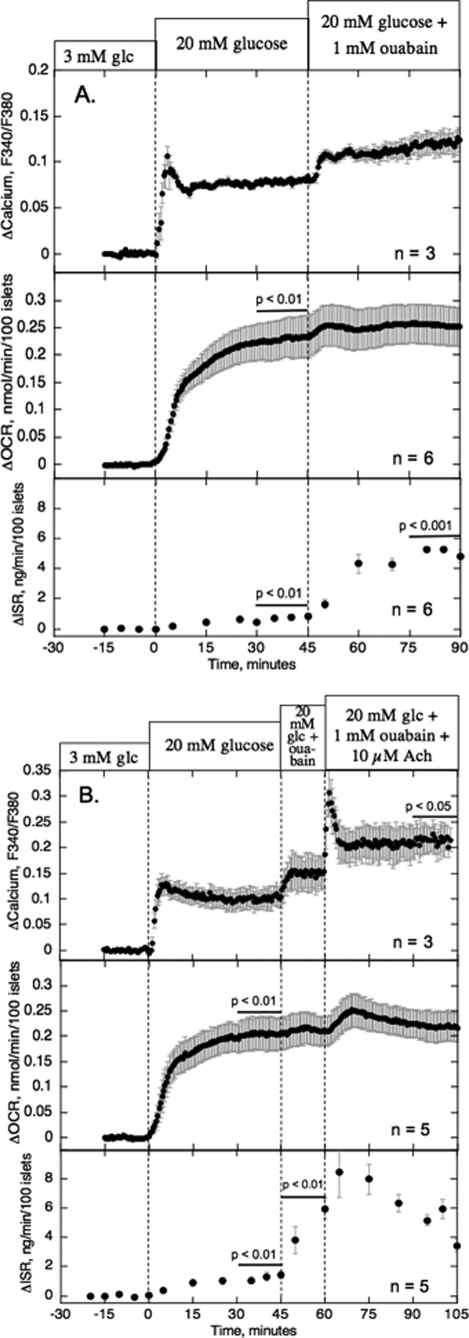
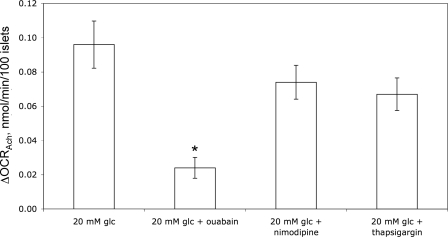
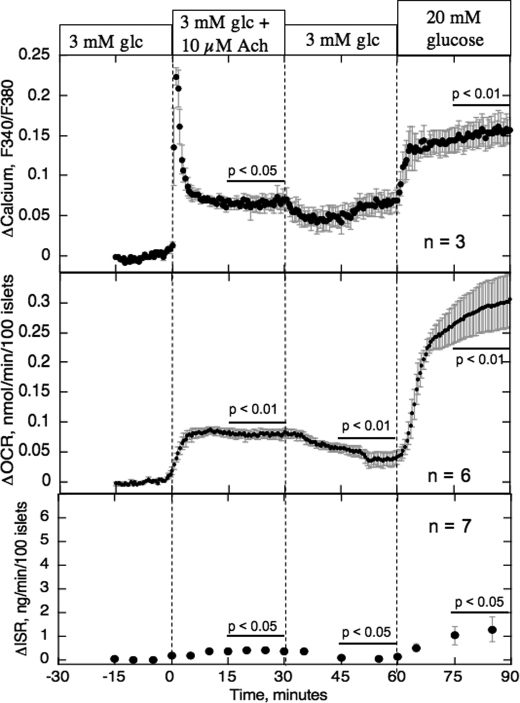
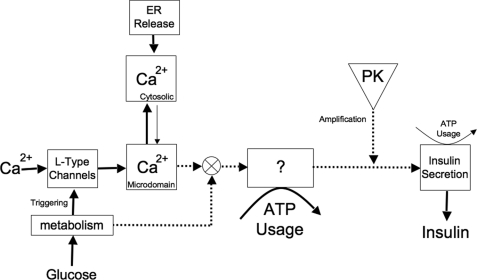
The aim of the study was to test whether the source of intracellular calcium (Ca2+) is a determinant of beta cell function. We hypothesized that elevations in cytosolic Ca2+ caused by the release of Ca2+ from the endoplasmic reticulum (ER) have little physiologic impact on oxygen consumption and insulin secretion. Ca2+ release from the ER was induced in isolated rat islets by acetylcholine and response of oxygen consumption rate (OCR), NAD(P)H, cytosolic Ca2+, and insulin secretory rate (ISR) were measured. Glucose increased all four parameters, and thereafter acetylcholine further increased cytosolic Ca2+, OCR, and ISR. To assess the contribution of Ca2+ release from the ER in mediating the effects of acetylcholine, ER Ca2+ stores were first emptied by inhibiting the sarcoendoplasmic reticulum Ca2+-ATPase, which subsequently reduced the effect of acetylcholine on cytosolic Ca2+ but not its effects on OCR or ISR. As predicted, OCR and ISR were acutely sensitive to changes in L-type Ca2+ channel activity; nimodipine completely inhibited glucose-stimulated ISR and suppressed OCR by 36%, despite only inhibiting cytosolic Ca2+ by 46%. Moreover, in the presence of nimodipine and high glucose, acetylcholine still elevated cytosolic Ca2+ levels above those observed in the presence of high glucose alone but did not significantly stimulate ISR. In conclusion, Ca2+ flux through L-type Ca2+ channels was tightly coupled to changes in OCR and ISR. In contrast, the results obtained support the notion that Ca2+ release from the ER has little or no access to the intracellular machinery that regulates OCR and ISR.


Figures

FIGURE 1.
FIGURE 1.
Effect of acetylcholine on Ca2+, OCR, NAD(P)H, and ISR. Islets were perifused in the presence of 3 mm glucose (glc) for 90 min; at time 0, glucose concentration was raised to 20 mm for 45 min; subsequently, 10 μm acetylcholine (Ach) was added and removed at 45-min intervals. Top panel and third panel from top, detection of cytosolic Ca2+ and NAD(P)H autofluorescence by fluorescence imaging (measured in separate experiments). Second panel from top and bottom panel, OCR and ISR were measured concomitantly using the flow culture system. The data are displayed as the change in signal relative to the steady state value obtained at 3 mm glucose (determined by averaging data obtained in the final 15 min prior to the increase in glucose). Steady state values of OCR and ISR at 3 mm glucose were 0.30 ± 0.05 nmol/min/100 islets and 0.15 ± 0.043 ng/min/100 islets, respectively. Each data point represents the average ± S.E. of time points from n separate perifusions. Statistical analysis was carried out by comparing steady state values (determined by averaging data obtained in the final 15 min of each experimental condition demarcated by the bold line) and after each change in medium composition using a paired Student's t test. The numbers above the data refer to the p value obtained when comparing the steady state value to the previous one. Note that statistics were not carried out on the data obtained in the final 30 min of the protocol because steady state was not reached.
FIGURE 2.
FIGURE 2.
Effect of blocking SERCA activity on stimulation of Ca2+, OCR, and ISR by acetylcholine. Islets were perifused in the presence of 3 mm glucose (glc) for 90 min; at time 0, glucose concentration was raised to 20 mm for 45 min; subsequently, SERCA activity was inhibited by thapsigargin (thap, 5 μm) for 45 min prior to stimulation with acetylcholine (Ach, 10 μm). Top panel, detection of a Ca2+ by fluorescence imaging. Middle and bottom panels, OCR and ISR were measured concomitantly using the flow culture system. The data are displayed and analyzed as described in the legend to Fig. 1. Steady state values of OCR and ISR at 3 mm glucose were 0.25 ± 0.031 nmol/min/100 islets and 0.68 ± 0.19 ng/min/100 islets, respectively.
FIGURE 3.
FIGURE 3.
Effect of blocking L-type Ca2+ channels on stimulation of Ca2+, OCR, and ISR by acetylcholine. Islets were perifused in the presence of 3 mm glucose (glc) for 90 min; at time 0, glucose concentration was raised to 20 mm for 45 min; subsequently, L-type Ca2+ channels were inhibited by nimodipine (5 μm) for 45 min prior to stimulation with acetylcholine (Ach, 10 μm). Top panel, detection of intracellular Ca2+ by fluorescence imaging. Middle and bottom panels, OCR and ISR were measured concomitantly using the flow culture system. The data are displayed and analyzed as described in the legend to Fig. 1. Steady state values of OCR and ISR at 3 mm glucose were 0.39 ± 0.054 nmol/min/100 islets and 0.41 ± 0.11 ng/min/100 islets, respectively.
FIGURE 4.
FIGURE 4.
Effect of inhibition of PKC activity on TPA- and acetylcholine-stimulated ISR. ISR was measured after static incubation (as described under “Experimental Procedures”) in the presence or absence of the PKC blocker calphostin C. The data (n = 6) were normalized to TPA-stimulated ISR (1.4 ± 0.24 ng/min/100 islets) in Fig. 4A and acetylcholine-stimulated ISR in Fig. 4B (2.8 ± 0.34 ng/min/100 islets). The values are shown above each bar because at 3 mm glucose (glc) the value cannot be seen on the graph. Analysis of variance with a Bonferroni post hoc test was used to calculate the statistical significance of all conditions. A, all conditions were significantly different from each other at p > 0.0005. B, all conditions were significantly different from each other (p > 0.0001) except for the comparison between acetylcholine-stimulated ISR in the presence and absence of calphostin C.
FIGURE 5.
FIGURE 5.
Effect of activation of PKC on cytosolic Ca2+, OCR, and ISR. Islets were assessed for Ca2+ (top panel) and, in separate experiments, OCR and ISR. The islets were perifused in the presence of 3 mm glucose (glc) for 90 min; at time 0, glucose concentration was raised to 20 mm for 45 min; subsequently, 100 nm TPA was added and removed at 45-min intervals. The data are displayed and analyzed as described in the legend to Fig. 1. Steady state values of OCR and ISR at 3 mm glucose were 0.41 ± 0.035 nmol/min/100 islets and 0.55 ± 0.39 ng/min/100 islets, respectively.
FIGURE 6.
FIGURE 6.
Effect of blocking Na+-K+ pump activity on stimulation of Ca2+, OCR, and ISR by acetylcholine. A, islets were perifused in the presence of 3 mm glucose (glc) for 90 min; at time 0, glucose concentration was raised to 20 mm for 45 min; subsequently, Na+-K+ pump activity was inhibited with 1 mm ouabain for 15 min prior to stimulation with acetylcholine (Ach, 10 μm). Top panel, detection of intracellular Ca2+ by fluorescence imaging. Middle and bottom panels, OCR and ISR were measured concomitantly using the flow culture system. The data are displayed and analyzed as described in the legend to Fig. 1. Steady state values of OCR and ISR at 3 mm glucose were 0.32 ± 0.045 nmol/min/100 islets and 0.34 ± 0.084 ng/min/100 islets, respectively. B, same as A except stimulation by acetylcholine was excluded from the protocol. Steady state values of OCR and ISR at 3 mm glucose were 0.28 ± 0.054 nmol/min/100 islets and 0.46 ± 0.052 ng/min/100 islets, respectively.
FIGURE 7.
FIGURE 7.
Effect of blockers of ion transport on steady state OCR in response to acetylcholine. The increments in OCR (ΔOCRAch) were calculated as the difference between steady state values before and after exposure to acetylcholine in the presence of 20 mm glucose (glc) and blockers of ion channels and pumps. Calculations were made from the data shown in Figs. 1, 2, 3 and 6B, where steady state values of OCR were determined by averaging from –15 to 0 min prior to and 5 to 30 min after the exposure to acetylcholine. (However, for ouabain data (Fig. 6B), steady state values were calculated using data obtained during the 10 min prior to the exposure to acetylcholine.) Analysis of variance with a Bonferroni post hoc test was used to calculate the statistical significance of all conditions. Only ouabain resulted in a statistically significant decrease in acetylcholine response (p < 0.002 compared with 20 mm glucose alone).
FIGURE 8.
FIGURE 8.
Effect of acetylcholine on Ca2+, OCR, and ISR in the presence of 3 mm glucose. The islets were perifused in the presence of 3 mm glucose (glc) for 90 min; at time 0, 10 μm acetylcholine (Ach) was added and removed at 30-min intervals. Subsequently, glucose concentration was raised to 20 mm for 30 min. Top panel, detection of intracellular Ca2+ by fluorescence imaging. Middle and bottom panels, OCR and ISR were measured concomitantly using the flow culture system. The data are displayed and analyzed as described in the legend to Fig. 1. Steady state values of OCR and ISR at 3 mm glucose were 0.37 ± 0.054 nmol/min/100 islets and 0.36 ± 0.11 ng/min/100 islets, respectively.
FIGURE 9.
FIGURE 9.
Expanded model of glucose stimulated insulin secretion. The major features of model of glucose-stimulated insulin secretion are two pools of cytosolic Ca2+, one derived primarily from L-type Ca2+ channels. In the presence of increased metabolism, this pool has exclusive access to a process that is highly energetic (30% of glucose-stimulated ATP usage) and that stimulates the movement and exocytosis of insulin granules. Amplification of ISR by protein kinases occurs downstream of the energy-utilizing Ca2+-sensitive process, and the ATP usage associated with insulin secretion is small relative to total ATP turnover. Whether this as yet unidentified coupling process is regulatory or simply concomitant with the stimulation of insulin secretion is not yet established. However, a regulatory role is supported by the need for both increased metabolism and Ca2+ influx through the L-type Ca2+ channels for activation of the process and insulin secretion to occur.

Similar articles

Cited by

References

    1. Henquin, J. C., Ravier, M. A., Nenquin, M., Jonas, J. C., and Gilon, P. (2003) Eur. J. Clin. Investig. 33 742–750 - PubMed
    1. Satin, L. S. (2000) Endocrine 13 251–262 - PubMed
    1. Wollheim, C. B., and Sharp, G. W. (1981) Physiol. Rev. 61 914–973 - PubMed
    1. Prentki, M., and Matschinsky, F. M. (1987) Physiol. Rev. 67 1185–1248 - PubMed
    1. Arredouani, A., Henquin, J. C., and Gilon, P. (2002) Am. J. Physiol. 282 E982–E991 - PubMed

Publication types