

Air pollution and lung function in the European Community Respiratory Health Survey
- PMID: 18593748
- PMCID: PMC2734069
- DOI: 10.1093/ije/dyn136
Air pollution and lung function in the European Community Respiratory Health Survey
Abstract
Background: The association of long-term air pollution and lung function has not been studied across adult European multi-national populations before. The aim of this study was to determine the association between long-term urban background air pollution and lung function levels, as well as change in lung function among European adults.
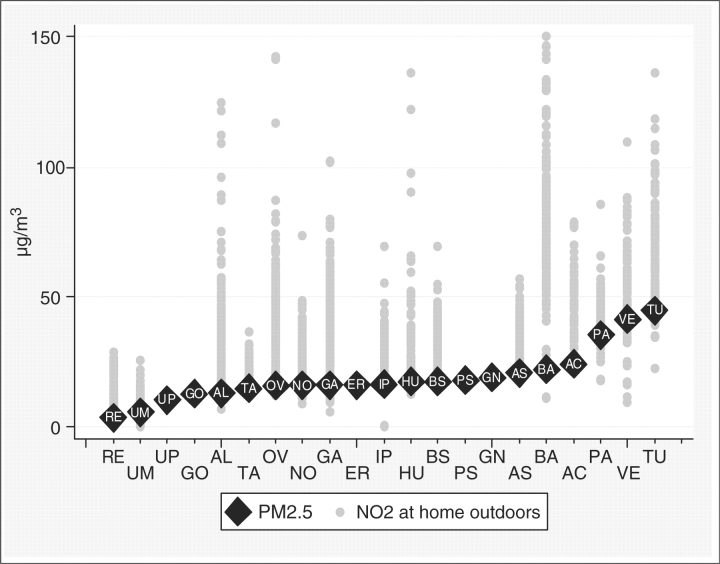
Methods: Forced expiratory volume in 1 s (FEV1), forced vital capacity (FVC) and the ratio thereof (FEV1/FVC) were assessed at baseline and after 9 years of follow-up in adults from 21 European centres (followed-up sample 5610). Fine particles (PM(2.5)) were measured in 2000/2001 using central monitors.
Results: Despite sufficient statistical power no significant associations were found between city-specific annual mean PM(2.5) and average lung function levels. The findings also do not support an effect on change in lung function, albeit statistical power was insufficient to significantly detect such an association.
Conclusions: The inability to refuse the null hypothesis may reflect (i) no effect of urban air pollution on lung function or (ii) inherent biases due to the study design. Examples of the latter are lack of individual-level air quality assignment, not quantified within-city contrasts in traffic-related pollution, or the heterogeneity of the studied populations and their urban environments. Future studies on long-term effects of air pollution on lung function could increase statistical power and reduce potential misclassification and confounding by characterizing exposure on the level of individuals, capturing contrasts due to local sources, in particular traffic.
Figures


References
-
- Sin DD, Wu L, Man SFP. The relationship between reduced lung function and cardiovascular mortality: a population-based study and a systematic review of the literature. Chest. 2005;127:1952–59. - PubMed
-
- Pope CA, 3rd, Dockery DW. Health effects of fine particulate air pollution: lines that connect. J Air Waste Manag Assoc. 2006;56:709–42. - PubMed
-
- Gauderman WJ, Avol E, Gilliland F, et al. The effect of air pollution on lung development from 10 to 18 years of age.[see comment] [erratum appears in N Engl J Med 2005;352:1276] N Engl J Med. 2004;351:1057–67. - PubMed
-
- Ackermann-Liebrich U, Leuenberger P, Schwartz J, et al. Lung function and long term exposure to air pollutants in Switzerland. Study on Air Pollution and Lung Diseases in Adults (SAPALDIA) Team. Am J Respir Crit Care Med. 1997;155:122–29. - PubMed
Publication types
MeSH terms
Substances
Grants and funding
LinkOut - more resources
Full Text Sources
Medical
