. 2008 Jul 1;68(13):4990-7.
doi: 10.1158/0008-5472.CAN-07-5984.

Noninvasive imaging and quantification of epidermal growth factor receptor kinase activation in vivo

Affiliations

Noninvasive imaging and quantification of epidermal growth factor receptor kinase activation in vivo

Wenrong Li et al. Cancer Res. .

Abstract

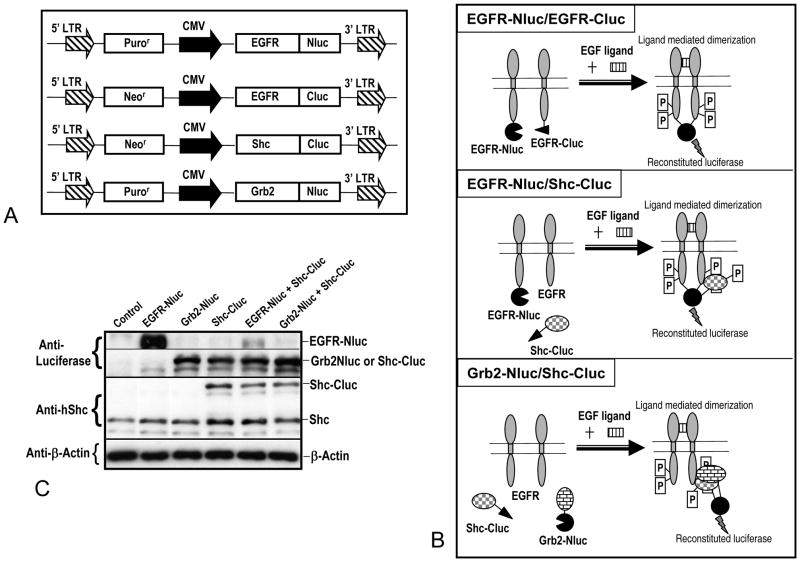
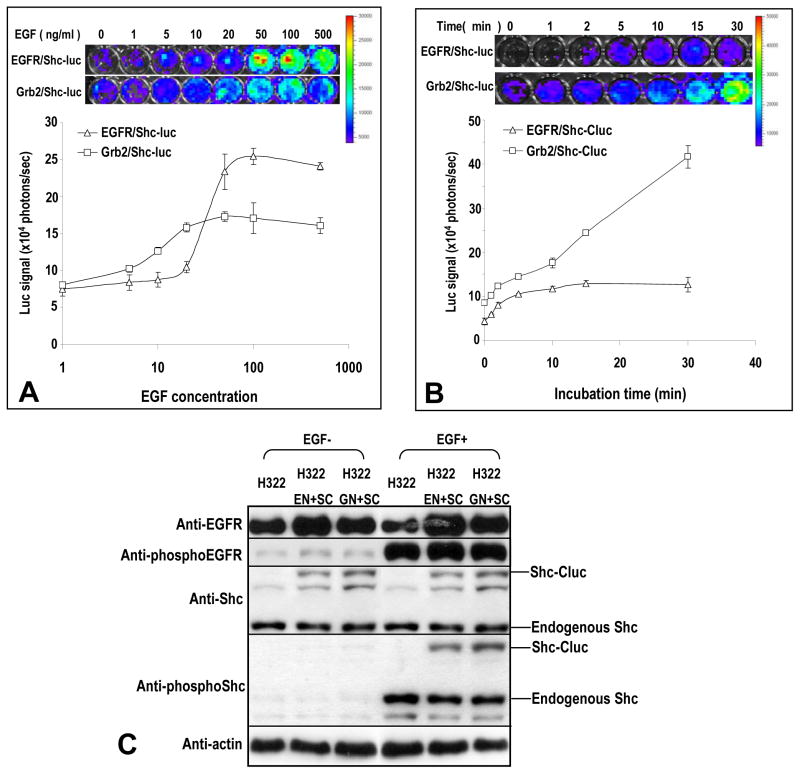
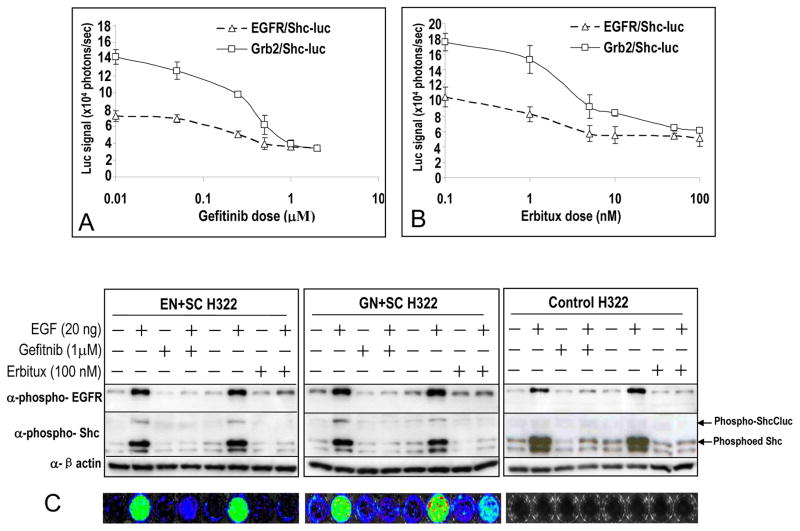
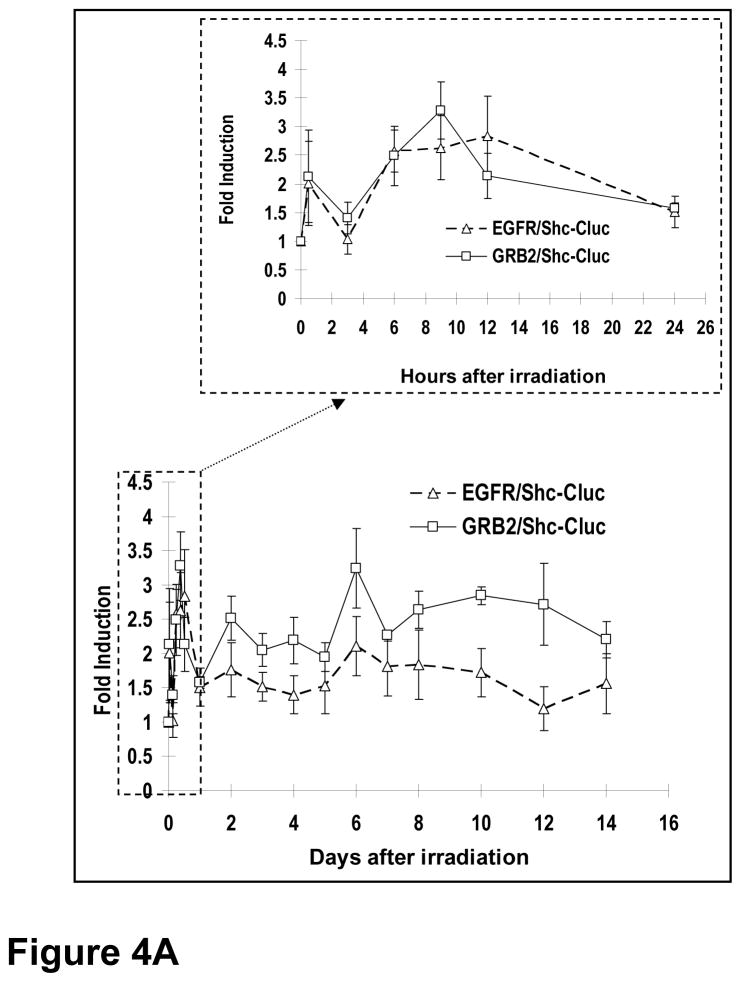
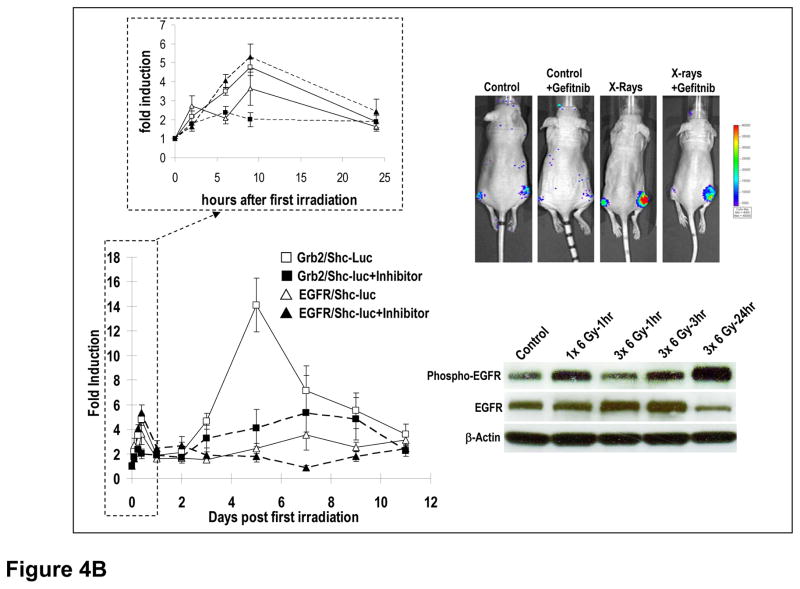
Epidermal growth factor receptor (EGFR) is a receptor tyrosine kinase (RTK) critical in tumor growth and a major target for anticancer drug development. However, thus far, there is no effective system to monitor its activities in vivo. Here, we report a novel approach to monitor EGFR activation based on the bifragment luciferase reconstitution system. The EGFR receptor and its interacting partner proteins (EGFR, growth factor receptor binding protein 2, and Src homology 2 domain-containing) were fused to NH(2) terminal and COOH terminal fragments of the firefly luciferase. After establishing tumor xenograft from cells transduced with the reporter genes, we show that the activation of EGFR and its downstream factors could be quantified through optical imaging of reconstituted luciferase. Changes in EGFR activation could be visualized after radiotherapy or EGFR inhibitor treatment. Rapid and sustained radiation-induced EGFR activation and inhibitor-mediated signal suppression were observed in the same xenograft tumors over a period of weeks. Our data therefore suggest a new methodology where activities of RTKs can be imaged and quantified optically in mice. This approach should be generally applicable to study biological regulation of RTK, as well as to develop and evaluate novel RTK-targeted therapeutics.


Figures

Figure 1
Figure 1. Structure of a bi-fragment luciferase reconstitution system for detecting EGFR pathway activation
A) Structures of various fusion reporter proteins between EGFR pathway proteins (EGFR, Shc, Grb2) and the fragments of firefly luciferase (Nluc, Cluc represents the N- and C- terminal halves of the firefly luciferase gene). The retroviral vector pLPCX and pLNCX were used to carry the reporter genes (with resistance genes for puromycin and neomycin, respectively). B) Graphic illustration of the principles of EGFR activity reporters used in this study. Three different versions of the reporters were shown. C) Western blot analyses of the expression of endogenous and recombinant EGFR pathway proteins after transduction of one or both components of the reporter system into the human lung cancer line H322.
Figure 2
Figure 2. In vitro characterization of the kinetics of EGF-induced activation of the bi-fragment luciferase reporter
A) The dose response curve for the EGFR/Shc-luc reporter and the Grb2/Shc-luc reporter. The top panel shows representative images of reporter-transduced cells (in 48-well plates) treated with different concentrations of EGF at 37°C 15 minutes and then imaged in the IVIS200 instrument while the lower panel shows the quantitative dose response of the reporter activation after EGF addition. The error bars represent standard deviations derived from 3–5 data points. B) The time course of reporter activation for the same EGFR reporters. The top panel shows representative images of reporter-transduced cells treated with 20 ng/ml of EGF for various lengths of time and imaged in the IVIS200 instrument for reconstituted luciferase gene activities. The lower panel shows the time course of reporter activation. The error bars represent standard deviations derived from 3–5 data points. C) Western blot analyses of EGF-mediated activation of endogenous and recombinant EGFR and downstream factors. Cell transduced with various recombinant reporter genes were incubated with EGF (20 ng/ml for 15 minutes) and than lysed. Antibodies against total and phosphorylated EGFR and Shc proteins were used to analyze total as well activated forms of these proteins in western blots. EN+SC represents EGFR-Nluc+Shc-Cluc while GN+SC represents Grb2-Nluc+Shc-Cluc. The phosphorylations of the proteins correlated well with optical imaging of the reporter cells (shown in A & B).
Figure 3
Figure 3. Quantitative imaging of the effect of EGFR inhibitors on the EGFR reporter activities
A) Effective suppression of both EGFR/Shc-luc and Grb2/Shc-luc reporters by the small molecule EGFR kinase inhibitor gefitinib. Cell transduced with the reporters were incubated with EGF (at 20 ng/ml) and various concentrations of the inhibitors. After 15 minutes of incubation, the cells were imaged for luciferase activities. The error bars represent standard deviations of 3–5 triplicate data points. B) Effective suppression of the both EGFR/Shc-luc and Grb2/Shc-luc reporters by the monoclonal antibody EGFR inhibitor Erbitux (cetuximab). The error bars represent standard deviations of 3–5 triplicate data points. C) Western blot analyses of the effect of EGFR inhibitors (gefinib or erbitux) on EGF-induced activation of EGFR and its downstream protein Shc. The phosporylation status of the proteins, which indicated the activation status, was closely correlated with the addition of the inhibitors and the reconstitution of luciferase activities (A&B).
Figure 4
Figure 4. In vivo imaging of EGFR activation during radiotherapy
A) Radiotherapy induced activation of EGFR/Shc-luc (broken lines) and Grb2/Shc-luc (solid lines) reporters in H322 xenograft tumors. After reporter-transduced H322 lung tumor cell (5×10⁶) implantation (subcutaneous) and tumor formation (with diameters around 5–7 mm), the tumors were irradiated with X-rays (6 Gy). The activities of the EGFR were then imaged. Shown were data obtained during the two weeks after radiotherapy. Data of the first 24 hours after radiotherapy were plotted in a separate graph (top panel) to show more details of activation during this period. The error bars represent standard error of the mean (SEM, n=4). B) The effect of the small molecule EGFR inhibitor gefitinib on radiotherapy-induced activation of the EGFR receptors. When reporter-transduced H322 tumors were 5–7 mm in diameter, the EGFR inhibitor gefitinib were administered on a daily basis for 10 days. Radiation (3×6 Gy) was then administered every other day starting one day after drug administration (days 0, 2, 4 on the top panel). Quantitative imaging of EGFR activation was carried out and the data plotted (Left panels). Top left panel shows data from the 1st 24 hours in more details. The error bars represent SEM (n=3–5). Top right panel shows representative images of mice with the reporter-transduced tumors after various treatments. Lower right panel shows a western blot autoradiograph of total EGFR, activated (phosphor-EGFR), and β-actin levels in tumors obtained (from sacrificed mice) from at different times points after they were irradiated in vivo.

References

    1. Sweeney TJ, Mailander V, Tucker AA, et al. Visualizing the kinetics of tumor-cell clearance in living animals. Proc Natl Acad Sci U S A. 1999;96(21):12044–9. - PMC - PubMed
    1. Cao YA, Wagers AJ, Beilhack A, et al. Shifting foci of hematopoiesis during reconstitution from single stem cells. Proc Natl Acad Sci U S A. 2004;101(1):221–6. - PMC - PubMed
    1. Negrin RS, Contag CH. In vivo imaging using bioluminescence: a tool for probing graft-versus-host disease. Nature reviews. 2006;6(6):484–90. - PubMed
    1. Villalobos V, Naik S, Piwnica-Worms D. Current state of imaging protein-protein interactions in vivo with genetically encoded reporters. Annual review of biomedical engineering. 2007;9:321–49. - PubMed
    1. Gross S, Piwnica-Worms D. Spying on cancer: molecular imaging in vivo with genetically encoded reporters. Cancer cell. 2005;7(1):5–15. - PubMed

Publication types

MeSH terms