. 2008 Jul 1;68(13):5049-58.
doi: 10.1158/0008-5472.CAN-07-6655.

Methylation mediated silencing of MicroRNA-1 gene and its role in hepatocellular carcinogenesis

Affiliations

Methylation mediated silencing of MicroRNA-1 gene and its role in hepatocellular carcinogenesis

Jharna Datta et al. Cancer Res. .

Retraction in

Abstract

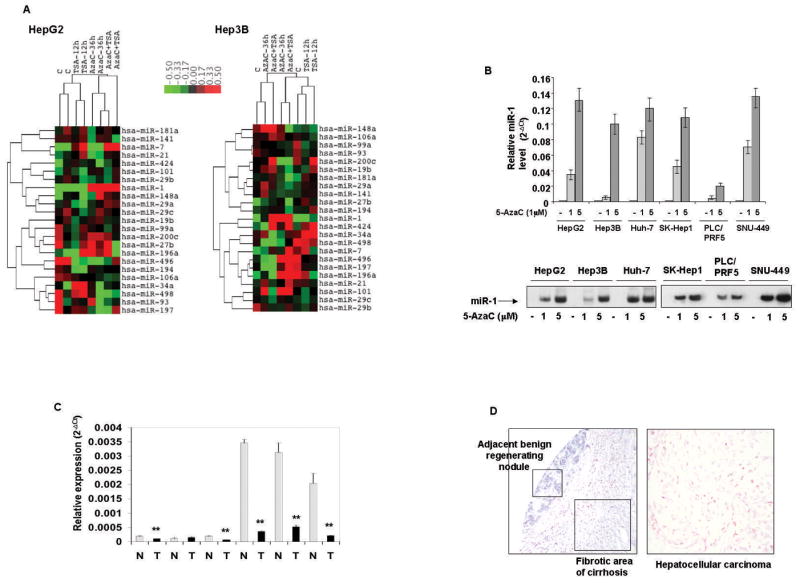
MicroRNAs (miR) are a class of small ( approximately 21 nucleotide) noncoding RNAs that, in general, negatively regulate gene expression. Some miRs harboring CGIs undergo methylation-mediated silencing, a characteristic of many tumor suppressor genes. To identify such miRs in liver cancer, the miRNA expression profile was analyzed in hepatocellular carcinoma (HCC) cell lines treated with 5-azacytidine (DNA hypomethylating agent) and/or trichostatin A (histone deacetylase inhibitor). The results showed that these epigenetic drugs differentially regulate expression of a few miRs, particularly miR-1-1, in HCC cells. The CGI spanning exon 1 and intron 1 of miR-1-1 was methylated in HCC cell lines and in primary human HCCs but not in matching liver tissues. The miR-1-1 gene was hypomethylated and activated in DNMT1-/- HCT 116 cells but not in DNMT3B null cells, indicating a key role for DNMT1 in its methylation. miR-1 expression was also markedly reduced in primary human hepatocellular carcinomas compared with matching normal liver tissues. Ectopic expression of miR-1 in HCC cells inhibited cell growth and reduced replication potential and clonogenic survival. The expression of FoxP1 and MET harboring three and two miR-1 cognate sites, respectively, in their respective 3'-untranslated regions, was markedly reduced by ectopic miR-1. Up-regulation of several miR-1 targets including FoxP1, MET, and HDAC4 in primary human HCCs and down-regulation of their expression in 5-AzaC-treated HCC cells suggest their role in hepatocarcinogenesis. The inhibition of cell cycle progression and induction of apoptosis after re-expression of miR-1 are some of the mechanisms by which DNA hypomethylating agents suppress hepatocarcinoma cell growth.


Figures

Figure 1
Figure 1. A. Epigenetic drugs deregulate miR expression in HCC cells
Cluster analysis of differentially regulated microRNA in HCC cells after treatment with inhibitors of DNA methyltransferase (5-azacytidine), HDAC (trichostatin A) or both. Cells in log phase were treated with 5-AzaC (1 μM) for 24 hr followed by treatment with TSA (0.3 μM) for an additional 12 hr. Cells treated with the vehicle (DMSO) or the drugs alone were used as the control. Total RNA isolated was subjected to microRNA microarray analysis and data was normalized to the average median of all the genes in the array. Hierarchical clustering was performed with the normalized, log-transformed data using Cluster 3.0 and TREEVIEW software. The results are mean of two different batches of cells treated under identical conditions. Only 23 miRs were used for clustering whose expression was >1.5 or <0.5 compared to the control cells. B. miR-1 expression is upregulated in HCC cell lines upon treatment with 5-AzaC. Upper panel. Cells in log phase were either untreated or treated with 1 μM of 5-AzaC for 36 hr. Real-time RT-PCR analysis of mature miR-1 was performed using Taqman primers and probe. The data was normalized to 18S rRNA. The results are mean of 3 replicates ± S.D. Lower panel. Northern blot analysis of the PCR product generated in B using 32P-labeled anti-sense miR-1 deoxyolgonucleotides. C. miR-1 level is reduced in human primary HCCs. Real-time RT-PCR analysis of mature miR-1 in human primary HCCs and matching liver tissues as described in B. The data were normalized to 18S rRNA. Each sample was analyzed in triplicate and the results are mean of 3 values ± S.D. D. Detection of miR-1 in hepatocellular carcinoma tissue sections and adjacent nonmalignant tissue with LNA-modified anti-sense miR-1 probe. miR-1 was detected in the hepatocytes of a regenerating nodule in this section of cirrhotic liver adjacent to a hepatocellular carcinoma (positive is blue, due to NBT/BCIP; negative cells pink from nuclear fast red counterstain); note the cytoplasmic localization. In comparison, miR-1 was not detected in the malignant hepatocytes of the adjacent HCC.
Figure 2
Figure 2. A. miR-1-1 is an intronic microRNA embedded in several CpG island (CGI). B. COBRA revealed methylation of CGI-81 in HCC cell lines
Bisulfite-converted genomic DNA was amplified with primers specific for CGI-81, PCR product was digested with restriction enzymes, separated by polyacrylamide gel electrophoresis and visualized by staining with ethidium bromide. C. Bisulfite genomic sequencing of the PCR products of sample #2. PCR products were cloned into PCR 2 cloning vector and 12 randomly selected clones were subjected to automated sequencing. The filled boxes denote methylated CpGs. The number on the top of each column denotes position of each CpG with respect to +1 site. D. DNMT1 is primarily involved in methylation of CGI-81 of miR-1-1. Upper panel: BS converted genomic DNA from wild type (+/+) and mutant HCT116 cells were subjected to COBRA as described in 2B. Lower panel: Real-time RT-PCR analysis of miR-1 in HCT116 cell lines using Taqman probe and primers.
Figure 3
Figure 3. Ectopic expression of miR-1 reduces growth, replication potential, clonogenic survival and induces apoptosis and cell cycle arrest of HepG2 cells
Cells were transfected with (100 nM) hsa-pre-miR-1 or control RNA. After 24 hours cells were distributed to perform experiments A to D. A. Total RNA isolated from transfected cells 48 hr post-transfection and heart was subjected to real-time RT-PCR analysis. B. Left panel: Cells (10000/well) were distributed in 96 well plates and cell growth was measured every 24 hr for 5 days using MTT assay. Right panel: Cells were serum-starved overnight 48 hr post-transfection followed by addition of serum and 3H1-thymidine. Incorporation of 3H1-thymidine into DNA after 4 hr was measured in a scintillation counter. C. Single cells (1000) were seeded onto a 60 mm plate and allowed to grow for 10 days and the colonies formed were stained with crystal violet and photographed. The total number of colonies in three plates was counted and the number of colonies formed by cells transfected with control miR was assigned a value of 100. Each experiment (A–C) was performed in triplicate with two different batches of transfected cells. D. FACS analysis of the control and miR-1 overexpressing Hep3B cells. An equal number of cells (5×10⁵) transfected with hsa-miR-1 or control RNA were plated into 10-cm plates and allowed to grow for 2 days. Cells were then fixed, stained with propidium iodide, and analyzed in a flow cytometer. The cell cycle analysis was performed in duplicate with two different batches of transfected cells and representative percentage of cells present in different phases of cell cycle is shown.
Figure 4
Figure 4. FoxP1 is a validated target of miR-1
A. The 3′-UTR of FoxP1 harbors 3 miR-1 binding sites. B. Luciferase activity controlled by 3′ of FoxP1 is inhibited by ectopic expression of pre-miR-1. Hep3B cells were co-transfected with firefly luciferase-3′ (FoxP1) and pre-miR-1 or control RNA (60 nM) along with SV40-βgal (as internal control). After 48 hr luciferase and βgalactosidase activities were measured in cell extracts. FoxP1-3′ deleted of miR-1 sites were used as control. C and D. Extracts from cells transfected with pre-miR-1 or control miR for 48 hr were subjected to western blot analysis with antibodies as indicated. The signal in each band in the scanned X-ray film was quantified using KODAK imaging software and the levels were normalized to that of GAPDH.
Figure 5
Figure 5. FoxP1, MET and HDAC4 levels are reduced in HCC cells treated with 5-azacytidine
Six different HCC cells were treated with 5-AzaC (1 and 5 μM) for 24 hr. Untreated cells were used as control. Whole cell extracts were subjected to western blot analysis with FoxP1, MET, HDAC4 or GAPDH antibody. A. Western blot analysis. B–D. Quantitative analysis of the data in A.
Figure 6
Figure 6. FoxP1, MET and HDAC4 are elevated in primary human HCCs
A. Whole cell extracts of HCCs and matching control tissues were subjected to western blot analysis with antibodies specific for FOXP1, MET, HDAC4 and Ku-70 (used as loading control). B. Quantitative representation of the data using Box and Whisker plots. A horizontal line in each box represents the median value of each protein level in each group. Box denotes 25th and 75th percentile range of scores whereas whiskers represent the highest and lowest values.

Similar articles

Cited by

References

    1. El-Serag HB, Rudolph KL. Hepatocellular carcinoma: epidemiology and molecular carcinogenesis. Gastroenterology. 2007;132:2557–76. - PubMed
    1. Calin GA, Croce CM. MicroRNA signatures in human cancers. Nat Rev Cancer. 2006;6:857–66. - PubMed
    1. Calin GA, Croce CM. Chromosomal rearrangements and microRNAs: a new cancer link with clinical implications. J Clin Invest. 2007;117:2059–66. - PMC - PubMed
    1. Kim VN. MicroRNA biogenesis: coordinated cropping and dicing. Nat Rev Mol Cell Biol. 2005;6:376–85. - PubMed
    1. Filipowicz W, Bhattacharyya SN, Sonenberg N. Mechanisms of post-transcriptional regulation by microRNAs: are the answers in sight? Nat Rev Genet. 2008;9:102–14. - PubMed

Publication types

MeSH terms