. 2008 Jul 1;14(13):4284-91.
doi: 10.1158/1078-0432.CCR-07-5226.

Combined inhibition of c-Src and epidermal growth factor receptor abrogates growth and invasion of head and neck squamous cell carcinoma

Affiliations

Combined inhibition of c-Src and epidermal growth factor receptor abrogates growth and invasion of head and neck squamous cell carcinoma

Priya Koppikar et al. Clin Cancer Res. .

Abstract

Purpose: Increased expression and/or activation of epidermal growth factor receptor (EGFR) is associated with tumor progression and poor prognosis in many cancers, including head and neck squamous cell carcinoma (HNSCC). Src family kinases, including c-Src, mediate a variety of intracellular or extracellular signals that contribute to tumor formation and progression. This study was undertaken to elucidate the role of c-Src in the growth and invasion of HNSCC and to determine the effects of combined targeting of EGFR and Src kinases in HNSCC cell lines.

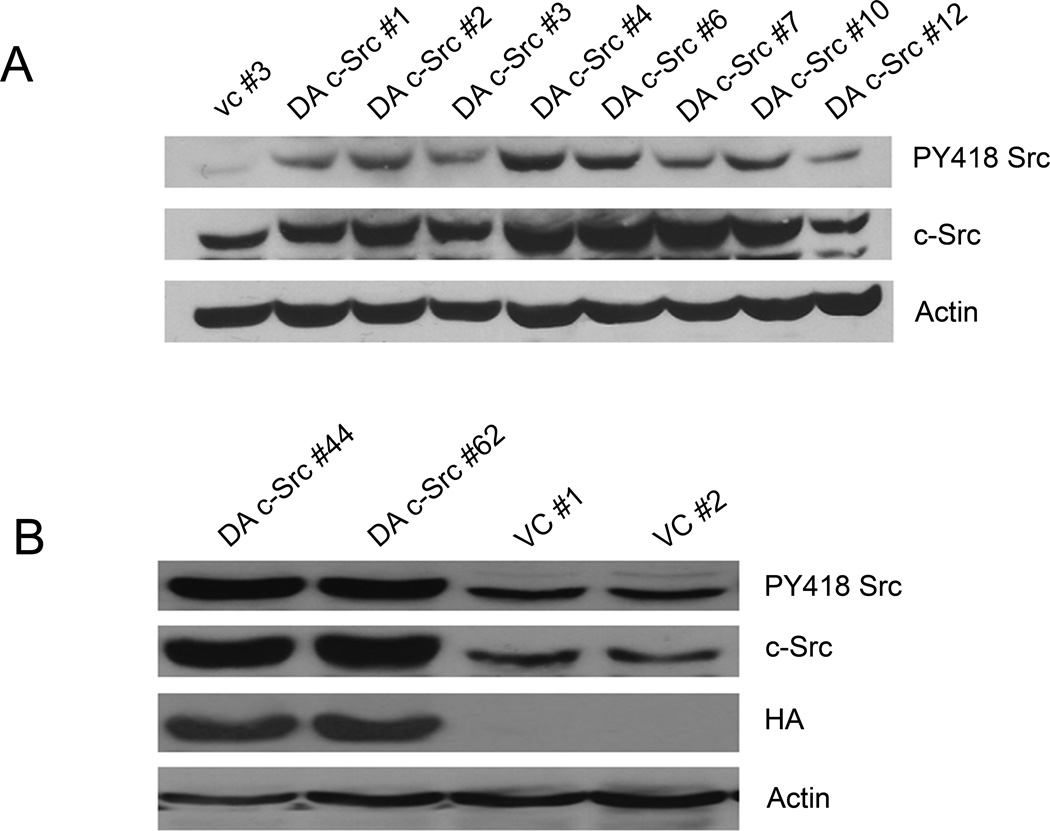
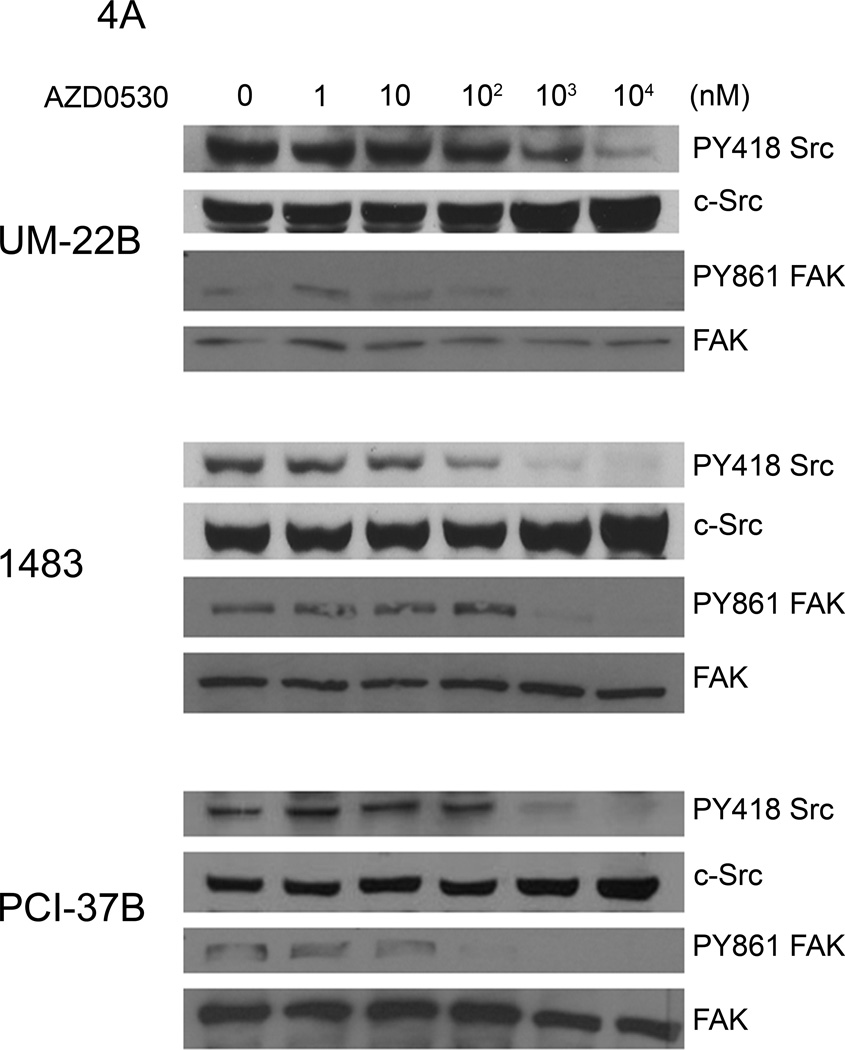
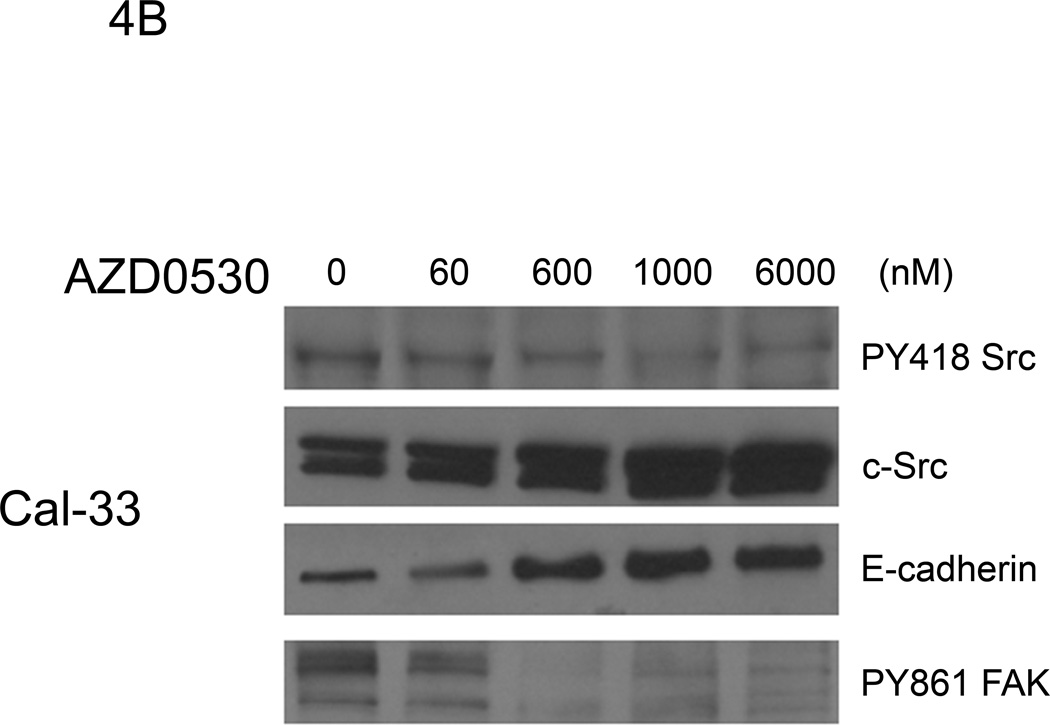
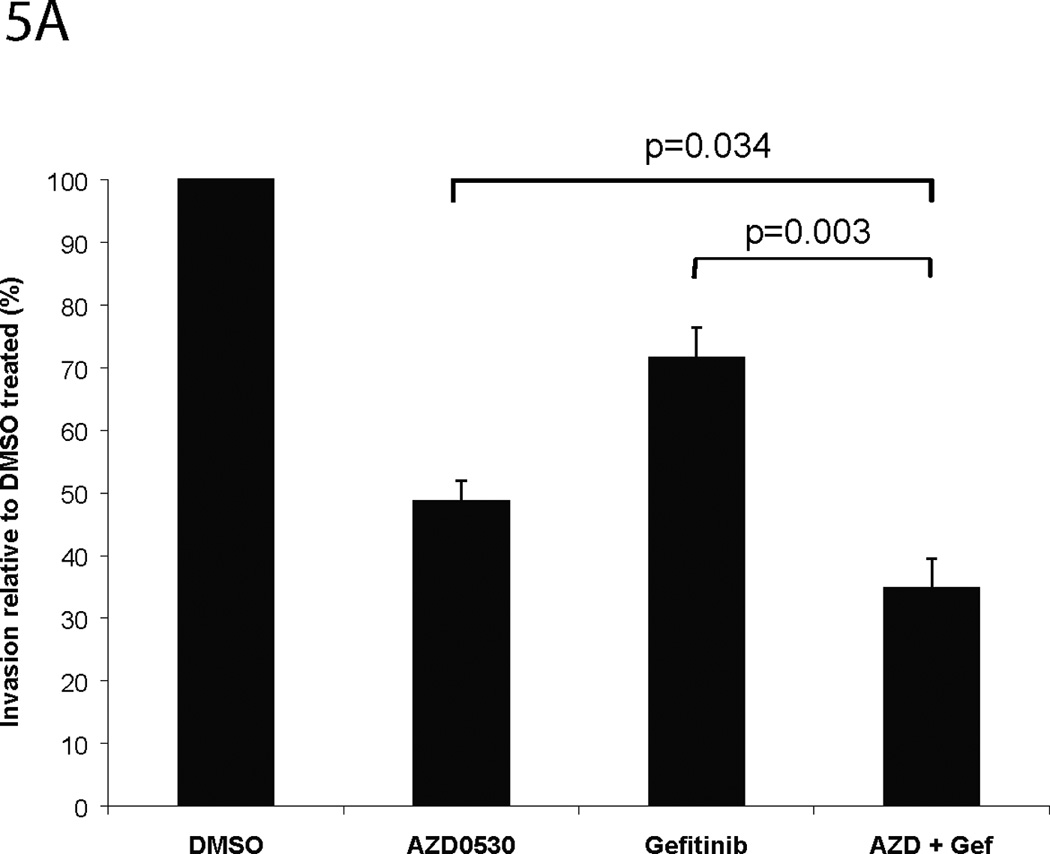
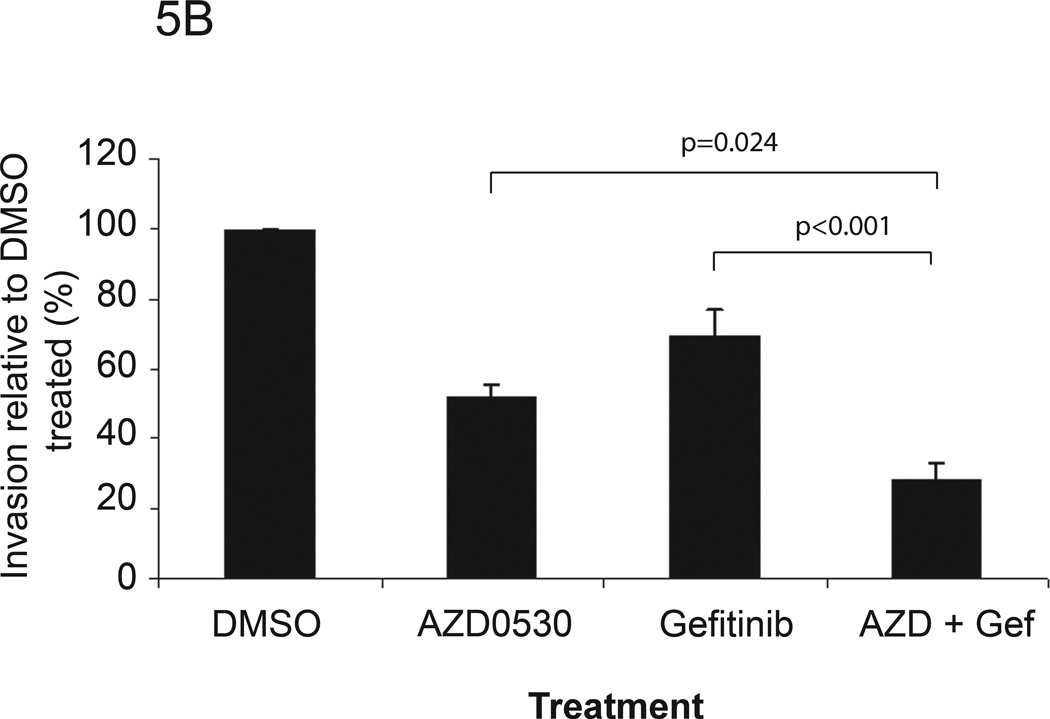
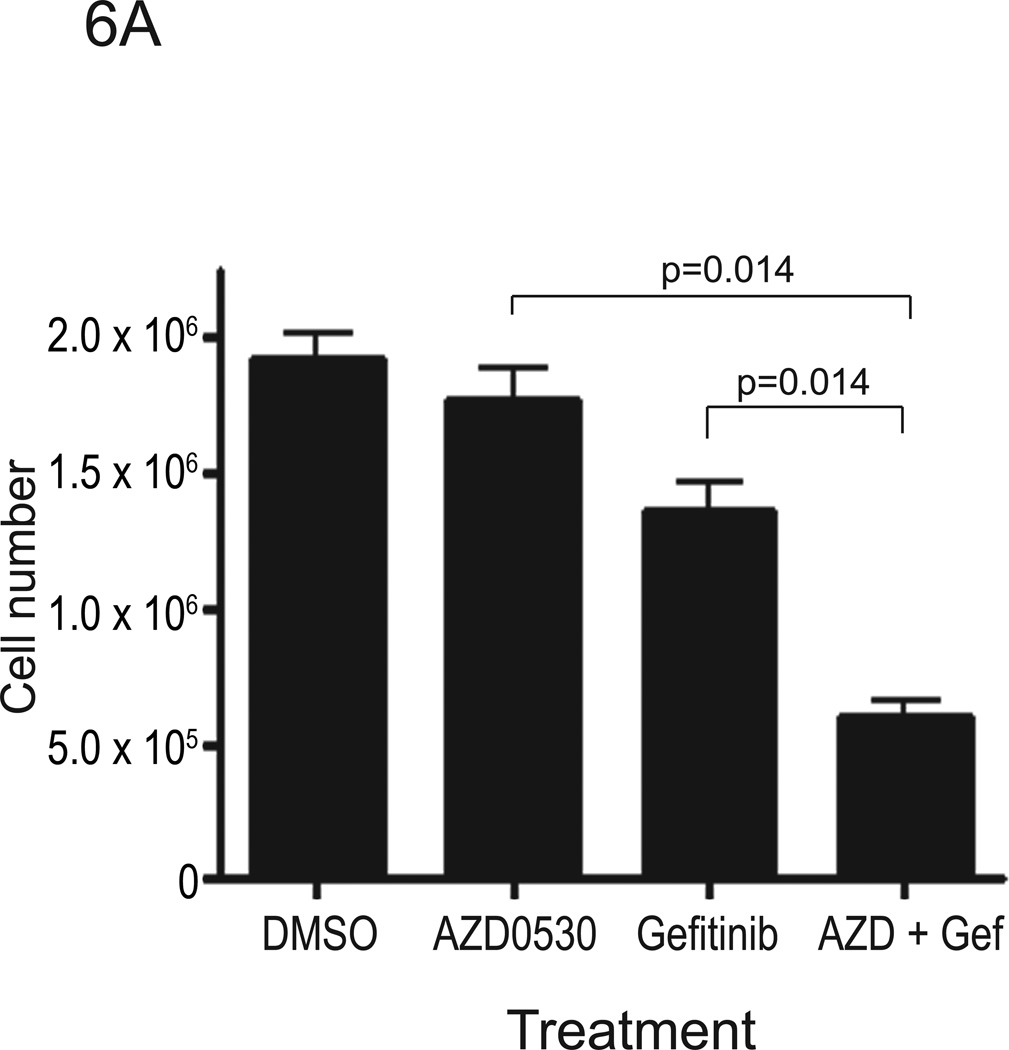
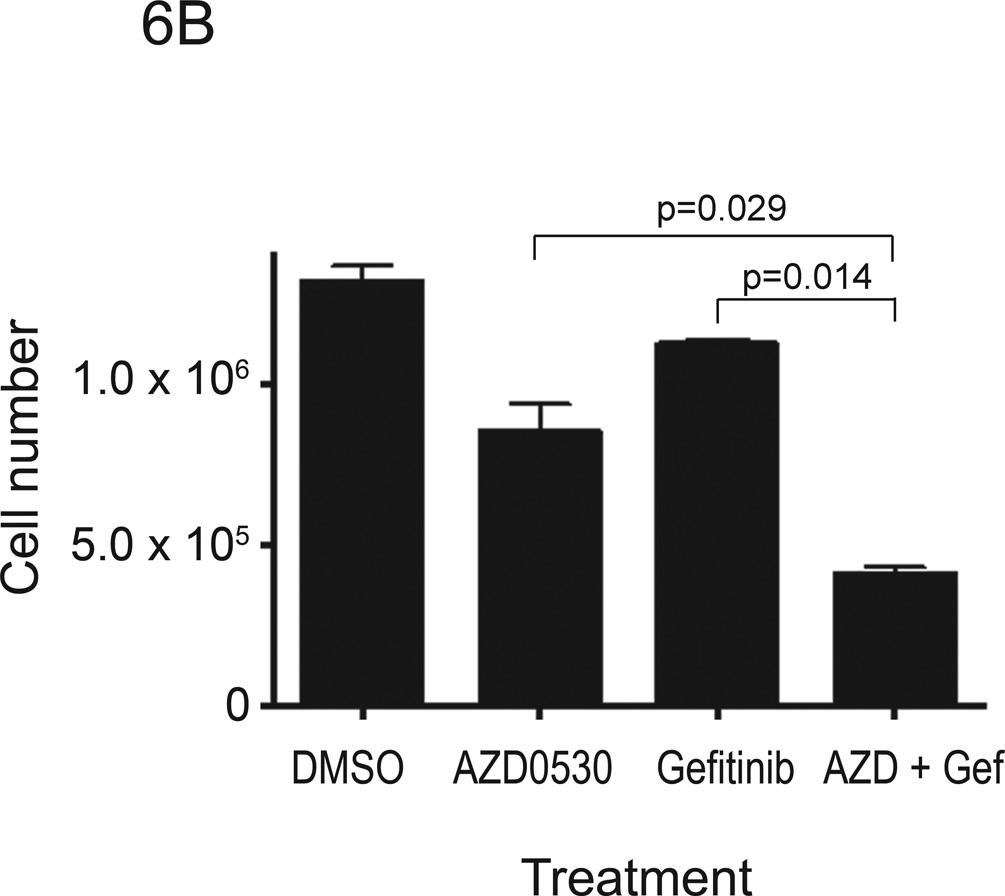
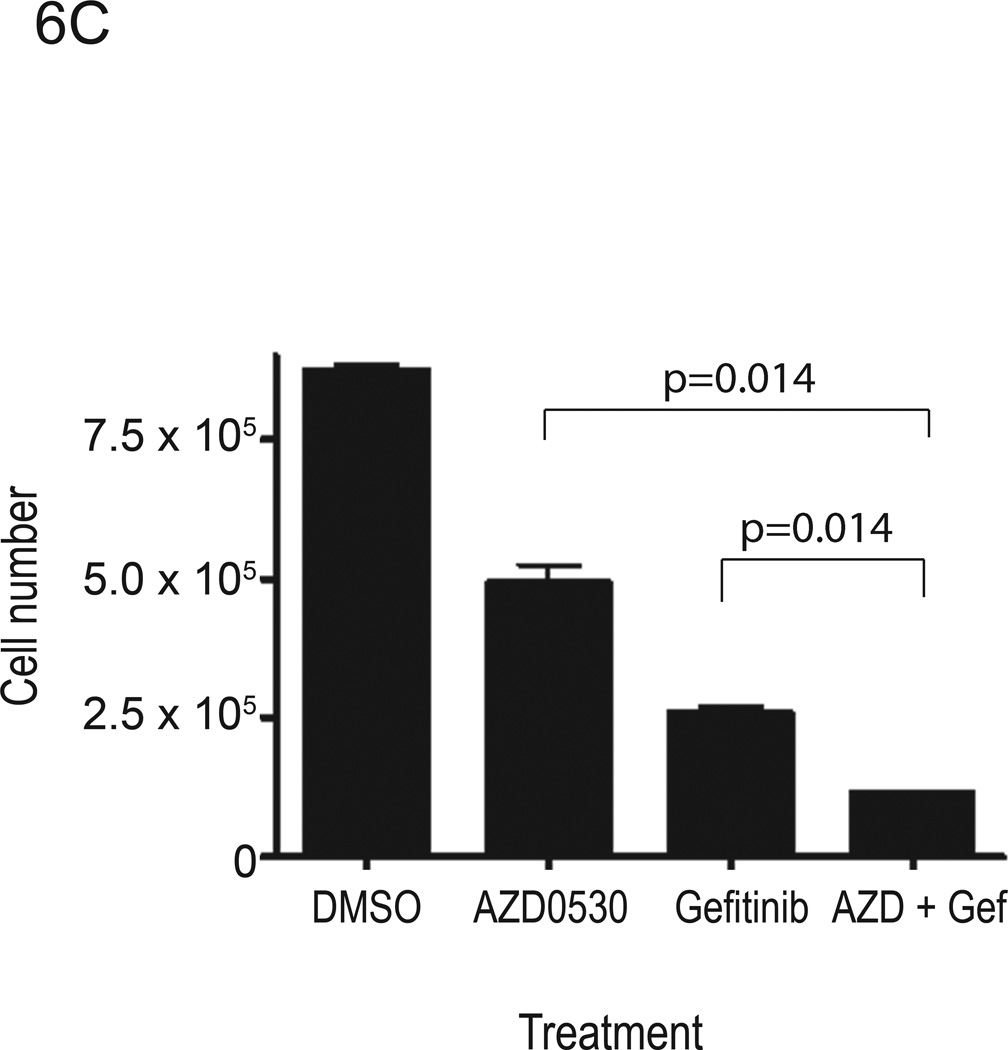
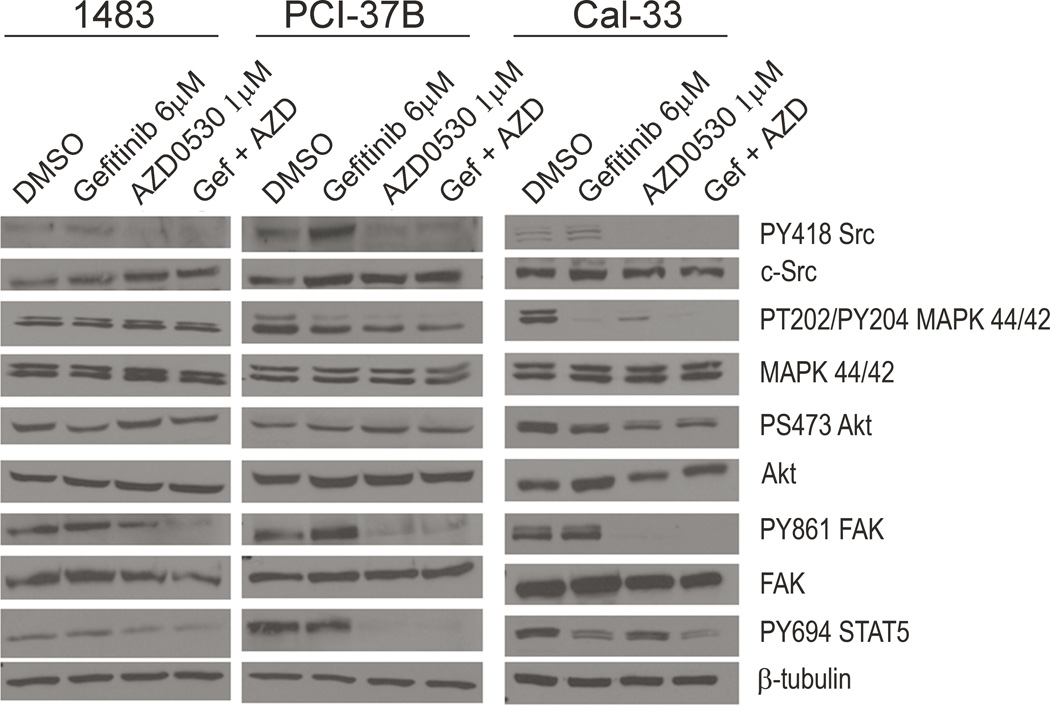
Experimental design: HNSCC cells were engineered to stably express a dominant-active form of c-Src and investigated in cell growth and invasion assays. The biochemical effects of combined treatment with the Src inhibitor AZD0530, a potent, orally active Src inhibitor with Bcr/Abl activity, and the EGFR kinase inhibitor gefitinib were examined, as well as the consequences of dual Src/EGFR targeting on the growth and invasion of a panel of HNSCC cell lines.

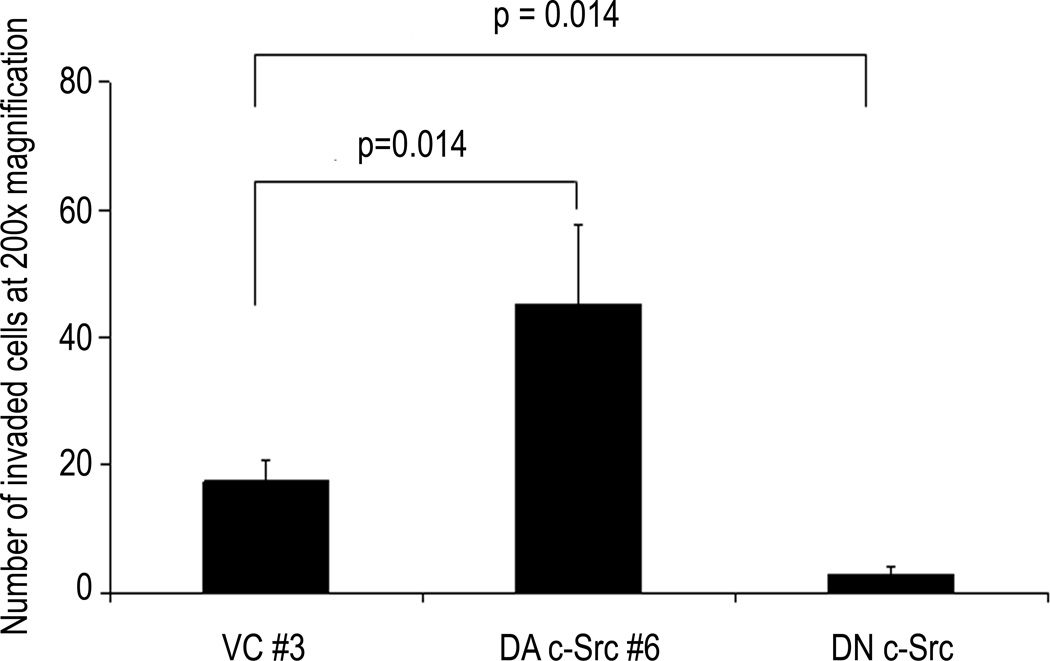
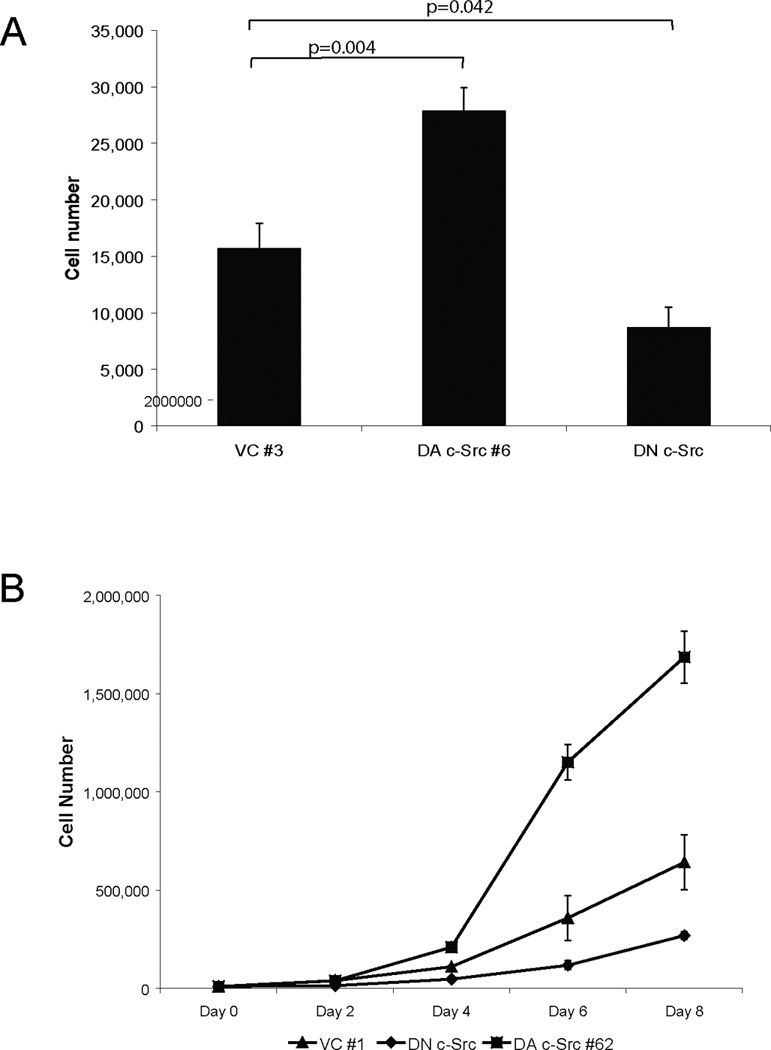
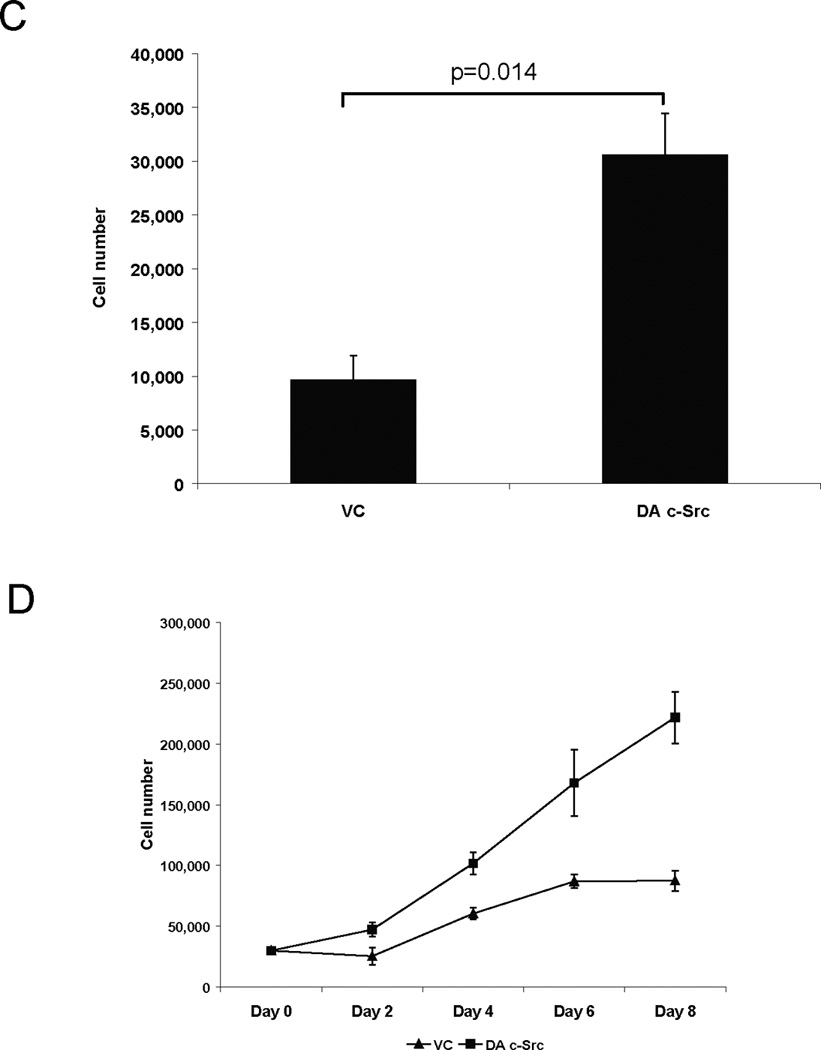
Results: HNSCC cells expressing dominant-active c-Src showed increased growth and invasion compared with vector-transfected controls. Combined treatment with AZD0530 and gefitinib resulted in greater inhibition of HNSCC cell growth and invasion compared with either agent alone.

Conclusions: These results suggest that increased expression and activation of c-Src promotes HNSCC progression where combined targeting of EGFR and c-Src may be an efficacious treatment approach.


Figures

Figure 1
Figure 1. Characterization of dominant-active (DA) c-Src clones
(A) HNSCC cells (1483) were transfected with a DA c-Src construct (Upstate Biotechnology) followed by isolation of stable clones in G418-containing media (400 µg/ml). Expression of Tyr 418 phosphorylation and total c-Src were examined by immunoblotting with pY418 Src antibody (BioSource International, Camarillo, CA) and anti-c-Src antibody (Santa Cruz Biotechnology, Inc., Santa Cruz, CA). Actin is shown as a control for loading (Oncogene Research Products, Boston, MA). (B) Additional HA-tagged DA c-Src clones were generated in 1483 cells. A representative western blot showing increased expression of pY418 Src as well as total c-Src is shown, in conjunction with expression of the HA-tag. The experiment was repeated 3 times with similar results.
Figure 2
Figure 2. Invasion of dominant-active and dominant-negative c-Src HNSCC cells
Representative vector-transfected control, DN c-Src-transfected, and DA c-Src-transfected HNSCC (1483) clones (DA c-Src #6) were serum-starved for 4 days, and then plated at a density of 5× 10³ cells/well in serum-free DMEM in Matrigel-coated inserts. Lower wells contained DMEM with 10% FBS. After 48 hours at 37°C in a 5% CO2 incubator, the cells in the insert were removed by wiping gently with a cotton swab. Cells on the reverse side of the insert were fixed and stained with Hema 3 (Fisher Scientific) according to the manufacturer’s instructions. Invading cells in 4–8 representative fields were counted using light microscopy at 200× magnification. The experiment was repeated 4 times with similar results.
Figure 3
Figure 3. Proliferation of dominant-active and dominant-negative c-Src HNSCC cells
For growth experiments, (A) representative vector-transfected (VC #3), DN c-Src-transfected, and DA c-Src-transfected HNSCC (1483 DA c-Src #6) clones were plated in 48-well plates at a density of 5 × 10³ cells/well in DMEM with 1% FBS. Cells were incubated at 37°C, 5% CO2 incubator for 3 days, followed by cell counts using trypan blue exclusion. Cumulative results are shown from 6 independent experiments, each performed in triplicate (upper panel). (B) In the lower panel, the growth kinetics of a DA c-Src transfected 1483 clone, DA c-Src clone #62 was compared over the course of 8 days with the 1483 vector-transfected control clone (VC #1) and to the DN-Src clone in low serum containing media (1% FBS). Cells (3 × 10⁴) of each clone were seeded in triplicate in 12-well plates and allowed to adhere overnight. Cell counts were carried out using trypan blue dye over the next 8 days. All data values are represented as mean ± SEM. The experiment was repeated 3 times with similar results. (C) PCI-15B cells were stably transfected with DA c-Src or vector control and plated as above in DMEM with 1% of FBS. Cells were harvested on day 4 and counted with vital dye exclusion. (D) Cell counts on days 2, 4, 6 and 8 from 3 independent experiments are represented.
Figure 4
Figure 4. The effect of increasing doses of AZD0530 on expression and activation of c-Src and FAK in HNSCC cell lines
(A) UM-22B, 1483 and PCI-37B cells were treated with AZD0530 (1–104 nM) or DMSO for 2 hours prior to lysis. Immunoblotting was performed with pY418 c-Src antibody, anti-c-Src antibody, pFAK Tyr 861 and total FAK. (B) Cal-33 cells were treated with increasing concentrations of AZD0530 (0.06–6µM) or DMSO for 2 hrs followed by immunoblotting for total and activated c-Src, E-cadherin and pFAK Y861. The experiment was performed 3 times with similar results.
Figure 5
Figure 5. Matrigel invasion assay of HNSCC cell lines treated with AZD0530 and/or gefitinib
(A) 1483 and (B) PCI-37B cells were plated in Matrigel-coated invasion chamber at a density of 1 × 10⁴ cells/well in serum-free DMEM containing DMSO, AZD0530 (1 µM), gefitinib (at IC50 value), or combination of AZD0530 and gefitinib (both at IC50 values). Lower wells contained DMEM with 10% FBS. After 48 hours of treatment at 37°C in a 5% CO2 incubator, the cells in the insert were removed by wiping gently with a cotton swab. Cells on the reverse side of the insert were fixed and stained with Hema 3 (Fisher Scientific) according to the manufacturer’s instructions. Invading cells in 4 representative fields each from 3 replicates were counted using light microscopy at 200× magnification. Cumulative data from at least 5 independent experiments for both cell lines are shown.
Figure 6
Figure 6. Proliferation assay of HNSCC cell lines treated with AZD0530 and/or gefitinib
(A) 1483, (B) PCI-37B, and (C) Cal-33 cells were plated in 12-well plates at a density of 3 × 10⁴ cells/well in DMEM with 10% FBS. After 24 hours, growth media was replaced with media containing DMSO, AZD0530 (at IC50 value), gefitinib (at IC50 value), or a combination of AZD0530 and gefitinib. On days 0, 2, 4, 6 and 8, viable cells were counted using vital dye exclusion. Four independent experiments (in triplicate) were performed for each cell line. Cell numbers on day 8 after treatment are shown.
Figure 7
Figure 7. The effect of AZD0530 and/or gefitinib on expression of total and phosphorylated c-Src, MAPK, AKT, and FAK and STAT5
HNSCC cells (1483, PCI-37B and Cal-33) were treated with DMSO, AZD0530 (at IC50 value), gefitinib (at IC50 value) or combination of AZD0530 and gefitinib (both at IC50 values) in DMEM with 10% FBS. After 2 hours, total protein was extracted prior to lysis and immunoblotting. Beta-tubulin is shown for loading control. The experiment was performed at least 2 times, with similar results.

References

    1. Leon X, Hitt R, Constenla M, et al. A retrospective analysis of the outcome of patients with recurrent and/or metastatic squamous cell carcinoma of the head and neck refractory to a platinum-based chemotherapy. Clin Oncol (R Coll Radiol) 2005;17:418–424. - PubMed
    1. Carpenter G, Cohen S. Epidermal growth factor. J Biol Chem. 1990;265:7709–7712. - PubMed
    1. Mendelsohn J, Baselga J. The EGF receptor family as targets for cancer therapy. Oncogene. 2000;19:6550–6565. - PubMed
    1. Rubin Grandis J, Melhem MF, Barnes EL, Tweardy DJ. Quantitative immunohistochemical analysis of transforming growth factor- alpha and epidermal growth factor receptor in patients with squamous cell carcinoma of the head and neck. Cancer. 1996;78:1284–1292. - PubMed
    1. Santini J, Formento JL, Francoual M, et al. Characterization, quantification, and potential clinical value of the epidermal growth factor receptor in head and neck squamous cell carcinomas. Head Neck. 1991;13:132–139. - PubMed

Publication types