

Sequential activation of a segmented ground pad reduces skin heating during radiofrequency tumor ablation: optimization via computational models
- PMID: 18595807
- PMCID: PMC2711506
- DOI: 10.1109/TBME.2008.919740
Sequential activation of a segmented ground pad reduces skin heating during radiofrequency tumor ablation: optimization via computational models
Abstract
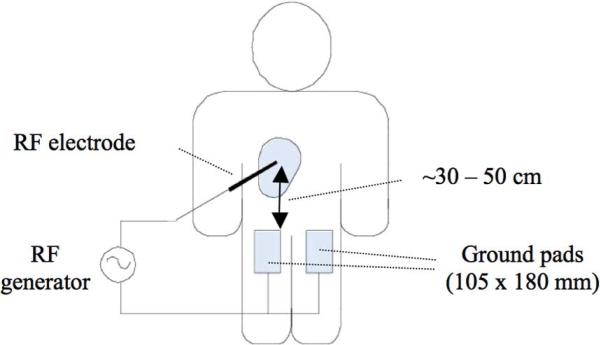
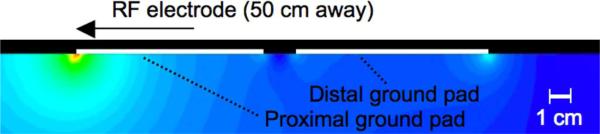
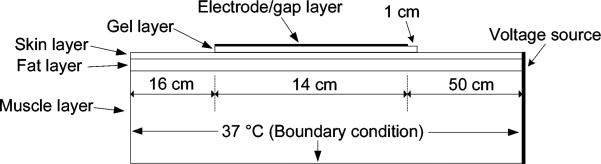
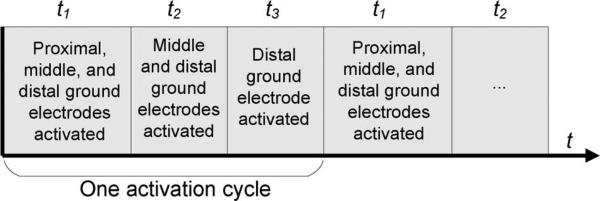
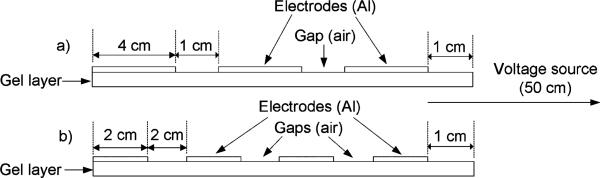
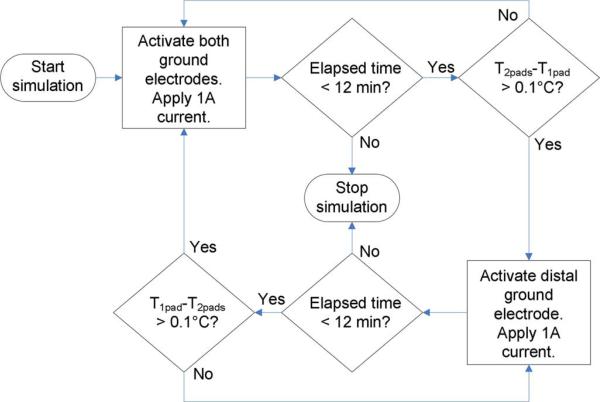
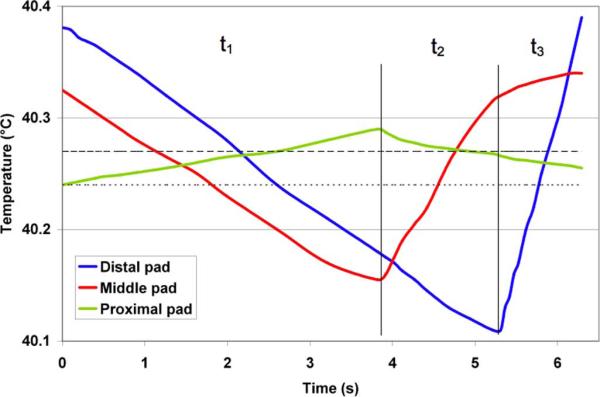
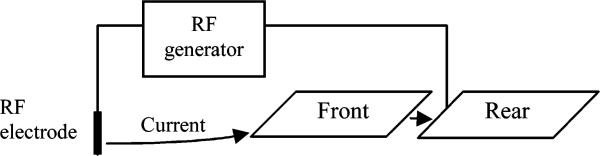
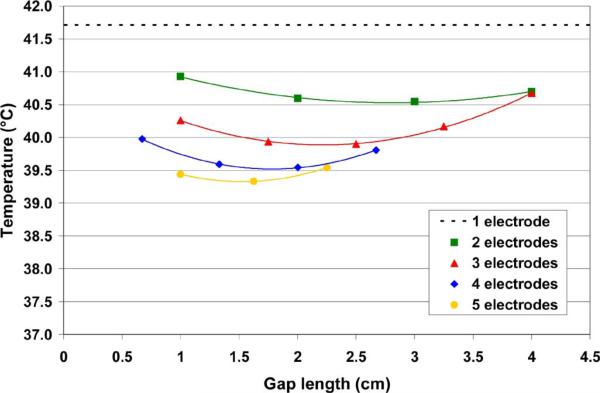
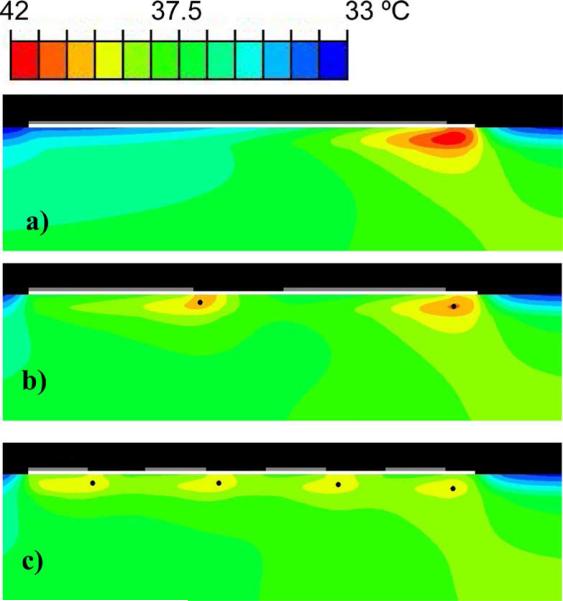
Radiofrequency (RF) ablation has become an accepted treatment modality for unresectable tumors. The need for larger ablation zones has resulted in increased RF generator power. Skin burns due to ground pad heating are increasingly limiting further increases in generator power, and thus, ablation zone size. We investigated a method for reducing ground pad heating in which a commercial ground pad is segmented into multiple ground electrodes, with sequential activation of ground electrode subsets. We created finite-element method computer models of a commercial ground pad (14 x 23 cm) and compared normal operation of a standard pad to sequential activation of a segmented pad (two to five separate ground electrode segments). A constant current of 1 A was applied for 12 min in all simulations. Time periods during sequential activation simulations were adjusted to keep the leading edge temperatures at each ground electrode equal. The maximum temperature using standard activation of the commercial pad was 41.7 degrees C. For sequential activation of a segmented pad, the maximum temperature ranged from 39.3 degrees C (five segments) to 40.9 degrees C (two segments). Sequential activation of a segmented ground pad resulted in lower tissue temperatures. This method may reduce the incidence of ground pad burns and enable the use of higher power generators during RF tumor ablation.
Figures
Similar articles
-
Sequential activation of multiple grounding pads reduces skin heating.Conf Proc IEEE Eng Med Biol Soc. 2006;2006:675-8. doi: 10.1109/IEMBS.2006.260099. Conf Proc IEEE Eng Med Biol Soc. 2006. PMID: 17945597
-
Sequential activation of multiple grounding pads reduces skin heating during radiofrequency tumor ablation.Int J Hyperthermia. 2007 Nov;23(7):555-66. doi: 10.1080/02656730701697778. Int J Hyperthermia. 2007. PMID: 18038286 Free PMC article.
-
Sequential activation of ground pads reduces skin heating during radiofrequency tumor ablation: in vivo porcine results.IEEE Trans Biomed Eng. 2010 Mar;57(3):746-53. doi: 10.1109/TBME.2009.2033385. Epub 2009 Oct 9. IEEE Trans Biomed Eng. 2010. PMID: 19822466 Free PMC article.
-
Clinical use of cooled radiofrequency ablation.J Cardiovasc Electrophysiol. 2008 Jul;19(7):769-73. doi: 10.1111/j.1540-8167.2008.01193.x. Epub 2008 May 9. J Cardiovasc Electrophysiol. 2008. PMID: 18479328 Review.
-
Radiofrequency thermal ablation of abdominal tumors: lessons learned from complications.Radiographics. 2004 Jan-Feb;24(1):41-52. doi: 10.1148/rg.241025144. Radiographics. 2004. PMID: 14730035 Review.
Cited by
-
Computer simulations of an irrigated radiofrequency cardiac ablation catheter and experimental validation by infrared imaging.Int J Hyperthermia. 2021;38(1):1149-1163. doi: 10.1080/02656736.2021.1961027. Int J Hyperthermia. 2021. PMID: 34376106 Free PMC article.
-
Considerations for thermal injury analysis for RF ablation devices.Open Biomed Eng J. 2010 Feb 4;4:3-12. doi: 10.2174/1874120701004020003. Open Biomed Eng J. 2010. PMID: 20300227 Free PMC article.
-
Sequential activation of ground pads reduces skin heating during radiofrequency ablation: initial in vivo porcine results.Annu Int Conf IEEE Eng Med Biol Soc. 2009;2009:4287-90. doi: 10.1109/IEMBS.2009.5332714. Annu Int Conf IEEE Eng Med Biol Soc. 2009. PMID: 19963820 Free PMC article.
-
MR Coagulation: A Novel Minimally Invasive Approach to Aneurysm Repair.J Vasc Interv Radiol. 2017 Nov;28(11):1592-1598. doi: 10.1016/j.jvir.2017.06.036. Epub 2017 Aug 9. J Vasc Interv Radiol. 2017. PMID: 28802550 Free PMC article.
-
Magnetic Resonance Mediated Radiofrequency Ablation.IEEE Trans Med Imaging. 2018 Feb;37(2):417-427. doi: 10.1109/TMI.2017.2753739. Epub 2017 Sep 18. IEEE Trans Med Imaging. 2018. PMID: 28922117 Free PMC article.
References
-
- Farrell MA, Charboneau WJ, DiMarco DS, Chow GK, Zincke H, Callstrom MR, Lewis BD, Lee RA, Reading CC. Imaging-guided radiofrequency ablation of solid renal tumors. AJR Amer. J. Roentgenol. 2003 Jun.180:1509–1513. - PubMed
-
- Gervais DA, McGovern FJ, Arellano RS, McDougal WS, Mueller PR. Renal cell carcinoma: Clinical experience and technical success with radio-frequency ablation of 42 tumors. Radiology. 2003 Feb.226:417–424. - PubMed
-
- Mayo-Smith WW, Dupuy DE. Adrenal neoplasms: CT-guided radiofrequency ablation—preliminary results. Radiology. 2004 Apr.231:225–230. - PubMed
-
- Rosenthal DI, Hornicek FJ, Torriani M, Gebhardt MC, Mankin HJ. Osteoid osteoma: Percutaneous treatment with radiofrequency energy. Radiology. 2003 Oct.229:171–175. - PubMed
Publication types
MeSH terms
Grants and funding
LinkOut - more resources
Full Text Sources
Other Literature Sources
Medical
