. 2008 Sep 26;283(39):26452-60.
doi: 10.1074/jbc.M801470200. Epub 2008 Jul 2.

The dynamic envelope of a fusion class II virus. E3 domain of glycoprotein E2 precursor in Semliki Forest virus provides a unique contact with the fusion protein E1

Affiliations

The dynamic envelope of a fusion class II virus. E3 domain of glycoprotein E2 precursor in Semliki Forest virus provides a unique contact with the fusion protein E1

Shang-Rung Wu et al. J Biol Chem. .

Abstract

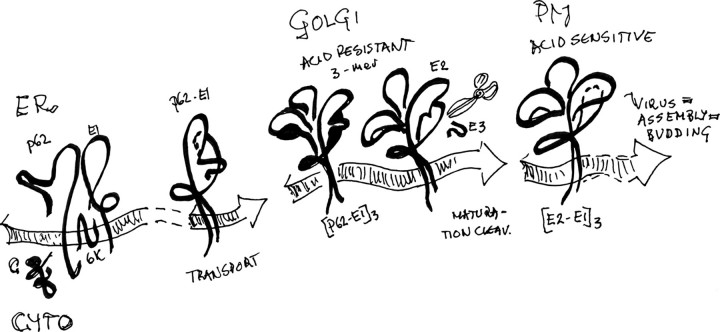
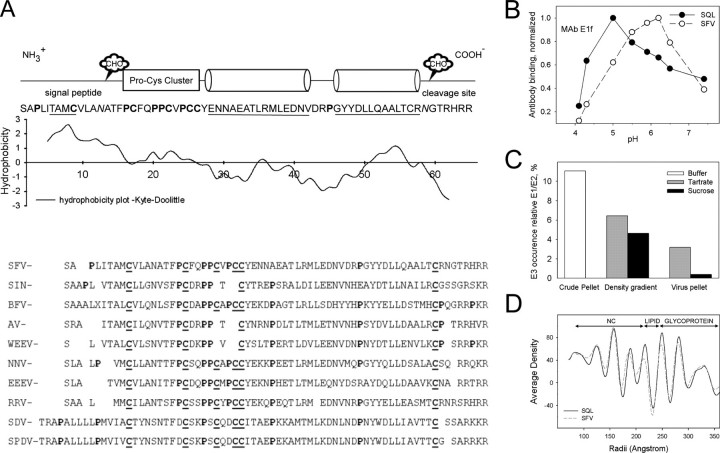
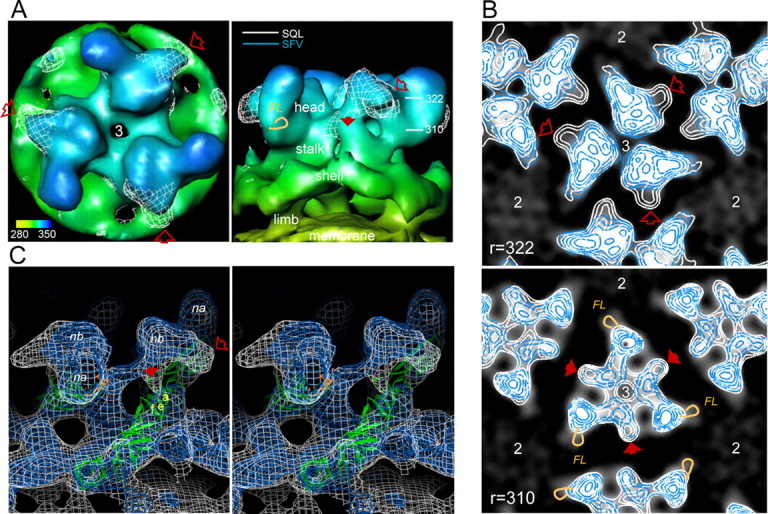
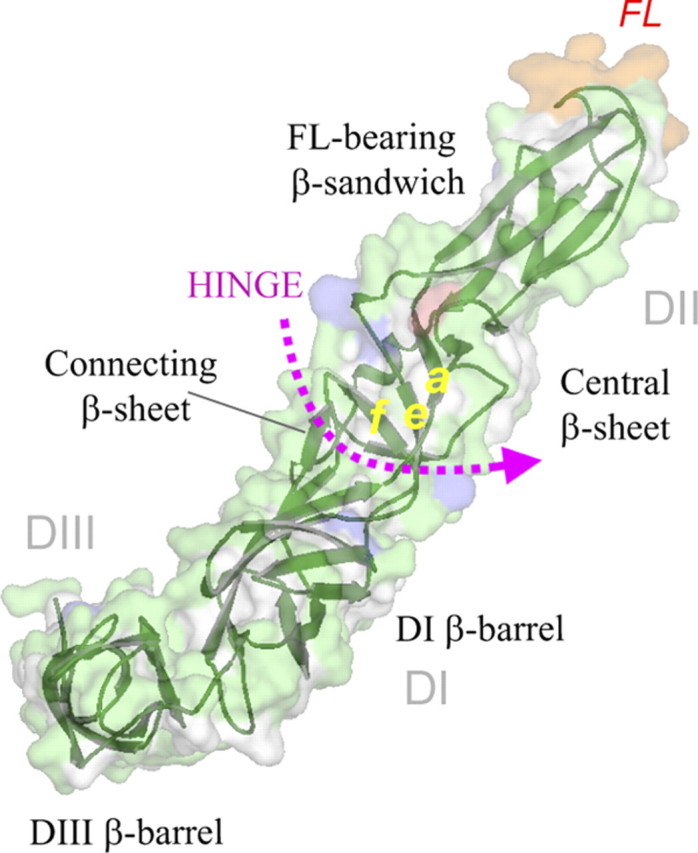
In alphaviruses, here represented by Semliki Forest virus, infection requires an acid-responsive spike configuration to facilitate membrane fusion. The creation of this relies on the chaperone function of glycoprotein E2 precursor (p62) and its maturation cleavage into the small external E3 and the membrane-anchored E2 glycoproteins. To reveal how the E3 domain of p62 exerts its control of spike functions, we determine the structure of a p62 cleavage-impaired mutant virus particle (SQL) by electron cryomicroscopy. A comparison with the earlier solved wild type virus structure reveals that the E3 domain of p62(SQL) forms a bulky side protrusion in the spike head region. This establishes a gripper over part of domain II of the fusion protein, with a cotter-like connection downward to a hydrophobic cluster in its central beta-sheet. This finding reevaluates the role of the precursor from being only a provider of a shield over the fusion loop to a structural playmate in formation of the fusogenic architecture.


Figures

SCHEME 1.
SCHEME 1.
Pathway for the formation of acid sensitive spike configuration in SFV.
FIGURE 1.
FIGURE 1.
A, structural elements in the E3 sequence. A Kyte-Doolittle hydropathy plot is shown under a schematic diagram depicting conserved structural elements of the E3 sequence in a set of alphaviruses. The sequences (accession numbers) are drawn from the Swiss Protein Data Bank (UniProtKB/Swiss-Prot): SFV (Q87051); SIN (P03316); BFV (P89946); AV (Q86925); WEEV (P13897); NNV (P22056); EEEV (P08768); RRV (P13890); SDV (Q8QL52); SPDV (Q8JJX0). SIN, Sindbis virus; BFV, Barmah Forest virus; AV, Aura virus; WEEV, Western equine encephalomyelitis virus; NNV, O'Nyong-Nyong virus; EEEV, Eastern equine encephalomyelitis virus; RRV, Ross River virus; SDV, sleeping disease virus rainbow trout; SPDV, Salmon pancreas disease virus. The conserved N-linked sugar site (CHO) in the signal peptide is indicated, as is the one close to the cleavage site occurring in SFV and a few other alphaviruses. B, pattern of fusion loop exposure relative pH in SFV WT and SQL particles. The availability of the fusion loop for external interaction was assayed using the fusion loop-specific monoclonal antibody E1f. In this ELISA, the plates were coated with equal protein amounts of purified SFV WT (SFV) or mutant (SQL) particles and blocked with bovine serum albumin. The E1f was introduced to the particles at different pH for 1 h, and the wells were then washed with a neutral buffer. Bound monoclonal antibody was quantified with the aid of a horseradish peroxidase-conjugated goat anti-mouse antibody. Maximum reading with the SQL sample (pH 5.0) was about 40% of that of the SFV WT (pH 6.2). To demonstrate the difference in pH profiles between the particles, the diagram shows the maximum-normalized readings. C, E3 content in the WT virus preparation at different stages of purification. The E3 content is measured as the amount of deglycosylated E3 relative the total spike protein content in the crude pellet, the pooled virion peak after sucrose or tartrate density gradient centrifugation, and the thereafter pelleted virions. As seen, the E3 is almost totally lost in the postgradient pellet, leaving 3% or less. D, a one-dimensional plot that shows the radial density distribution in the solved structures of SFV WT and mutant SQL. Locations of major regions of the particles are indicated above the graph.
FIGURE 2.
FIGURE 2.
A, top and side views of the 3-fold spike structure, rendered at a stringency of σ = 1. The WT structure is shown as a continuous surface with a radial color code from yellow at the top of the membrane, through green at the shell layer, to dark blue at the top of the spike. The side view shows the side toward the neighbor spike. The structure of the SQL is superimposed in a white net rendering. The two structures are essentially in good agreement in large domains of the envelope and in part of the spike structure. However, a prominent extra density in the mutant particle is protruding at the side of the spike head (open red arrow) with a trace downward along the stalk region (solid red arrow). Radial distances in Å, marked to the right in the side view panel, refer to the position of the radial cuts shown in B. The location of the fusion loop, FL, is indicated by an orange loop at the side of the spike wing. B, superimposed radial cuts through the spike head (same orientation as in A, top view) of SFV WT and SQL to reveal mutant specific configurations. A serial of virtual 6-Å radial sections through the spike head domain, from the top and downward, were made with inlaid density contours for structural stringency (σ = 1 to σ = 5). Here the ones at radii 322 and 310 Å are shown with SFV WT and SQL density contours colored in blue and white, respectively. The background is created from the WT structure, with the high density within the WT spike in opaque white to make the blue lines visible. The arrows refer to the positions marked in A and point to SQL-specific substructures (high stringency in white contours only). In the 310-Å section, the fusion loop position is indicated by orange loops in the 3-fold spike and one of the neighbor spikes. The positions of the 2- and 3-fold axes of the particle are indicated. C, high stringency renderings in stereo view. To show details of the difference between the SFV WT and SQL structures they are both rendered as transparent net surfaces at a stringency of σ = 3 and superimposed. The WT is represented by a blue net, and the SQL is shown in white. The side protrusion of the mutant is pointing out from the position of the small pointer seen in the WT structure. Compared with the side view in A, the spike is tilted and rotated to demonstrate the vertical cotter structure (solid red arrow) observed as a node among the radial sections (310 Å in B). The cotter structure goes vertically under the spike head connecting down to a narrow location in the common structure. This location is deduced from molecular fitting to be occupied by glycoprotein E1, here shown as a secondary structure schematic diagram in green, with the fusion loop in orange. The strand a, strand e, and strand f of the central β-sheet in E1 domain II are indicated in yellow. The common high stringency node a and node b of the spike structure are indicated in white as na and nb, respectively.
FIGURE 3.
FIGURE 3.
The SQL-specific high stringency cotter structure and its contact with E1 domain II. A detail of the spike is in focus to demonstrate the unique cotter node of the SQL structure. The fitted atomic structure of E1 is shown in a surface representation with surface-directed hydrophobic side chainsin white, histidyls in blue, Ser120 and Tyr122 in pale green, and Glu209 in light red. The two right panels highlight, from different angles, possible contacts between the cotter structure and E1 residues. The strands a, e, and f in the E1 central β-sheet are highlighted in yellow.
FIGURE 4.
FIGURE 4.
The nomenclature of the domains (DI–III) and β-sheets of the E1 structure. The E1 molecule (33) is viewed in the same perspective and color coding as in Fig. 3. The fusion loop is in orange.

Similar articles

Cited by

References

    1. Kielian, M. (2006) Virology 344 38–47 - PubMed
    1. Kielian, M., and Rey, F. A. (2006) Nat. Rev. Microbiol. 4 67–76 - PMC - PubMed
    1. White, J. M., Hoffman, L. R., Arevalo, J. H., and Wilson, I. A. (1997) in Structural Biology of Viruses (Chiu, W., Burnett, R. M., and Garcea, R. L., eds) pp. 80–104, Oxford University Press, Oxford
    1. Malashkevich, V. N., Singh, M., and Kim, P. S. (2001) Proc. Natl. Acad. Sci. U. S. A. 98 8502–8506 - PMC - PubMed
    1. Lau, W. L., Ege, D. S., Lear, J. D., Hammer, D. A., and DeGrado, W. F. (2004) Biophys. J. 86 272–284 - PMC - PubMed

Publication types

MeSH terms

LinkOut - more resources