. 2008 Sep;82(18):9143-53.
doi: 10.1128/JVI.00641-08. Epub 2008 Jul 2.

Autophagosome supports coxsackievirus B3 replication in host cells

Affiliations

Autophagosome supports coxsackievirus B3 replication in host cells

Jerry Wong et al. J Virol. 2008 Sep.

Abstract

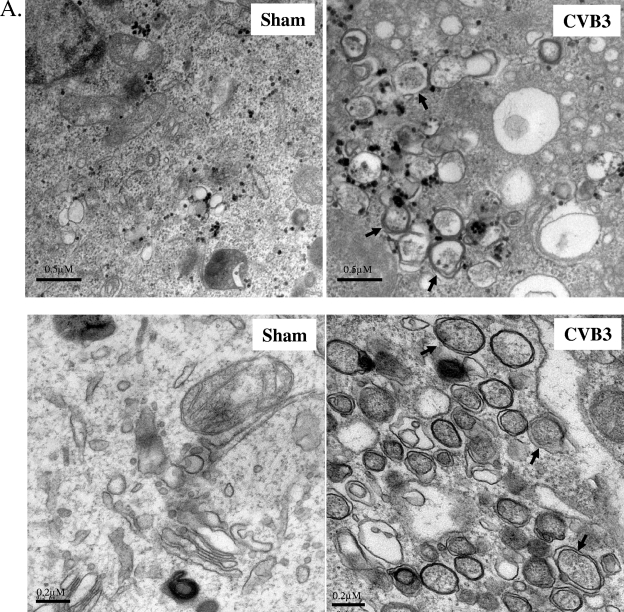
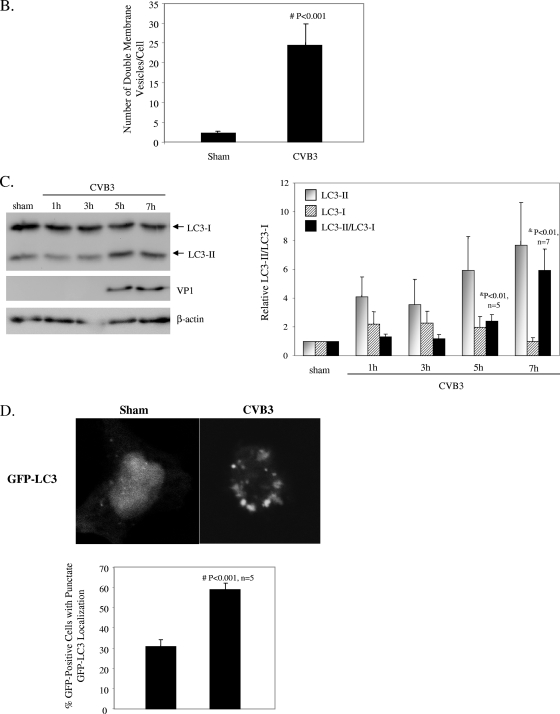
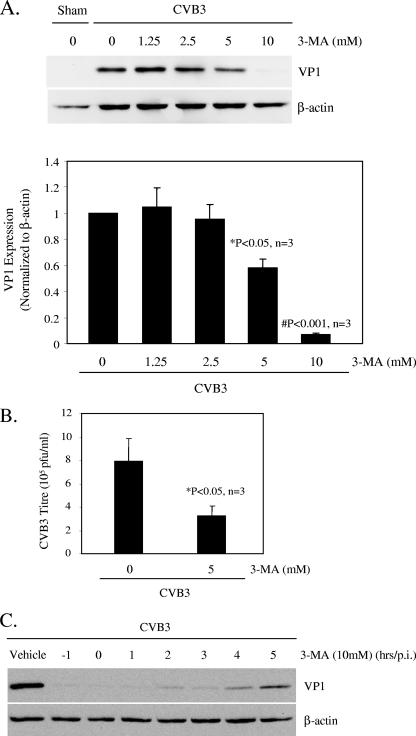
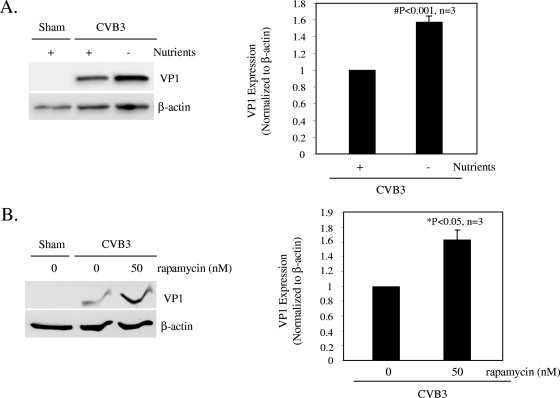
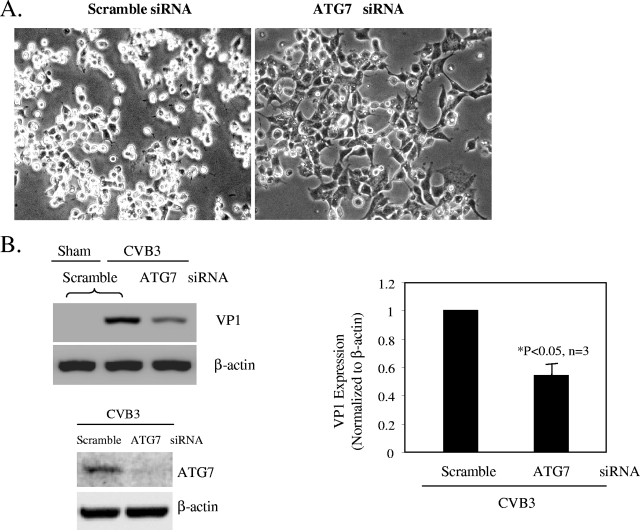
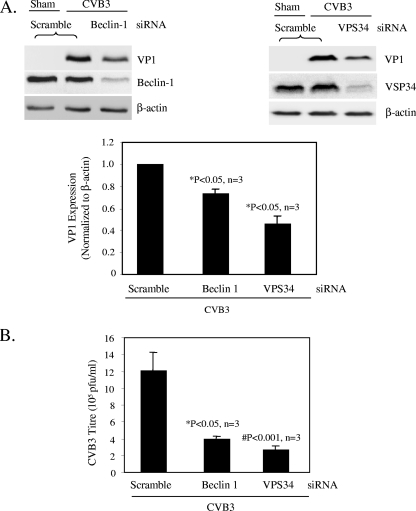
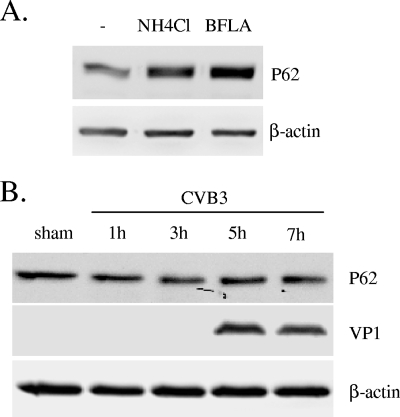
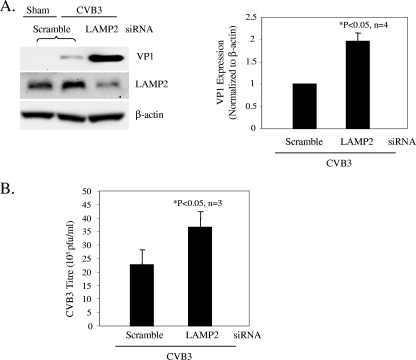
Recent studies suggest a possible takeover of host antimicrobial autophagy machinery by positive-stranded RNA viruses to facilitate their own replication. In the present study, we investigated the role of autophagy in coxsackievirus replication. Coxsackievirus B3 (CVB3), a picornavirus associated with viral myocarditis, causes pronounced intracellular membrane reorganization after infection. We demonstrate that CVB3 infection induces an increased number of double-membrane vesicles, accompanied by an increase of the LC3-II/LC3-I ratio and an accumulation of punctate GFP-LC3-expressing cells, two hallmarks of cellular autophagosome formation. However, protein expression analysis of p62, a marker for autophagy-mediated protein degradation, showed no apparent changes after CVB3 infection. These results suggest that CVB3 infection triggers autophagosome formation without promoting protein degradation by the lysosome. We further examined the role of the autophagosome in CVB3 replication. We demonstrated that inhibition of autophagosome formation by 3-methyladenine or small interfering RNAs targeting the genes critical for autophagosome formation (ATG7, Beclin-1, and VPS34 genes) significantly reduced viral replication. Conversely, induction of autophagy by rapamycin or nutrient deprivation resulted in increased viral replication. Finally, we examined the role of autophagosome-lysosome fusion in viral replication. We showed that blockage of the fusion by gene silencing of the lysosomal protein LAMP2 significantly promoted viral replication. Taken together, our results suggest that the host's autophagy machinery is activated during CVB3 infection to enhance the efficiency of viral replication.


Figures

FIG. 1.
FIG. 1.
CVB3 infection increases autophagosome formation. (A) Representative electron micrographs of sham- and CVB3-infected HeLa (top) and HEK293A (bottom) cells at 7 h postinfection. Arrows indicate representative autophagosomes that would be scored positive in panel B. (B) Quantitation of the numbers of autophagosomes in sham- and CVB3-infected HEK293A cells. Data shown represent the number of autophagosomes per cell under each condition (mean ± standard error [SE]). #, P < 0.001 compared to sham infection, by Student's t test. (C) The LC3-II/LC3-I ratio, which is a hallmark of autophagy, increases with the progression of CVB3 infection. (Left) Western blot analysis of LC3 and viral capsid protein VP1 expression in CVB3-infected cells at various times postinfection. β-Actin expression was examined as a protein loading control. (Right) Expression of LC3-II and LC3-I and ratio of LC3-II to LC3-I at the indicated times after CVB3 infection (means ± SE; n = 5 or 7 [as indicated]). LC3 expression was quantitated by densitometric analysis using NIH ImageJ v1.37 and normalized to sham infection, which was arbitrarily set to a value of 1.0. &, P < 0.01 compared to sham infection. (D) Representative confocal images and quantitation of autophagosomes in GFP-LC3-transfected HEK293A cells after CVB3 infection. HEK293A cells were transfected with GFP-LC3 plasmid for 24 h, followed by CVB3 infection. The GFP fluorescence was analyzed by confocal fluorescence microscopy. The percentage of cells with punctate GFP-LC3 localization relative to all GFP-positive cells was calculated and is presented as the mean ± SE (n = 5). #, P < 0.001 compared to sham infection.
FIG. 1.
FIG. 1.
CVB3 infection increases autophagosome formation. (A) Representative electron micrographs of sham- and CVB3-infected HeLa (top) and HEK293A (bottom) cells at 7 h postinfection. Arrows indicate representative autophagosomes that would be scored positive in panel B. (B) Quantitation of the numbers of autophagosomes in sham- and CVB3-infected HEK293A cells. Data shown represent the number of autophagosomes per cell under each condition (mean ± standard error [SE]). #, P < 0.001 compared to sham infection, by Student's t test. (C) The LC3-II/LC3-I ratio, which is a hallmark of autophagy, increases with the progression of CVB3 infection. (Left) Western blot analysis of LC3 and viral capsid protein VP1 expression in CVB3-infected cells at various times postinfection. β-Actin expression was examined as a protein loading control. (Right) Expression of LC3-II and LC3-I and ratio of LC3-II to LC3-I at the indicated times after CVB3 infection (means ± SE; n = 5 or 7 [as indicated]). LC3 expression was quantitated by densitometric analysis using NIH ImageJ v1.37 and normalized to sham infection, which was arbitrarily set to a value of 1.0. &, P < 0.01 compared to sham infection. (D) Representative confocal images and quantitation of autophagosomes in GFP-LC3-transfected HEK293A cells after CVB3 infection. HEK293A cells were transfected with GFP-LC3 plasmid for 24 h, followed by CVB3 infection. The GFP fluorescence was analyzed by confocal fluorescence microscopy. The percentage of cells with punctate GFP-LC3 localization relative to all GFP-positive cells was calculated and is presented as the mean ± SE (n = 5). #, P < 0.001 compared to sham infection.
FIG. 2.
FIG. 2.
CVB3 infection induces eIF2α phosphorylation. Western blot analysis of phosphorylated eIF2α and β-actin (loading control) expression was performed at the indicated times postinfection. Similar results were obtained in two independent experiments.
FIG. 3.
FIG. 3.
Autophagy inhibitor 3-MA reduces CVB3 replication. (A) (Top) Western blot analysis of viral protein VP1 and β-actin (loading control) expression 7 h following CVB3 infection, with or without 3-MA treatment, as indicated. (Bottom) VP1 expression was quantitated by densitometric analysis using NIH ImageJ v1.37 and normalized to β-actin expression. The VP1/β-actin ratio was further normalized to the CVB3-infected group without treatment, which was arbitrarily set to a value of 1.0. The data shown are means ± SE (n = 3), and significance was determined by Student's t test. *, P < 0.05; #, P < 0.001 (compared to nontreated cells). (B) Plaque assay measuring the CVB3 viral progeny titers in supernatants collected from infected cells treated with or without 3-MA. The data shown are means ± SE for three independent experiments. *, P < 0.05 compared to nontreated cells. (C) Western blot analysis of CVB3-infected cells treated with 10 mM 3-MA at different times, as indicated.
FIG. 4.
FIG. 4.
Induction of autophagy enhances viral replication. Western blot analysis of VP1 and β-actin expression was performed at 7 h postinfection. (A) Prior to CVB3 infection, cells were incubated in Hank's balanced salt solution for 2 h to induce cell starvation. (B) Cells were pretreated with rapamycin (50 nM) for 3 h. VP1 expression was quantitated, normalized, and analyzed as described in the legend to Fig. 3 (data are means ± SE; n = 3). *, P < 0.05; #, P < 0.001 (compared to nontreated cells).
FIG. 5.
FIG. 5.
Gene silencing of ATG7 by siRNA inhibits CVB3 replication. (A) Representative light microscopic images of CVB3-infected cells, with or without ATG7 siRNA transfection. (B) Western blot probing for VP1 and ATG7 expression, with or without ATG7 knockdown. VP1 expression was quantitated, normalized, and analyzed as described in the legend to Fig. 3 (data are means ± SE; n = 3). *, P < 0.05 compared to scramble siRNA-transfected cells.
FIG. 6.
FIG. 6.
Knockdown of class III PI3K components reduces CVB3 replication. (A) Western blot analysis of VP1 and Beclin-1 or VPS34 expression in CVB3-infected cells transfected with Beclin-1 (left) or VPS34 (right) siRNA prior to CVB3 infection. VP1 expression was quantitated, normalized, and analyzed as described in the legend to Fig. 3 (data are means ± SE; n = 3). *, P < 0.05 compared to scramble siRNA control. (B) Plaque assay results for scramble or Beclin-1 and VPS34 siRNA-transfected cells (means ± SE; n = 3). *, P < 0.05; #, P < 0.001 (compared to scramble siRNA-transfected cells).
FIG. 7.
FIG. 7.
Expression of p62 is not affected by CVB3 infection. (A) Western blot analysis of p62, a marker of autophagic protein degradation activity, in cells treated with the lysosome inhibitors bafilomycin A (BFLA; 0.1 μM) and NH4Cl (2.5 mM) for 16 h. (B) Expression of p62 in CVB3-infected cells at the indicated times after virus infection. Similar results were obtained in two independent experiments.
FIG. 8.
FIG. 8.
Lysosomal inhibition enhances CVB3 replication. (A) Western blot analysis of VP1 and LAMP2 expression in CVB3-infected cells transiently transfected with scramble or LAMP2 siRNA. VP1 expression was quantitated, normalized, and analyzed as described in the legend to Fig. 3 (data are means ± SE; n = 3 or 4 [as indicated]). (B) Virus titer in scramble or LAMP2 siRNA-transfected cells, determined by plaque assay (mean ± SE; n = 3). *, P < 0.05 compared to scramble siRNA control.

Similar articles

Cited by

References

    1. Alexander, D. E., S. L. Ward, N. Mizushima, B. Levine, and D. A. Leib. 2007. Analysis of the role of autophagy in replication of herpes simplex virus in cell culture. J. Virol. 8112128-12134. - PMC - PubMed
    1. Andrade, R. M., M. Wessendarp, M. J. Gubbels, B. Striepen, and C. S. Subauste. 2006. CD40 induces macrophage anti-Toxoplasma gondii activity by triggering autophagy-dependent fusion of pathogen-containing vacuoles and lysosomes. J. Clin. Investig. 1162366-2377. - PMC - PubMed
    1. Blommaart, E. F., U. Krause, J. P. Schellens, H. Vreeling-Sindelarova, and A. J. Meijer. 1997. The phosphatidylinositol 3-kinase inhibitors wortmannin and LY294002 inhibit autophagy in isolated rat hepatocytes. Eur. J. Biochem. 243240-246. - PubMed
    1. Brabec-Zaruba, M., U. Berka, D. Blaas, and R. Fuchs. 2007. Induction of autophagy does not affect human rhinovirus type 2 production. J. Virol. 8110815-10817. - PMC - PubMed
    1. Codogno, P., and A. J. Meijer. 2005. Autophagy and signaling: their role in cell survival and cell death. Cell Death Differ. 12(Suppl. 2)1509-1518. - PubMed

Publication types

MeSH terms

LinkOut - more resources