. 2008 Sep;295(3):R773-80.
doi: 10.1152/ajpregu.00727.2007. Epub 2008 Jul 2.

Prolonged hyperphagia with high-fat feeding contributes to exacerbated weight gain in rats with adult-onset obesity

Affiliations

Prolonged hyperphagia with high-fat feeding contributes to exacerbated weight gain in rats with adult-onset obesity

M K Judge et al. Am J Physiol Regul Integr Comp Physiol. 2008 Sep.

Abstract

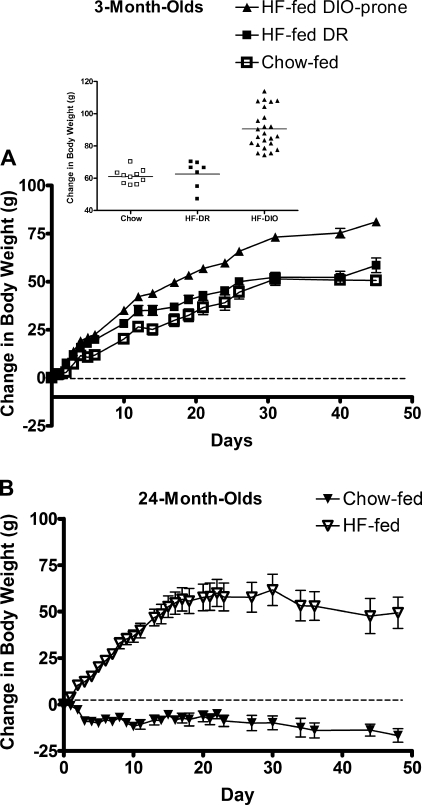
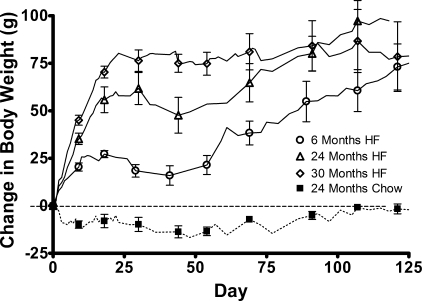
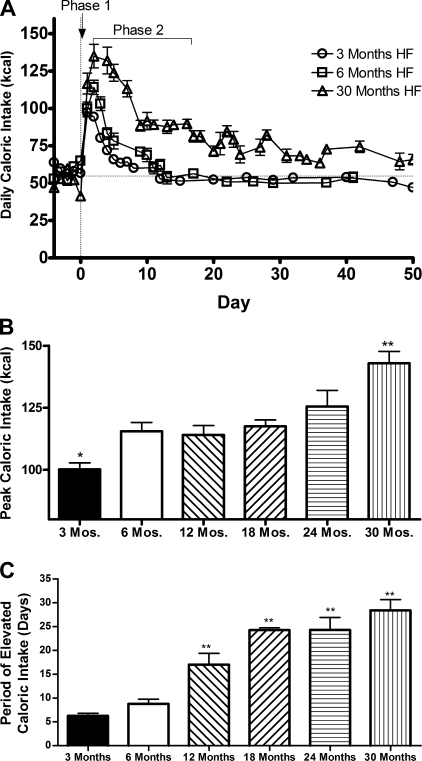
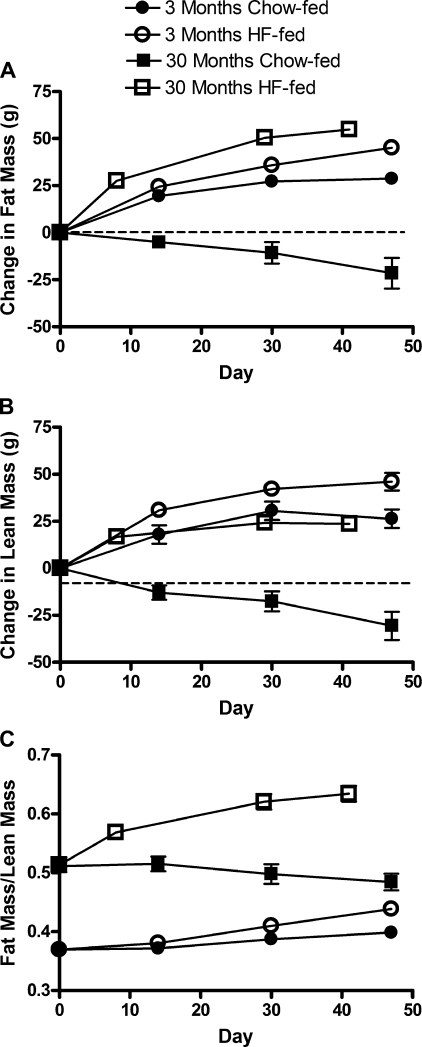
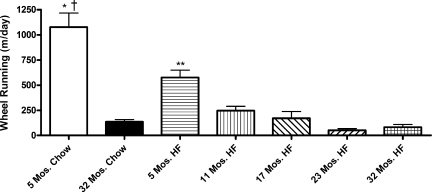
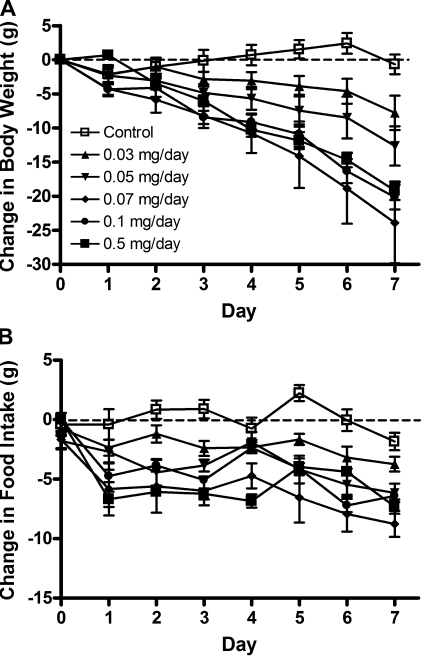
Leptin-resistant rats, when given a high-fat (HF) diet, have a delayed normalization of caloric intake and greater weight gain than those on a chow diet. Because aged, obese rats are leptin resistant, these data predict that they will also have a delayed normalization of caloric intake and exacerbated weight gain when provided a HF diet. To investigate this hypothesis, along with the consequences of a HF diet on voluntary wheel running, we compared various ages of rats on a HF or chow diet. HF-fed young rats spontaneously divided into diet-induced obese and diet-resistant rats. However, all aged rats were susceptible to the weight-gaining effects of HF feeding. Rate of initial weight gain was proportional to age, and peak caloric intake on the HF diet and the days required to normalize caloric intake to basal levels increased with age. Responsiveness to peripheral leptin before HF feeding revealed a dose-response decrease in food intake and body weight in the young but no responses in the aged to even the highest dose, 0.5 mg/day. In addition, both age and HF feeding decreased the tendency for wheel running, suggesting the propensity for inactivity with age and HF feeding may contribute to age-related obesity and accelerate the rate of diet-induced obesity. These results demonstrate that aged rats are more susceptible to the detrimental effects of a HF diet.


Figures

Fig. 1.
Fig. 1.
A: body weight gain in young rats on chow (open symbols) or high-fat (HF) (solid symbols) diet. Values are means ± SE of HF-fed diet-induced obese (DIO)-prone (n = 24, triangles), HF-fed diet-resistant (DR) (n = 8, solid squares), and chow-fed rats (n = 10, open squares). Inset: young rats were either prone or resistant to the effects of the HF diet. We used the maximized value of the log likelihood as a measure of model fit (larger values indicate better fit). When we assumed one normal distribution for the chow-fed together with the HF-fed DR rats, and a separate normal distribution for the HF-fed DIO-prone rats, the model fit yielded a log likelihood value of −530 compared with −542 when one normal distribution was assumed for the chow-fed rats and one normal distribution for the all of the HF-fed rats (DIO prone plus DR). This suggests that HF-fed DR rats are more similar to the chow-fed rats than the HF-fed DIO-prone rats, and thus the latter should be considered a separate group. By day 3 on the diet, the body weight gain in HF-fed DIO-prone animals was significantly greater than that of the chow-fed group (P < 0.0001 by t-test). The change in body weight was significant between the two HF-fed groups by day 15 (P < 0.05 by ANOVA). B: body weight change in aged rats on either chow (solid triangles) or HF diet (open triangles). Values are means ± SE of chow-fed (n = 5) and HF-fed rats (n = 7). All aged rats were susceptible to the detrimental effects of the HF diet. By day 1 on the diet, the HF-fed aged animals had experienced a weight gain significantly greater than that of their chow-fed counterparts (P < 0.05 by ANOVA).
Fig. 2.
Fig. 2.
Body weight change in rats of differing ages on chow (dotted line) or HF (solid lines) diet. Values are means ± SE of 6-mo-old HF-fed (n = 5, circles), 24-mo-old HF-fed (n = 7, triangles), 30-mo-old HF-fed (n = 5, diamonds), and 24-mo-old chow-fed (n = 7, squares) rats. The 30-mo-old rats fed a HF diet experienced a body weight gain greater than that of the 6- and 24-mo-old rats fed a HF diet by day 3 (P < 0.01, one-way ANOVA) and day 5 (P < 0.01), respectively. The change in body weight was no longer significantly different between the 24- and 30-mo-old rats fed a HF diet by day 69 (P > 0.05). The change in body weight in the 3-, 24-, and 30-mo-old rats fed a HF diet was no longer significantly different by day 89 (P > 0.05) and for the duration of the experiment.
Fig. 3.
Fig. 3.
A: daily caloric intake of 3- (circles), 6- (squares), and 30-mo-old (triangles) rats on a HF diet. Values are means ± SE of 3- (n = 9), 6- (n = 5), and 30-mo-HF-fed rats (n = 5). B: the peak caloric intake after the initiation of HF feeding. Values are means ± SE of 3- (n = 24), 6- (n = 5), 12- (n = 5), 18- (n = 5), 24- (n = 7), and 30-mo-old HF-fed (n = 5) rats. P < 0.0001 for difference with age by one-way ANOVA. *P < 0.05 for the difference between 3-mo-old rats and all other ages by post hoc analysis. **P value < 0.001 for the difference between the 30-mo-old rats and all other ages by post hoc analysis. C: the days required to normalize the elevated caloric intake following HF feeding. Values are means ± SE of 3- (n = 11), 6- (n = 5), 12- (n = 5), 18- (n = 4), 24- (n = 7), and 30-mo-old HF-fed (n = 5) rats. P < 0.0001 for difference with HF feeding by one-way ANOVA. **P value < 0.001 for the difference compared with 3-mo-old rats by one-way ANOVA and post hoc.
Fig. 4.
Fig. 4.
Change in fat mass (A), change in lean mass (B), and the ratio of fat to lean mass over time (C) in 3- (circles) and 30-mo-old (squares) rats on either a HF (open symbols) or a standard chow (solid symbols) diet. Values are mean ± SE of 3-mo-old chow-fed (n = 10), 3-mo-old HF-fed (n = 12–32), 30-mo-old chow-fed (n = 4–6), and 30-mo-old HF-fed (n = 5) rats. A: P < 0.0001 for interaction, for difference with HF feeding, and for difference with age by two-way ANOVA. P < 0.001 for the difference between HF-fed aged rats and HF-fed young rats by day 30 by post hoc analysis. P < 0.01 for the difference between HF-fed young rats and chow-fed young rats by day 14 by post hoc analysis. Note: P < 0.05 for the difference between the day 0 fat mass values and the day 60 fat mass values in each age/diet group by paired T-test. B: P = 0.0003 for the interaction; P < 0.0001 for the difference with HF feeding and difference with age by two-way ANOVA. P < 0.05 for the difference between HF-fed aged rats and HF-fed young rats by day 30 by post hoc analysis. P < 0.05 for the difference between HF-fed young rats and chow-fed young rats by day 14 by post hoc analysis. Note: P < 0.01 for the difference between the day 0 lean mass values and the day 60 lean mass values in each age/diet group by paired T-test. C: P = 0.0003 for the interaction; P < 0.0001 for the difference with HF feeding and difference with age by two-way ANOVA. P < 0.001 for the difference between HF-fed aged rats and HF-fed young rats by day 14 by post hoc analysis. P < 0.05 for the difference between HF-fed young rats and chow-fed young rats by day 30 by post hoc analysis. Note: P < 0.001 for the difference between the day 0 fat/lean mass values and the day 60 fat/lean mass values in the 3-mo-old chow-fed, 3-mo-old HF-fed, and 30-mo-old HF-fed groups by paired T-test.
Fig. 5.
Fig. 5.
A: serum leptin at day 60 in 3- and 30-mo-old rats on chow or HF diets. Ages represent the age of the animal when HF or chow feeding was begun. Assessments were determined 60 days later. Values are means ± SE of 3- (n = 9–10) and 30-mo-old (n = 9–13) rats. P < 0.0001 for the difference with HF feeding and difference with age by two-way ANOVA; P = 0.0041 for the interaction. *P < 0.05 for the difference between chow-fed young and aged rats by post hoc analysis. **P < 0.001 for the difference between HF-fed young and aged rats by post hoc analysis. †P < 0.05 for the difference between chow-fed and HF-fed young rats by post hoc analysis. ††P < 0.001 for the difference between chow-fed and HF-fed aged rats by post hoc analysis. B: white adipose tissue at death from 3- and 30-mo-old rats following chow or HF feeding. Ages represent the age of the animal when HF or chow feeding was begun. Assessments were determined 60 days later. Values are means ± SE of 3- (n = 10–12) and 30-mo-old (n = 8–14) rats. P < 0.0001 for the difference with HF feeding and difference with age by two-way ANOVA. *P < 0.001 for the difference between chow-fed young and aged rats by post hoc analysis. **P < 0.001 for the difference between HF fed young and aged rats by post hoc analysis. †P < 0.001 for the difference between chow-fed and HF-fed young rats by post hoc analysis. ††P < 0.001 for the difference between chow-fed and HF-fed aged rats by post hoc analysis.
Fig. 6.
Fig. 6.
Voluntary wheel running over a 4-day period. Wheel running activity was determined 2 mo after HF or chow feeding for rats initially 3 or 30 mo of age and after 5 mo of HF or chow feeding in rats initially 6, 12, or 18 mo of age. Ages represent the age at the time of wheel running. Values are means ± SE. *P < 0.001 for the difference between 5- and 32-mo-old chow-fed rats. †P < 0.001 for the difference between 5-mo-old chow-fed and 5-mo-old HF fed rats. **P < 0.01 for the difference between 5-mo-old HF fed and all other HF-fed groups by post hoc analysis.
Fig. 7.
Fig. 7.
A: change in body weight during a 7-day peripheral leptin infusion in 3-mo-old chow-fed rats. Values are means ± SE of 7 rats per group. P < 0.0001 for the difference with leptin treatment by one-way ANOVA. Each individual dose is significantly different from control (P < 0.0002 for the difference in slope). B: change in food intake in young rats during a 7-day peripheral leptin infusion. Values are means ± SE of 3-mo-old chow-fed (n = 7 per group) rats. P < 0.0001 for the difference with leptin treatment by one-way ANOVA. P < 0.01 for the difference between control and each dose at day 7 and between control and each dose for cumulative food intake.
Fig. 8.
Fig. 8.
A: change in body weight during a 7-day peripheral leptin infusion in 30-mo-old chow-fed rats. Values are means ± SE of 7–8 per group. P = 0.9975 for the difference with leptin treatment by one-way ANOVA. B: change in food intake in aged rats during a 7-day peripheral leptin infusion. Values are means ± SE of 30-mo-old chow-fed rats (n = 7–8 per group). There was no difference (P = 0.087) in cumulative food intake with leptin treatment.

Similar articles

Cited by

References

    1. Ahima RS, Flier JS. Leptin. Annu Rev Physiol 62: 413–437, 2000. - PubMed
    1. Carter CS, Cesari M, Ambrosius WT, Hu N, Diz D, Oden S, Sonntag WE, Pahor M. Angiotensin-converting enzyme inhibition, body composition, and physical performance in aged rats. J Gerontol A Biol Sci Med Sci 59: 416–423, 2004. - PubMed
    1. Chang LT, Kras K, Suzuki K, Strasburg G, Rodgers CD, Schemmel RA. Voluntary running in male S5B/P1Ras rats fed HF or high carbohydrate diets. Physiol Behav 57: 501–508, 1995. - PubMed
    1. Coutinho AE, Fediuc S, Campbell JE, Riddell MC. Metabolic effects of voluntary wheel running in young and old Syrian golden hamsters. Physiol Behav 87: 360–367, 2006. - PubMed
    1. Eckel LA, Moore SR. Diet-induced hyperphagia in rats is influenced by sex and exercise. Am J Physiol Regul Integr Comp Physiol 287: R1080–R1085, 2004. - PubMed

Publication types

MeSH terms