. 2008 Jul 2;28(27):6760-72.
doi: 10.1523/JNEUROSCI.0643-08.2008.

Synaptic strength modulation after cortical trauma: a role in epileptogenesis

Affiliations

Synaptic strength modulation after cortical trauma: a role in epileptogenesis

Sinziana Avramescu et al. J Neurosci. .

Abstract

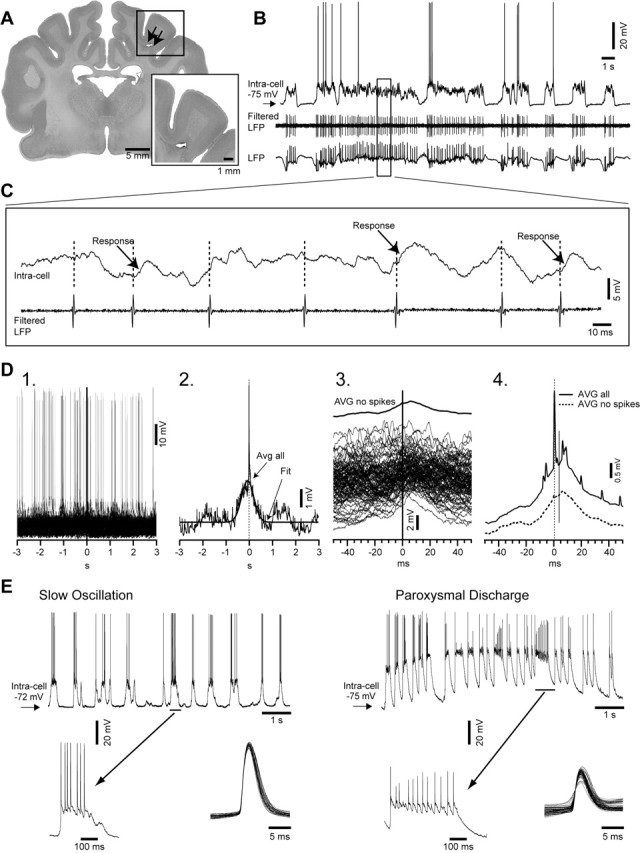
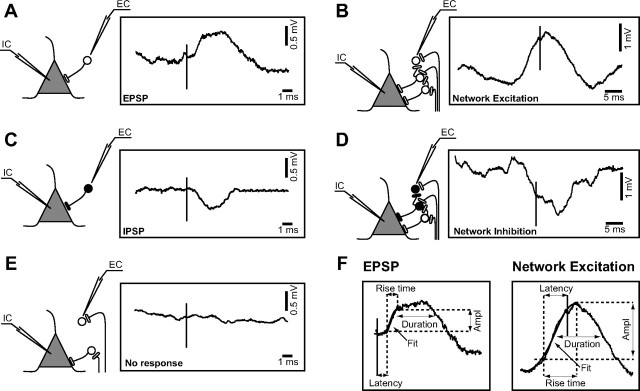
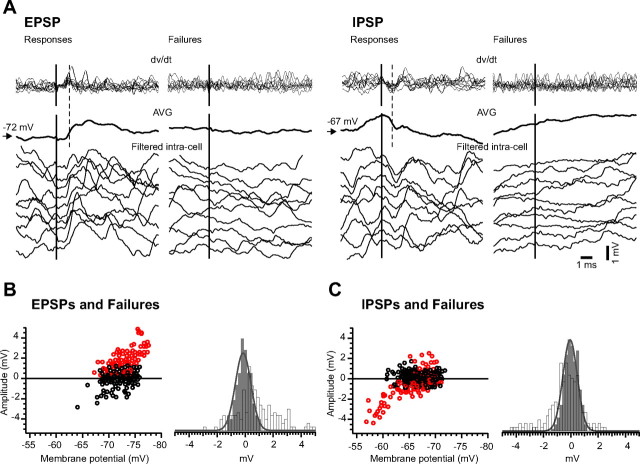
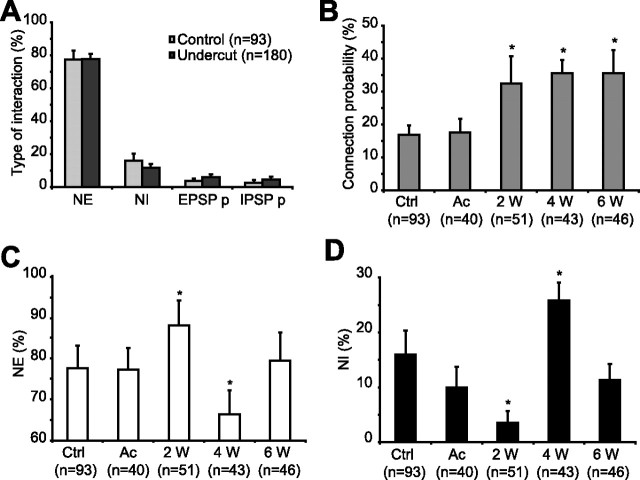
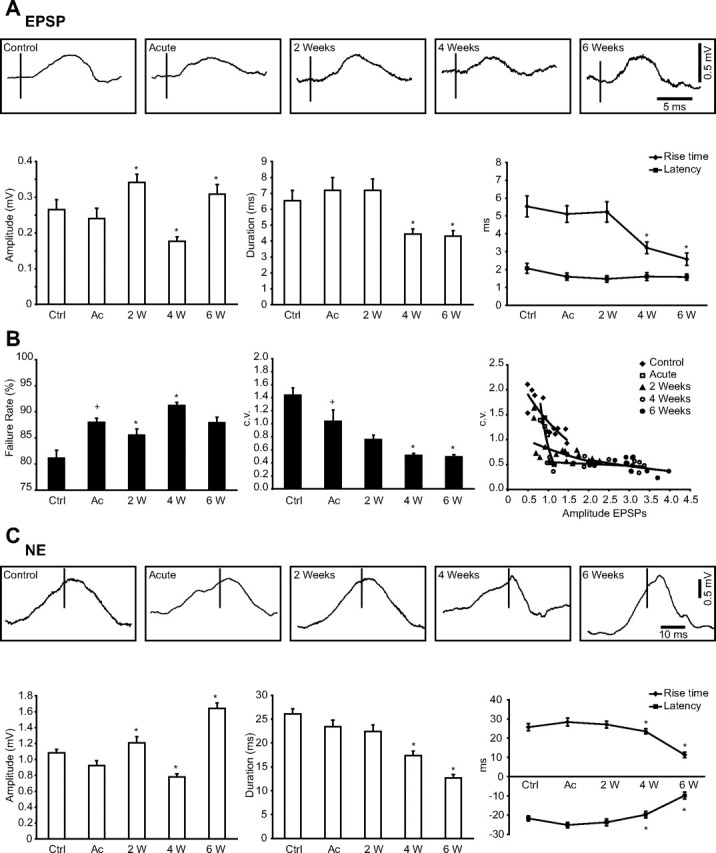
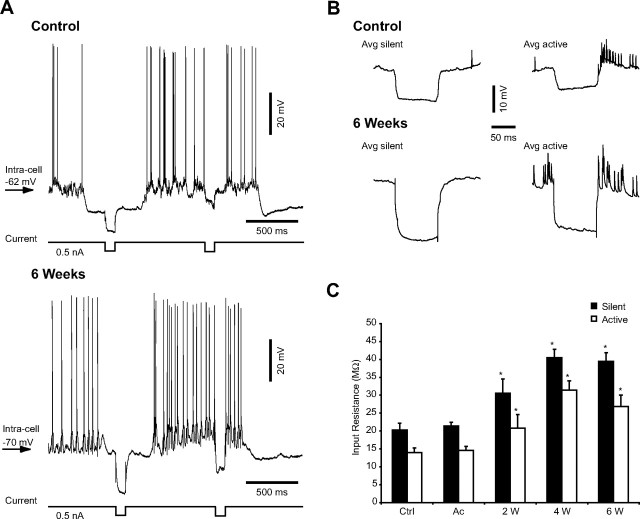
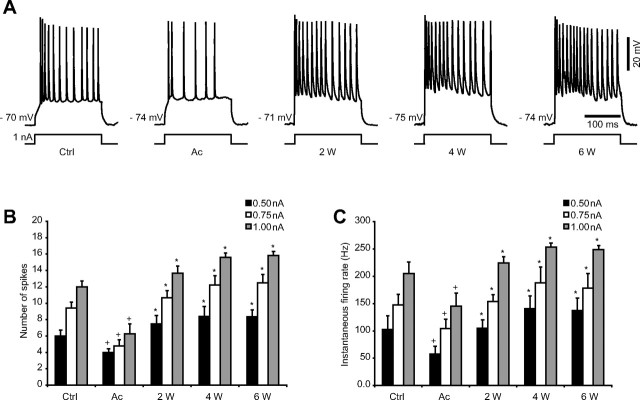
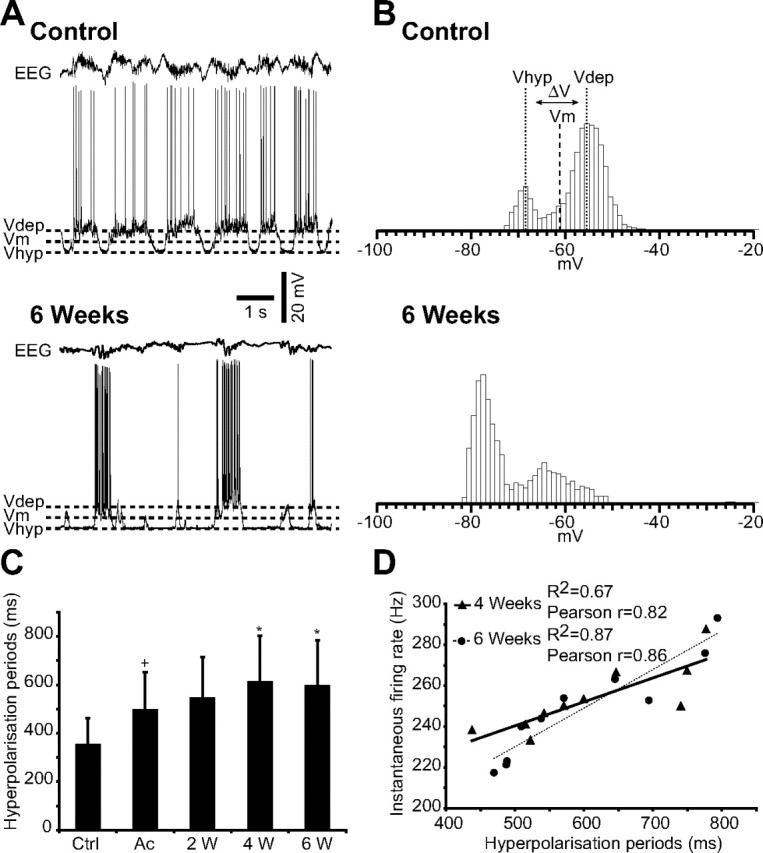
Traumatic brain injuries are often followed by abnormal hyperexcitability, leading to acute seizures and epilepsy. Previous studies documented the rewiring capacity of neocortical neurons in response to various cortical and subcortical lesions. However, little information is available on the functional consequences of these anatomical changes after cortical trauma and the adaptation of synaptic connectivity to a decreased input produced by chronic deafferentation. In this study, we recorded intracellular (IC) activities of cortical neurons simultaneously with extracellular (EC) unit activities and field potentials of neighboring cells in cat cortex, after a large transection of the white matter underneath the suprasylvian gyrus, in acute and chronic conditions (at 2, 4, and 6 weeks) in ketamine-xylazine-anesthetized cats. Using EC spikes to compute the spike-triggered averages of IC membrane potential, we found an increased connection probability and efficacy between cortical neurons weeks after cortical trauma. Inhibitory interactions showed no significant changes in the traumatized cortex compared with control. The increased synaptic efficacy was accompanied by enhanced input resistance and intrinsic excitability of cortical neurons, as well as by increased duration of silent network periods. Our electrophysiological data revealed functional consequences of previously reported anatomical changes in the injured cortex. We suggest that homeostatic synaptic plasticity compensating the decreased activity in the undercut cortex leads to an uncontrollable cortical hyperexcitability and seizure generation.


Figures

Figure 1.
Figure 1.
Experimental paradigm and methodology of analysis. A, A frontal section of cat brain (Nissl staining) depicting the large transection of the white matter under the suprasylvian gyrus (expanded in inset). Undercut is indicated by arrows. B, Simultaneous intracellular, local field potential (LFP), and unit activity (filtered LFP), in cortical area 7 left, in a ketamine–xylazine-anesthetized cat. The area designated with a rectangle is expanded in C. C, Intracellular recording (top trace) and filtered local field potential (bottom trace). Different responses related to unit activity are indicated in the recorded neuron. D1, Superimposition of multiple segments (n = 140) triggered by the spikes in the extracellularly recorded neuron. D2, Spike-triggered average (n = 140) of intracellular segments (Avg all) fitted with a Gaussian function (Fit). D3, All segments without action potentials triggered by the extracellular spikes (n = 125), extracted from the intracellular recorded neuron, together with their average (AVG no spikes). D4, The average of all intracellular segments (AVG all) and the average of the segments without action potentials triggered by the presynaptic neuron (AVG no spikes). E, Intracellular recording of the same neuron during slow oscillation period (left) and during paroxysmal discharge (right). Periods indicated by horizontal bars are expanded below. Bottom right insets show superimposition of all action potentials detected during depicted periods of slow oscillation and paroxysmal discharge. Note the smaller amplitude and the higher variability of the action potentials during paroxysmal discharge periods compared with the slow oscillation.
Figure 2.
Figure 2.
Different types of responses and possible designs of synaptic topology. A, C, Direct synaptic connections. Panels contain the scheme of a possible synaptic circuit triggering the average EPSP (n = 145) or IPSP (n = 125). The pyramidal-shaped unit depicts the cell that was recorded intracellularly (IC); the round-shaped unit symbolizes the cell recorded extracellularly (EC). Open circles and buttons designate excitatory neurons and synapses, respectively, whereas the black ones designate the inhibitory neurons and synapses. B, D, Synchronous network connections: NE (n = 178) and NI (n = 131). E, Nonresponses (n = 155). F, Methodology used for the quantification of responses. Ampl, Amplitude; Fit, sigmoid fitting.
Figure 3.
Figure 3.
Examples of responses and failures in direct synaptic connections. A, Top, Superimposition of the first derivative of the individual segments depicted as examples in the bottom panels. Middle, Averages (AVG) of all postsynaptic responses obtained from the pair of recorded neurons. Bottom, Ten individual examples of successful excitatory (left) and inhibitory (right) connection, together with examples of failures recorded in the same postsynaptic neuron. B, Amplitude of excitatory responses (open red circles) and failures (open black circles) plotted against the membrane potential, and histograms of the amplitude of responses (open bars) and background noise (gray bars) in the excitatory connection topology. C, Amplitude of inhibitory responses (open red circles) and failures (open black circles) plotted against the membrane potential, and histograms of the amplitude of responses (open bars) and network noise (gray bars) in the inhibitory connection topology. Noise histograms were fitted using a Gaussian function (plain gray line superimposed on gray histograms). Note the wider distribution to the right of the excitatory responses and of inhibitory responses to the left, compared with the network noise amplitude. The bin of the histogram is 0.2 mV.
Figure 4.
Figure 4.
Changes of synaptic interactions after cortical deafferentation. A, Variation of the type of interactions: synchronous responses (NE and NI) and direct pure EPSP (EPSP p) and pure IPSP (IPSP p) connections in control (light gray bars) and undercut cortex (dark gray bars). Note that NE was the most frequent type of response both in control and in the undercut cortex. B, Variation of connection probability (only EPSPs and IPSPs were taken into account) at different time delays after cortical injury. Note the increased connectivity in chronic undercut cortex. C, D, The incidence of NE (C) and NI (D) in control and after cortical deafferentation. Ctrl, Control; Ac, acute; W, weeks. n represents the total number of responses recorded in each group. Error bars indicate SEM. *p < 0.05, Mann–Whitney.
Figure 5.
Figure 5.
Modulation of synaptic interactions in acute and chronically deafferented cortex. A, Top, Examples of averaged postsynaptic responses for the direct synaptic connection (EPSP) in control and in undercut cortex. Bottom, Variation in amplitude, duration, rise time, and latency of EPSPs in different conditions. B, Variation of the failure rate (left) and the dynamics of the c.v. (middle) in control and after undercut. Right, Plot of the coefficient of variation versus EPSP amplitude in control and in injured cortex. The values were fitted with an exponential function. Note the smallest values of c.v. at 4 and 6 weeks after undercut, supporting the increased synaptic strength. C, Top, Examples of averaged postsynaptic responses for the synchronous excitatory synaptic connections (NE) in control and in undercut cortex. Bottom, Variation in amplitude, duration, rise time, and latency of NEs in different conditions. Ctrl, Control; Ac, acute; W, weeks. Error bars indicate SEM. +p < 0.05, Student's t test (control vs acute); *p < 0.05, Student's t test (acute vs 2, 4, and 6 weeks, respectively, after undercut).
Figure 6.
Figure 6.
Increased neuronal input resistance in chronically undercut cortex. A, Examples of intracellular recordings of an RS neuron together with the corresponding EEG during intracellularly applied hyperpolarizing current pulses in control (top) and 6 weeks after cortical injury (bottom). B, Averages (Avg) of voltage responses to five trials of hyperpolarizing current (0.5 nA, 0.1 s) during each state of the network (silent and active). The averages correspond to the neurons depicted in A. C, Increased input resistance during both silent (black bars) and active (open bars) phases of the slow oscillation in chronically injured cortex. Ctrl, Control; Ac, acute; W, weeks. Bars represent the mean input resistance from 10 different neurons for each group. Error bars indicate SEM. *p < 0.05, Student's t test.
Figure 7.
Figure 7.
Progressive increase in neuronal excitability after cortical undercut. A, Responses to depolarizing current pulses of RS neurons from control and undercut cortex. The membrane potential is indicated for each example. B, Number of spikes recorded in RS neurons in response to depolarizing current pulses of increasing intensity (0.5 nA in black, 0.75 nA in white, and 1.0 nA in gray). C, Instantaneous firing rate (reciprocal of the first interspike interval) in response to depolarizing current (0.5 nA in black, 0.75 nA in white, and 1.0 nA in gray). Note the decline of both number of spikes and instantaneous firing rate immediately after injury, followed by the progressive increase in excitability at 2, 4, and 6 weeks after trauma. Ctrl, Control; Ac, acute; W, weeks. Error bars indicate SEM. +p < 0.05, Student's t test (control vs acute); *p < 0.05, Student's t test (acute vs 2, 4, and 6 weeks, respectively, after undercut).
Figure 8.
Figure 8.
Increased duration of hyperpolarizing periods after cortical trauma. A, Intracellular recordings in control and 6 weeks after undercut, together with the corresponding EEG. Dashed lines indicate the membrane potential of the active (Vdep) and silent (Vhyp) phases of the slow oscillation, as well as the mean membrane potential (Vm). B, Histograms of the cellular membrane potential corresponding to the intracellular recordings in A. The top depicts also how the Vdep, Vhyp, and Vm were calculated. The histograms were computed for 10 s duration, with a bin of 1 mV. C, Mean duration of hyperpolarizing periods in control and after undercut (n = 10 in each group), measured during 10 s for each neuron taken into account. Ctrl, Control; Ac, acute; W, weeks. Error bars indicate SEM. +p < 0.05, Student's t test (control vs acute); *p < 0.05, Student's t test (acute vs 2, 4, and 6 weeks, respectively, after undercut). D, Correlations between the instantaneous firing rate (y-axis) and the duration of hyperpolarization periods (x-axis) at 4 weeks (triangles, correlation line solid) and at 6 weeks (circles, correlation line dotted) after cortical undercut. The coefficient of correlation R2 and the global Pearson coefficient (r) are indicated on the graph.

Comment in

Similar articles

Cited by

References

    1. Abbott LF, Nelson SB. Synaptic plasticity: taming the beast. Nat Neurosci. 2000;3(Suppl):1178–1183. - PubMed
    1. Avramescu S, Timofeev I. Synaptic synchrony modulation following cortical injury. Soc Neurosci Abstr. 2006;32:235–26.
    1. Bausch SB, He S, Petrova Y, Wang XM, McNamara JO. Plasticity of both excitatory and inhibitory synapses is associated with seizures induced by removal of chronic blockade of activity in cultured hippocampus. J Neurophysiol. 2006;96:2151–2167. - PubMed
    1. Berninger B, Schinder AF, Poo MM. Synaptic reliability correlates with reduced susceptibility to synaptic potentiation by brain-derived neurotrophic factor. Learn Mem. 1999;6:232–242. - PMC - PubMed
    1. Bladin CF, Alexandrov AV, Bellavance A, Bornstein N, Chambers B, Cote R, Lebrun L, Pirisi A, Norris JW. Seizures after stroke: a prospective multicenter study. Arch Neurol. 2000;57:1617–1622. - PubMed

Publication types

MeSH terms