

Induced deficits in speed perception by transcranial magnetic stimulation of human cortical areas V5/MT+ and V3A
- PMID: 18596160
- PMCID: PMC6670974
- DOI: 10.1523/JNEUROSCI.1287-08.2008
Induced deficits in speed perception by transcranial magnetic stimulation of human cortical areas V5/MT+ and V3A
Abstract
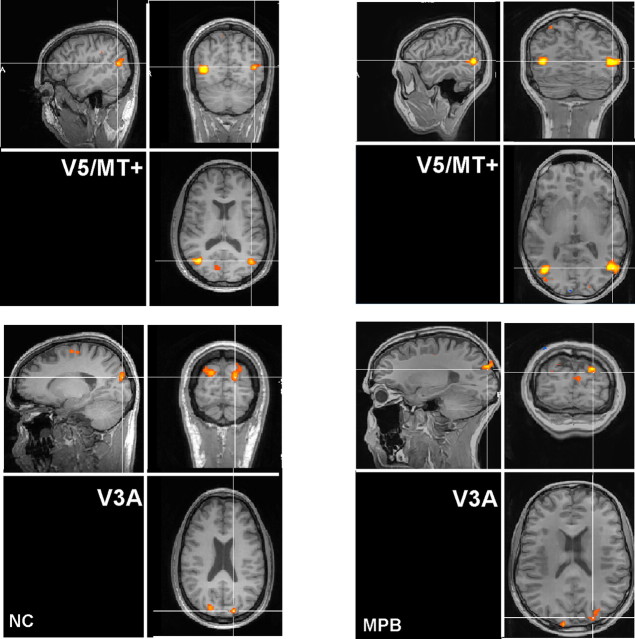
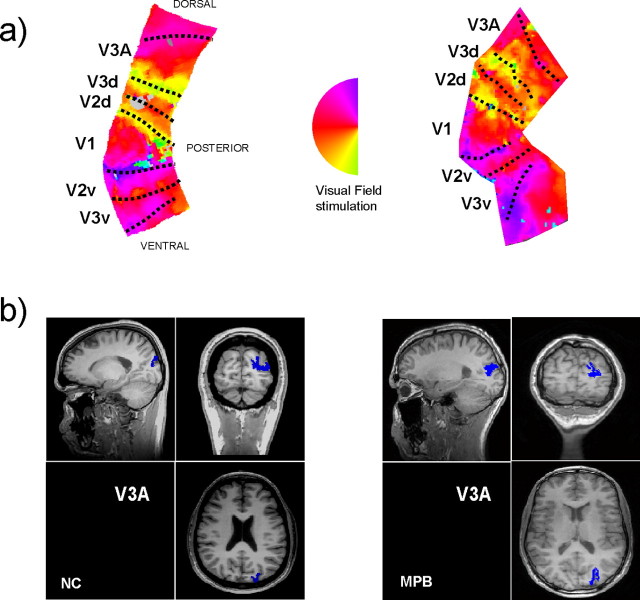
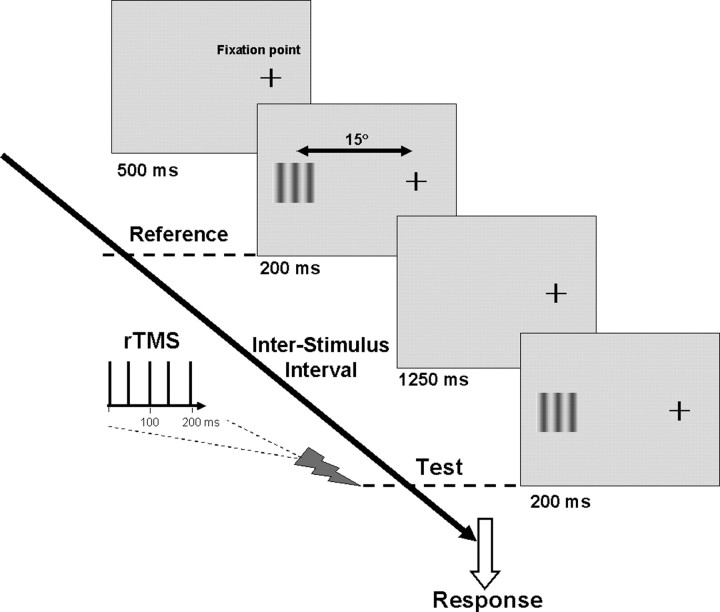
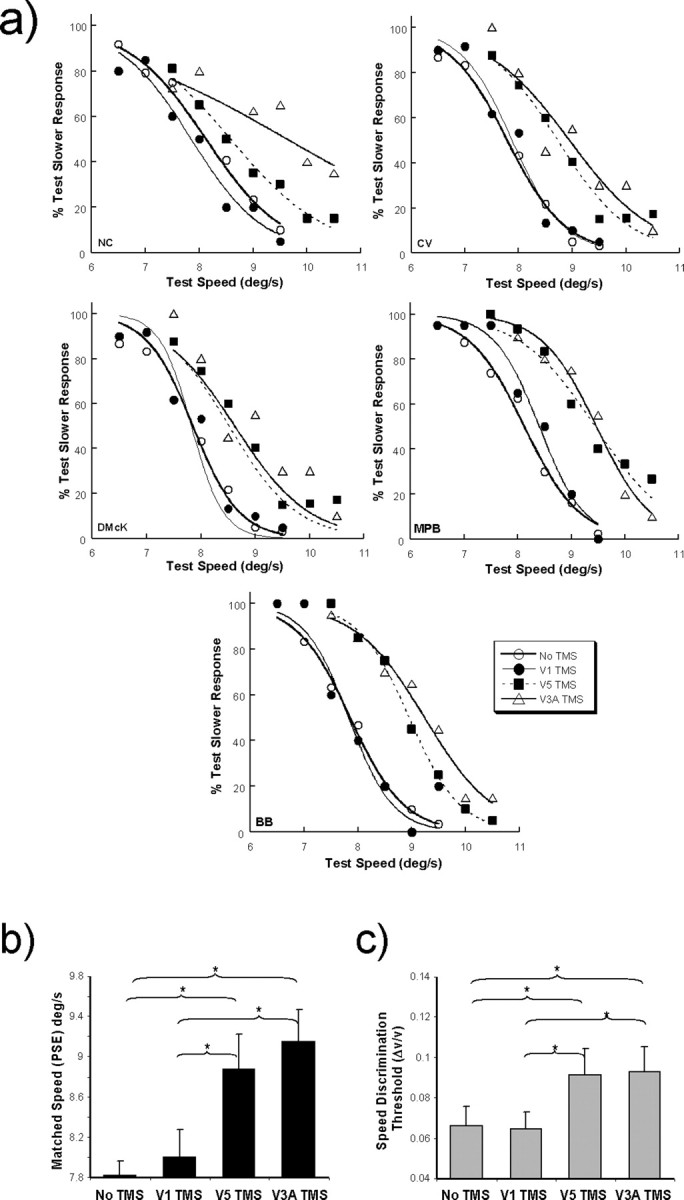
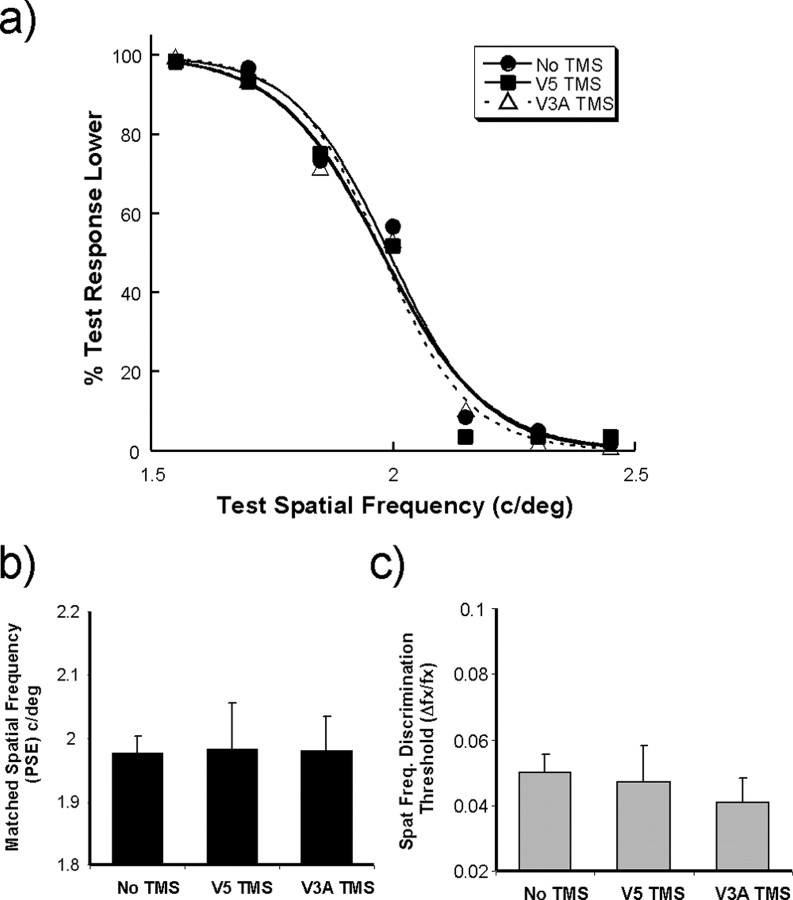
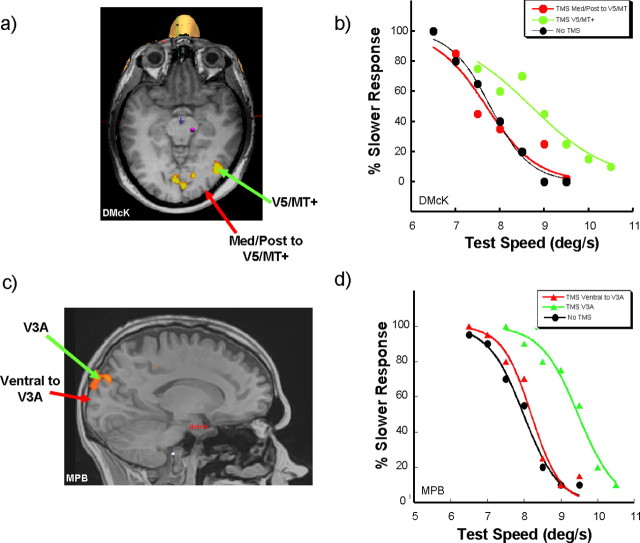
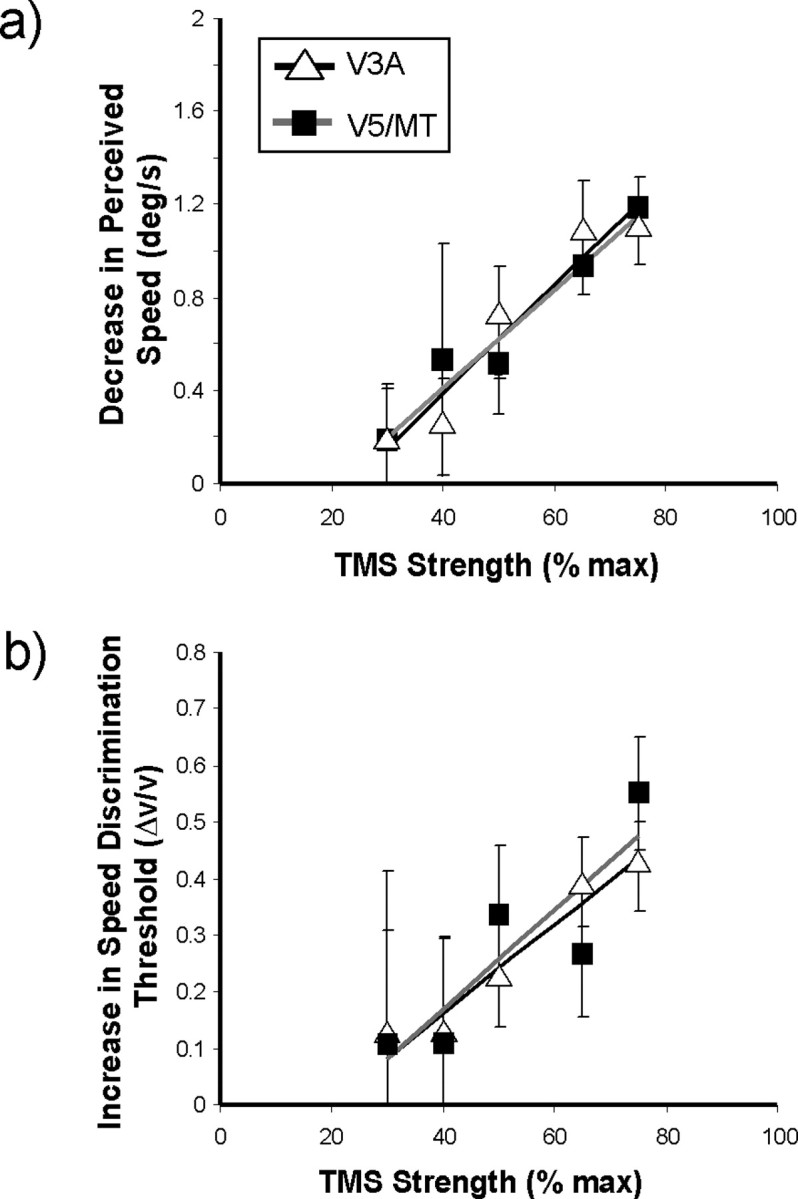
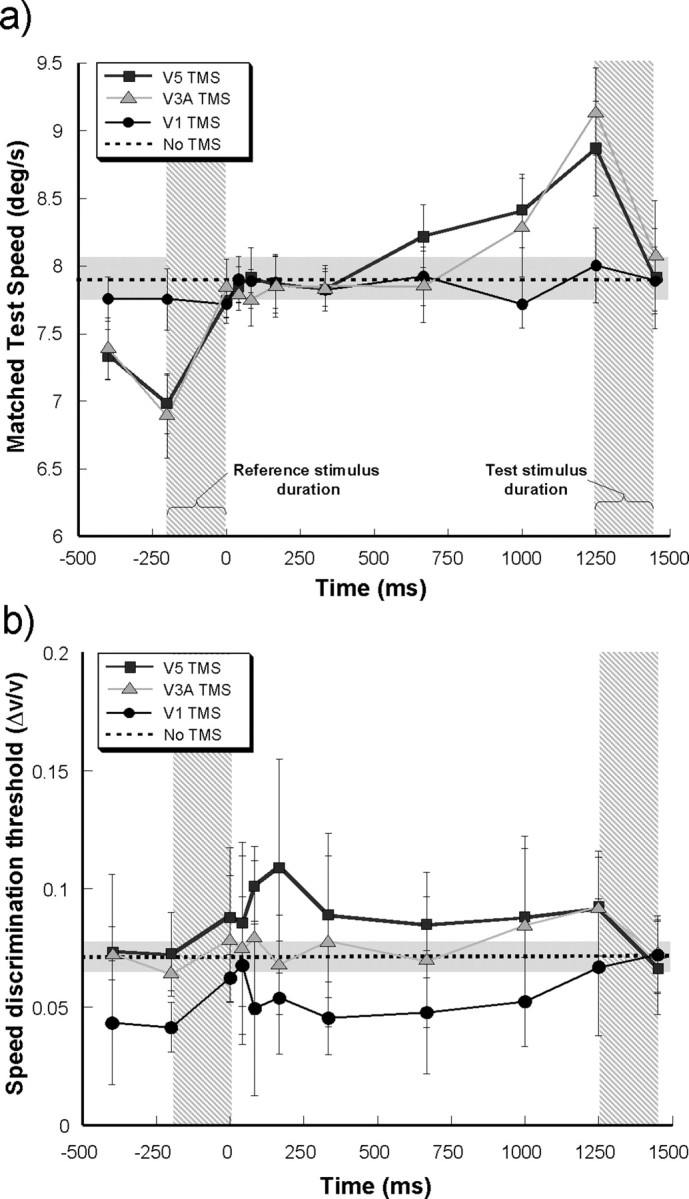
In this report, we evaluate the role of visual areas responsive to motion in the human brain in the perception of stimulus speed. We first identified and localized V1, V3A, and V5/MT+ in individual participants on the basis of blood oxygenation level-dependent responses obtained in retinotopic mapping experiments and responses to moving gratings. Repetitive transcranial magnetic stimulation (rTMS) was then used to disrupt the normal functioning of the previously localized visual areas in each participant. During the rTMS application, participants were required to perform delayed discrimination of the speed of drifting or spatial frequency of static gratings. The application of rTMS to areas V5/MT and V3A induced a subjective slowing of visual stimuli and (often) caused increases in speed discrimination thresholds. Deficits in spatial frequency discrimination were not observed for applications of rTMS to V3A or V5/MT+. The induced deficits in speed perception were also specific to the cortical site of TMS delivery. The application of TMS to regions of the cortex adjacent to V5/MT and V3A, as well as to area V1, produced no deficits in speed perception. These results suggest that, in addition to area V5/MT+, V3A plays an important role in a cortical network that underpins the perception of stimulus speed in the human brain.
Figures
Similar articles
-
Similar effects of repetitive transcranial magnetic stimulation of MT+ and a dorsomedial extrastriate site including V3A on pattern detection and position discrimination of rotating and radial motion patterns.J Vis. 2010 May 1;10(5):21. doi: 10.1167/10.5.21. J Vis. 2010. PMID: 20616130
-
The contribution of human cortical area V3A to the perception of chromatic motion: a transcranial magnetic stimulation study.Eur J Neurosci. 2010 Feb;31(3):575-84. doi: 10.1111/j.1460-9568.2010.07095.x. Epub 2010 Jan 25. Eur J Neurosci. 2010. PMID: 20105228
-
Repetitive transcranial magnetic stimulation of human MT+ reduces apparent motion perception.Neurosci Lett. 2007 Dec 18;429(2-3):131-5. doi: 10.1016/j.neulet.2007.10.002. Epub 2007 Oct 18. Neurosci Lett. 2007. PMID: 17997041
-
Human cortical areas underlying the perception of optic flow: brain imaging studies.Int Rev Neurobiol. 2000;44:269-92. doi: 10.1016/s0074-7742(08)60746-1. Int Rev Neurobiol. 2000. PMID: 10605650 Review.
-
The noninvasive dissection of the human visual cortex: using FMRI and TMS to study the organization of the visual brain.Neuroscientist. 2009 Oct;15(5):489-506. doi: 10.1177/1073858409334424. Neuroscientist. 2009. PMID: 19826171 Review.
Cited by
-
Transcranial static magnetic field stimulation over human middle temporal complex reduces spatial accuracy of continuous visuomotor performance.Sci Rep. 2025 Aug 19;15(1):30387. doi: 10.1038/s41598-025-15498-4. Sci Rep. 2025. PMID: 40830555 Free PMC article.
-
Motion Processing in Visual Cortex of Maculopathy Patients.J Neurosci. 2025 Jul 23;45(30):e0283252025. doi: 10.1523/JNEUROSCI.0283-25.2025. J Neurosci. 2025. PMID: 40467303
-
Retinotopy drives the variation in scene responses across visual field map divisions of the occipital place area.J Vis. 2024 Aug 1;24(8):10. doi: 10.1167/jov.24.8.10. J Vis. 2024. PMID: 39167394 Free PMC article.
-
Transcranial magnetic stimulation of the brain: What is stimulated? - A consensus and critical position paper.Clin Neurophysiol. 2022 Aug;140:59-97. doi: 10.1016/j.clinph.2022.04.022. Epub 2022 May 18. Clin Neurophysiol. 2022. PMID: 35738037 Free PMC article. Review.
-
Hierarchy of direction-tuned motion adaptation in human visual cortex.J Neurophysiol. 2012 Apr;107(8):2163-84. doi: 10.1152/jn.00923.2010. Epub 2012 Jan 4. J Neurophysiol. 2012. PMID: 22219027 Free PMC article. Clinical Trial.
References
-
- Allen EA, Pasley BN, Duong T, Freeman RD. Transcranial magnetic stimulation elicits coupled neural and hemodynamic consequences. Science. 2007;317:1918–1921. - PubMed
-
- Anand S, Olson JD, Hotson JR. Tracing the timing of human analysis of motion and chromatic signals from occipital to tempero-parieto-occipital cortex: a transcranial magnetic stimulation study. Vision Res. 1998;38:2619–2627. - PubMed
-
- Beckers G, Hömberg V. Cerebral visual motion blindness: transitory akinetopsia induced by transcranial magnetic stimulation of human area V5. Proc Biol Sci. 1992;249:173–178. - PubMed
-
- Beckers G, Zeki S. The consequences of inactivating areas V1 and V5 on visual motion perception. Brain. 1995;118:49–60. - PubMed
-
- Bisley JW, Paternak T. The multiple roles of cortical areas MT/MST in remembering the direction of visual motion. Cereb Cortex. 2000;10:1053–1065. - PubMed
Publication types
MeSH terms
Grants and funding
LinkOut - more resources
Full Text Sources