. 2008 Jul 2;28(27):6858-71.
doi: 10.1523/JNEUROSCI.5684-07.2008.

What grid cells convey about rat location

Affiliations

What grid cells convey about rat location

Ila R Fiete et al. J Neurosci. .

Abstract

We characterize the relationship between the simultaneously recorded quantities of rodent grid cell firing and the position of the rat. The formalization reveals various properties of grid cell activity when considered as a neural code for representing and updating estimates of the rat's location. We show that, although the spatially periodic response of grid cells appears wasteful, the code is fully combinatorial in capacity. The resulting range for unambiguous position representation is vastly greater than the approximately 1-10 m periods of individual lattices, allowing for unique high-resolution position specification over the behavioral foraging ranges of rats, with excess capacity that could be used for error correction. Next, we show that the merits of the grid cell code for position representation extend well beyond capacity and include arithmetic properties that facilitate position updating. We conclude by considering the numerous implications, for downstream readouts and experimental tests, of the properties of the grid cell code.


Figures
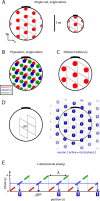
Figure 1.
Figure 1.
Schematic of mathematically salient grid cell properties. A, Single-cell activity. Left, The firing response of one dMEC neuron as a function of real-space rat position, obtained by summing the response of the cell over time while the rat explores a circular enclosure. Red, Cell firing. White, Cell quiescent. The cell fires when the rat visits the vicinity of any vertex of a virtual regular triangular lattice tiling space. The lattice is characterized by its period (blob spacing), angular orientation (lattice rotation), and phase (lattice translations, which are unique up to one unit cell). Gray diamonds, Unit cells of the lattice. Right, The lattice period is reported to be independent of the size or shape of the enclosure. B, The responses of neighboring cells (red, blue, and green) share a single lattice period and angular orientation. Their firing only differs by lattice translations or phase. C, At larger separations in dMEC, the responses of different neurons have different spatial periods. D, The instantaneous rat position (left) corresponds to the firing of one set of neurons (blue) in a dMEC lattice. The firing of these cells specifies rat position as a phase within any unit cell of the population lattice (right), but not which unit cell the rat is in. E, One-dimensional analog: the rat may be at location x0 or at any location x0 + mλ, separated by integer multiples (m) of λ (lattice period) from that location, consistent with the phase corresponding to the firing of the “blue” cell.
Figure 2.
Figure 2.
Capacity grows as a power of the phase resolution within lattices. The maximum uniquely representable distance grows as a power of the phase resolution, D ∝ (1/δφ)Neff− 1. Red dot, Phase uncertainty of δφ = ⅕. (N = 12, with first lattice period = 30 cm, and increments of 4 cm per subsequent lattice.) The fit parameter Neff ≃ 10.7, smaller than N = 12, but of similar magnitude.
Figure 3.
Figure 3.
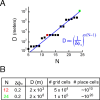
Capacity grows exponentially with the number of lattices. A, The maximum uniquely representable distance, D, grows exponentially with the number of lattices, D ∝ (1/δφ0(N − 1). For all lattices, the phase resolution is δφ0 = 1/5; as in Figure 2, the first lattice period is 30 cm, with 4 cm increments per subsequent lattice. The fit parameter is α ≃ 0.62. Red dot, N = 12. Green dot, N = 24. B, Twelve lattices with uniformly spaced periods from 30 to 74 cm with δφ = 0.2 can unambiguously represent an ∼2 × 2 km area with a 6 × 6 cm resolution. If 5000 neurons build each lattice, that would require ∼5 × 10⁴ neurons. To cover the area with sparse unimodal place cell-like encoding [with 10 neurons per (6 cm)2 block] would require ∼1010 neurons compared with the estimated 105 neurons in rat dMEC (Amaral et al., 1990; Mulders et al., 1997), which could unimodally represent at most ∼6 × 6 m with a (6 cm)2 resolution. With 24 lattices, D ∼ 2 × 10⁵ km (with a 6 cm resolution) in each direction, hugely in excess of the representational requirements of rats.
Figure 4.
Figure 4.
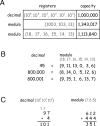
Neurobiologically useful properties of the modulo code. A, Similarly sized registers. Six registers can represent numbers in the range 0 to (106 − 1) in the decimal fixed-base positional numeral system. However, the leftmost register represents quantities that are one million times larger than the rightmost register, and increments one million times more slowly as the represented quantity is varied. Registers in the modulo code may also span a large range (middle row) but, importantly, may be chosen to be similar in size (bottom row). B, Similar update rates. With similarly sized moduli (shown in gray), all registers are equally important for representing position at all scales (compare the representations of 45 and 800,000), and all registers increment at similar rates as position is varied (compare the representations of 800,000 and 800,001). C, Parallel, carry-free position updating. Left, Summation of 97 with entails a carry operation when the 1's register wraps around in the decimal fixed-base numeral system. Right, In the modular phase representation with moduli (7, 6, 5), the same numbers [97 ≡ (6, 1, 2) and 4 ≡ (4, 4, 4)] sum to 101 ≡ (3, 5, 1). The register corresponding to the modulus 5 wraps around because 2 + 4 mod 5 = 6 mod 5 = 1, as does the register corresponding to 7, because 6 + 4 mod 7 = 10 mod 7 = 3. However, no information is carried to other registers to produce the correct result. (The examples above use integer moduli, but the principle holds for reals.)
Figure 5.
Figure 5.
Decorrelation of dMEC population response with distance. Black line, Cross-correlation between the full dMEC vectors (representing activity in all phases, all lattices) corresponding to pairs of locations separated by distance Δx. Green (pink) curves, show Cross-correlations for the dMEC phase vector of only the two smallest (largest) lattices. The dMEC population correlation is high and monotonically decreasing with Δx for small separations (central peak, magnified in rightmost inset): in this regime, distances in the space of dMEC responses are proportional to distances in real space. However, the dMEC population vector has completely decorrelated for Δx, comparable with the width of a blob in the largest lattice [full-width at half-maximum (FWHM) of ∼18 cm; the central peak width in the green (pink) curve is approximately the blob width in the smallest (largest) lattice], beyond which dMEC correlations begin to vary nonmonotonically. Middle insets, Two-sample dMEC population vectors, representing two positions separated by Δx = 140 cm, to illustrate the degree of decorrelation in the population activity. The abscissa shows the index of different lattices, arranged in order of increasing period. The ordinate shows the phase of the active population within the corresponding lattice. Grayscale intensity represents the analog level of activity (black is maximally active). Middle left, The population vector at x = 80 cm; middle right, the population vector at x = 220 cm. Parameters: N = 12 1-D lattices, periods uniformly spaced in (30,74) cm. The binary population vector χ (N × M dimensions) has χ(α, i) = 1 if i = ceil[M (x mod λα)/λα] and 0 otherwise. M = 100 is the number of different phase bins per lattice. The population activity vector r⃗ = {rα,i} is the convolution within each lattice of the phase vector with a Hanning kernel, so that, although the activity of the α, ith phase group peaks at φα,i, it also responds to neighboring phases, with FWHM of 1/4 of the total lattice period.
Figure 6.
Figure 6.
Uses of the grid cell code: nonmetric place-label readout. The black square represents home base or the rat's starting location. A, Metrically updated place labels that themselves convey no metric information can help to differentiate separate but similar looking locations (x0 vs x1). B, A landmark may change appearance over time; however, the metric updating of dMEC phases as the rat moves from a reference point to the landmark generates an invariant dMEC phase vector at the landmark. The consistent dMEC state helps to correctly identify a location despite the inconsistency of sensory cues.
Figure 7.
Figure 7.
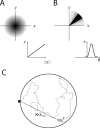
Uses of the grid cell code: explicit metric readout. A, An example of an explicit metric readout of the dMEC phase code: if the firing rate of a readout cell is proportional to displacements of the rat from a starting location, small changes in the neural response correspond to small changes in rat location and vice versa and constitute an explicitly metric code for displacement. Top, 2-D; bottom, 1-D. B, An example metric readout for angular displacements: the firing of a cell is proportional to closeness to a reference orientation. Top, 2-D; bottom, 1-D. C, Explicitly metric readouts may be used to compute the straight-line path home after random excursions over long distances. The black square represents home base.

References

    1. Abbott L, Sejnowski T, editors. Neural codes and distributed representations. Cambridge, MA: MIT; 1999.
    1. Alyan S, McNaughton BL. Hippocampectomized rats are capable of homing by path integration. Behav Neurosci. 1999;113:19–31. - PubMed
    1. Amaral DG, Ishizuka N, Claiborne B. Neurons, numbers and the hippocampal network. Prog Brain Res. 1990;83:1–11. - PubMed
    1. Bajard J-C, Imbert L. A full rns implementation of rsa. IEEE Trans Comput. 2004;53:769–774.
    1. Barry C, Hayman R, Burgess N, Jeffery KJ. Experience-dependent rescaling of entorhinal grids. Nat Neurosci. 2007;10:682–684. - PubMed

Publication types

MeSH terms

LinkOut - more resources