. 2008 Jul 2;28(27):6914-25.
doi: 10.1523/JNEUROSCI.1660-08.2008.

Interaural time difference processing in the mammalian medial superior olive: the role of glycinergic inhibition

Affiliations

Interaural time difference processing in the mammalian medial superior olive: the role of glycinergic inhibition

Michael Pecka et al. J Neurosci. .

Abstract

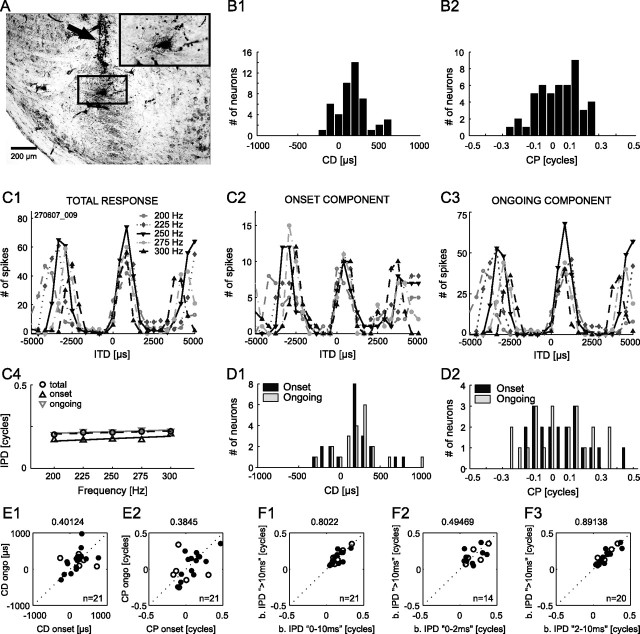
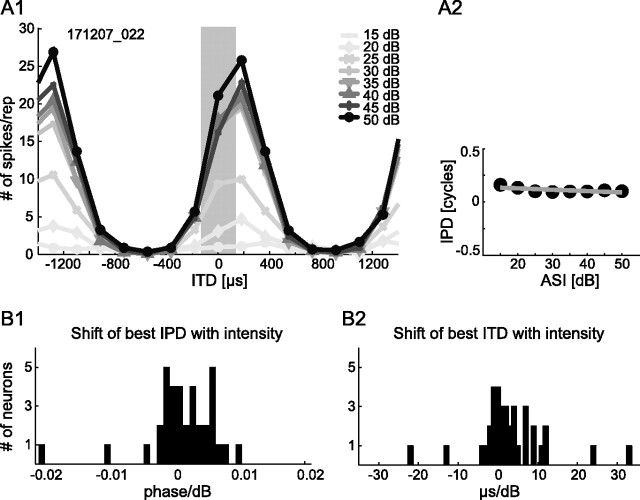
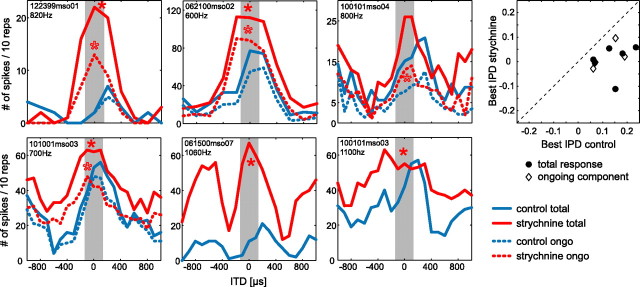
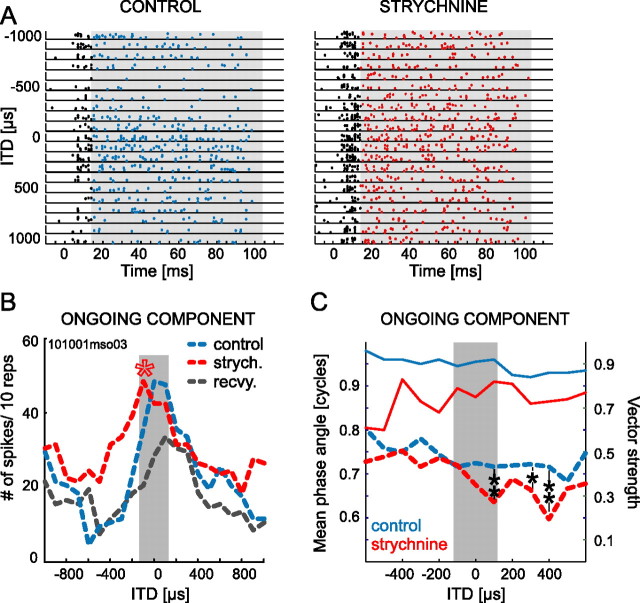
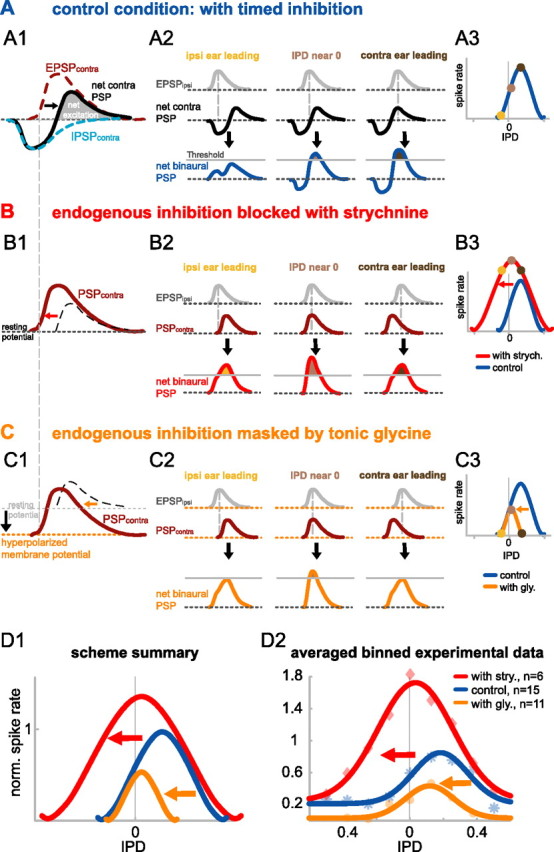
The dominant cue for localization of low-frequency sounds are microsecond differences in the time-of-arrival of sounds at the two ears [interaural time difference (ITD)]. In mammals, ITD sensitivity is established in the medial superior olive (MSO) by coincidence detection of excitatory inputs from both ears. Hence the relative delay of the binaural inputs is crucial for adjusting ITD sensitivity in MSO cells. How these delays are constructed is, however, still unknown. Specifically, the question of whether inhibitory inputs are involved in timing the net excitation in MSO cells, and if so how, is controversial. These inhibitory inputs derive from the nuclei of the trapezoid body, which have physiological and structural specializations for high-fidelity temporal transmission, raising the possibility that well timed inhibition is involved in tuning ITD sensitivity. Here, we present physiological and pharmacological data from in vivo extracellular MSO recordings in anesthetized gerbils. Reversible blockade of synaptic inhibition by iontophoretic application of the glycine antagonist strychnine increased firing rates and significantly shifted ITD sensitivity of MSO neurons. This indicates that glycinergic inhibition plays a major role in tuning the delays of binaural excitation. We also tonically applied glycine, which lowered firing rates but also shifted ITD sensitivity in a way analogous to strychnine. Hence tonic glycine application experimentally decoupled the effect of inhibition from the timing of its inputs. We conclude that, for proper ITD processing, not only is inhibition necessary, but it must also be precisely timed.


Figures

Figure 1.
Figure 1.
Basic properties of ITD sensitivity are equal for onset and ongoing responses. Stimulus durations were 50 or 200 ms. A, Recording site for the example neuron shown in C. The MSO cell band and surrounding neuropil are clearly visible. HRP staining is present in the dorsal region of the MSO cell band. The electrode track of the multibarrel electrode is marked by the black arrow. The inset in top right corner shows higher magnification of the region demarked by the black square, with HRP staining being concentrated on the somatic area. B, Distributions of CDs (B1) and CPs (B2) of 48 MSO neurons based on total responses. C1–C3, ITD functions of a low-frequency neuron (BF, 250 Hz) in response to pure tones (5 test frequencies; 8 repetitions; 50 ms duration). ITD functions are shown for total response (C1), onset component only (first 10 ms of total response) (C2), and ongoing component only (first 10 ms of total response excluded) (C3). C4, Phase–frequency plots for the ITD functions shown in C1–C3. D, Distributions of CD (D1) and CP (D2) for 21 of the 48 neurons in B, separately analyzed for onset and ongoing response components. E, Comparison between onset and ongoing response for CD (E1) and CP (E2). F, Best IPDs of first 10 ms of response were similar to best IPDs of ongoing responses (F1). Correlation was strongest if the first 2 ms of responses were excluded (F3). Correlation coefficients are given on top of each panel. The open symbols indicate neurons with unconfirmed recording sites.
Figure 2.
Figure 2.
ITD sensitivity is robust against variations in ASI. A1, Responses of an example neuron that exhibited ITD sensitivity over the full test range of ASIs. Frequency of pure-tone stimulation was 683 Hz (BF). ASIs in decibels SPL are given in the top right corner (10 repetitions for each ASI). The gray bar marks the physiological range of ITDs. A2, Best IPDs are plotted against respective ASIs. The gray line depicts a linear fit as a basis for the histograms showing shifts in IPD (B1) and ITD (B2) for 36 neurons. Values are clustered around 0 in both measures, indicating high robustness of best IPD/ITD against changes in ASI.
Figure 3.
Figure 3.
Strychnine induces shifts in response distribution toward 0 ITD for total and ongoing response. ITD functions for pure-tone stimulation at BF (provided at top left of panels) for four neurons and for trains of narrowband pulses centered on BF for two neurons (middle and right of bottom panels) are shown before and during or shortly after local strychnine application. The solid blue lines indicate control condition of the total responses of the cells, whereas the corresponding strychnine conditions are depicted by the solid red lines. Ongoing components of the responses are shown in the dashed lines. The asterisks mark significant shifts for total (filled asterisks) or ongoing response (open asterisks). The gray bar indicates “physiological range” of ITDs (±135 μs). The scatter plots in the rightmost panel show changes in best ITD during strychnine application for each cell.
Figure 4.
Figure 4.
Ongoing response is sensitive to strychnine application. A, Dot raster display of one neuron stimulated with pure tones at BF (700 Hz). Shown are responses for 10 repetitions at ITDs between ±1 ms without (left; control) and in the presence of strychnine (right). Time axis refers to start of stimulation; stimulus duration was 100 ms (including 5 ms rise/fall time). Spikes that fell into the time window for ongoing response (gray rectangle) are shown in blue and red for control and strychnine condition, respectively. Spikes within the first 10 ms of each spike train were discarded and are shown in black. B, ITD functions for ongoing response only, derived from spikes shown in color in A. Compared with control condition (blue line), the response distribution during strychnine application (red line) was significantly shifted toward the “left” (red asterisk). Several minutes after the strychnine application was terminated, the best ITD was shifted back to more positive ITD values (to the “right”; recovery, gray line). The gray bar marks “physiological range” of ITDs. C, The mean phase angle of the phase-locked ongoing responses was also affected by blocking inhibition. At contralateral leading ITDs in the range of +100 to +400 μs, neuronal responses phase-locked to significantly smaller mean phase angles during strychnine application (dashed red line; left y-axis) than under control condition (dashed blue line); hence, during blockade of inhibition, the response occurred slightly earlier in each pure tone cycle. Phase-locking was high before and during strychnine application (solid blue and red lines, respectively; right y-axis). *p < 0.05; **p < 0.001.
Figure 5.
Figure 5.
Tonic inhibition shifts the best ITD toward 0 ITD. ITD functions for pure-tone stimulation at BF (provided at top left of panels) for 11 neurons are shown before (solid blue lines) and during tonic glycine application (solid orange lines). During glycine application, response distributions were significantly shifted in 9 of 11 cells (filled asterisks). Shifts of best ITDs were also present in the ongoing responses (dashed blue and orange lines for control and during application, respectively). The solid black lines in the bottom panels show the ITD function during application of NaCl solution with similar acidity as the glycine solution, pH 3. “Physiological range” of ITDs is marked by gray bars. The scatter plot in the bottom-most right panel summarizes the shifts in best IPD for all 11 neurons.
Figure 6.
Figure 6.
ITD sensitivity of ongoing response is equally sensitive to glycine application. A, Dot raster display of one neuron stimulated with pure tones at BF (630 Hz). Responses for multiple repetitions of ITDs between ±1653 μs without (left; control) and during glycine application (right) are shown. Time axis refers to start of stimulation; stimulus duration was 50 ms (plus 5 ms rise/fall time). Spikes that fell into the time window for ongoing response (gray rectangle) are shown in blue and orange for control and glycine condition, respectively. The first 2 ms of spike trains were discarded and are shown in black. B, ITD functions for ongoing response only, derived from spikes shown in color in A. ITD tuning was shifted significantly toward the left (orange asterisk) during glycine application (orange line) compared with control condition (blue line). After glycine application was terminated, the best ITD immediately shifted back to the right (recovery; gray line). The gray bar marks the “physiological range” of ITDs.
Figure 7.
Figure 7.
Predicted and measured shifts of IPD tuning during strychnine and glycine application. A, Control condition. A1, Contralateral PSP (black line). The basic principle of the timed inhibition hypothesis is that the contralateral IPSPcontra (light blue dashed line) precedes the contralateral EPSP (brown dashed line) on a cycle-by-cycle basis. This causes a delay of the contralaterally induced net excitation (shaded area under black line). A2, Binaural interaction (blue) of the net contra PSP (black) with the EPSPipsi (gray) at different IPDs. Maximal coincidence of the net excitations from both ears occurs for contra leading IPDs (right-most column of panels) compensating for the inhibition-induced delay of the contralateral excitation. A3, Resulting IPD function: yellow-, light brown-, and dark brown-filled circles correspond to the three stimulus conditions shown in A2. B, Effect of strychnine application. B1, Experimentally blocking the timed inhibition with strychnine results in a net contra PSP that is identical with the contralateral EPSP (brown line; compare with brown dashed line in A1). Hence the net contra PSP is advanced in time and broadened (indicated by red arrow) compared with the control condition (dashed black line). B2, Maximal binaural coincidence during strychnine application occurs at IPDs near 0 cycles (middle column of panels). Ipsilateral leading IPDs also create suprathreshold net binaural PSPs (left column of panels) because of partial overlap of ipsi and contra excitation. This results in overall increased response rates and a broadening of the IPD function on the left-hand side, shifting the peak toward 0 IPD (B3). C, Effect of tonic glycine application. C1, Tonic glycine application induces a tonic hyperpolarization (black arrow and orange dotted line), which has two important effects. First, the timed inhibition is masked; hence the net PSPcontra is not delayed but, second, reduced compared with the strychnine condition. Compared with control condition, this reduction has the most pronounced impact at the declining tail of the PSP (indicated by orange arrow). C2, This causes EPSPipsi and PSPcontra to coincide at IPDs near 0 cycles with only a small fraction of the net binaural PSPs exceeding threshold. C3, Compared with control conditions, the right-hand side of the IPD function is highly reduced causing a left shift of the overall IPD function (orange arrow). D1, D2, These qualitative predictions are summarized in D1 and are consistent with the results in our population data as depicted in D2, showing the average normalized spike rates of control (n = 15), strychnine (n = 6), and glycine (n = 11) condition (shown by asterisks, diamonds, and filled circles, respectively). For averaging, responses were binned in IPD widths of 0.125 cycles. Average normalized IPD functions were derived from these mean values by Gaussian fits. The R2 values of the fits were 0.92, 0.98, and 0.92 for the control (blue), strychnine (red), and glycine (orange) conditions, respectively.

Similar articles

Cited by

References

    1. Adams JC. Technical considerations on use of horseradish-peroxidase as a neuronal marker. Neuroscience. 1977;2:141–145. - PubMed
    1. Akeroyd MA, Bernstein LR. The variation across time of sensitivity to interaural disparities: behavioral measurements and quantitative analyses. J Acoust Soc Am. 2001;110:2516–2526. - PubMed
    1. Batra R, Kuwada S, Fitzpatrick DC. Sensitivity to interaural temporal disparities of low- and high- frequency neurons in the superior olivary complex. I. Heterogeneity of responses. J Neurophysiol. 1997;78:1222–1236. - PubMed
    1. Beckius GE, Batra R, Oliver DL. Axons from anteroventral cochlear nucleus that terminate in medial superior olive of cat: observations related to delay lines. J Neurosci. 1999;19:3146–3161. - PMC - PubMed
    1. Best V, van Schaik A, Carlile S. Separation of concurrent broadband sound sources by human listeners. J Acoust Soc Am. 2004;115:324–336. - PubMed

Publication types

MeSH terms

LinkOut - more resources