. 2008 Jul 2;28(27):6926-37.
doi: 10.1523/JNEUROSCI.0800-08.2008.

Autophagy induction and autophagosome clearance in neurons: relationship to autophagic pathology in Alzheimer's disease

Affiliations

Autophagy induction and autophagosome clearance in neurons: relationship to autophagic pathology in Alzheimer's disease

Barry Boland et al. J Neurosci. .

Abstract

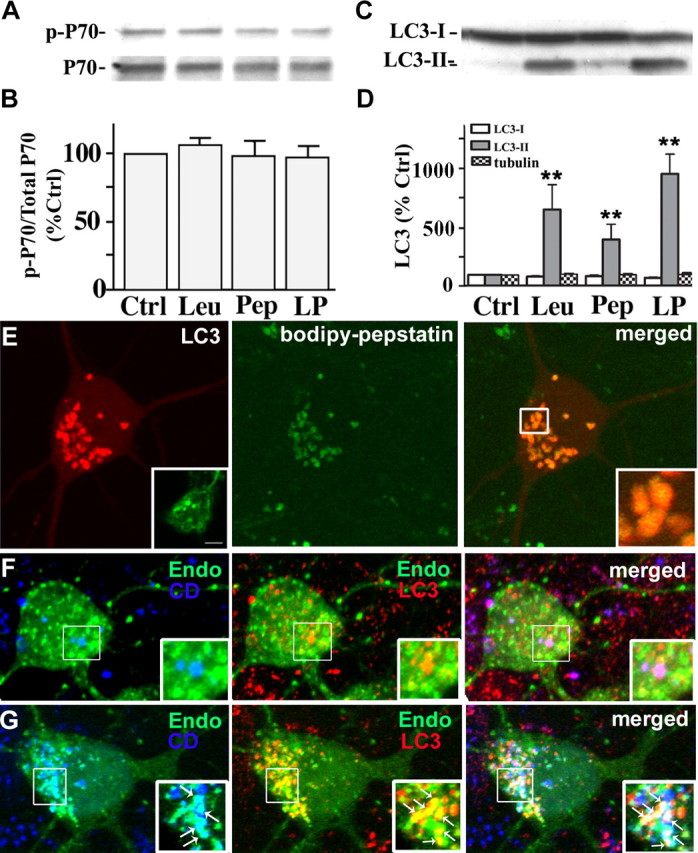
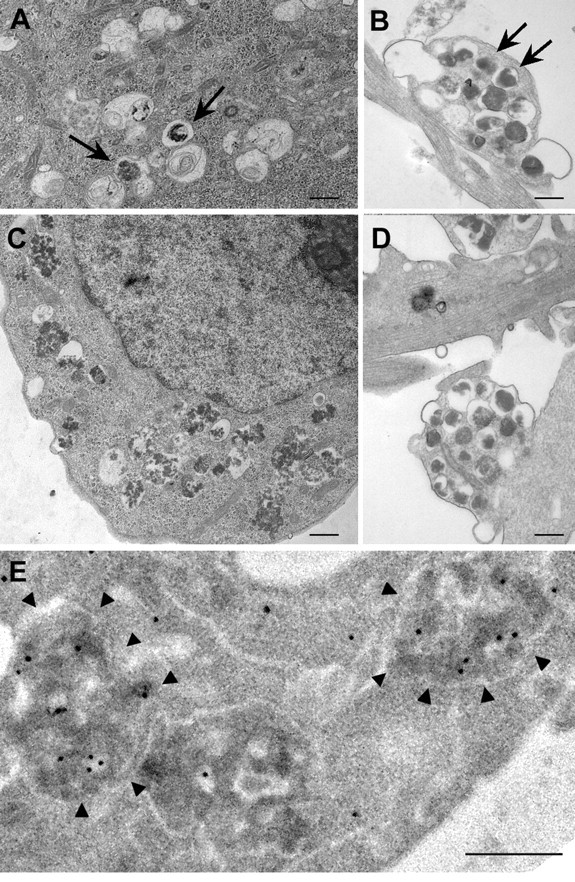
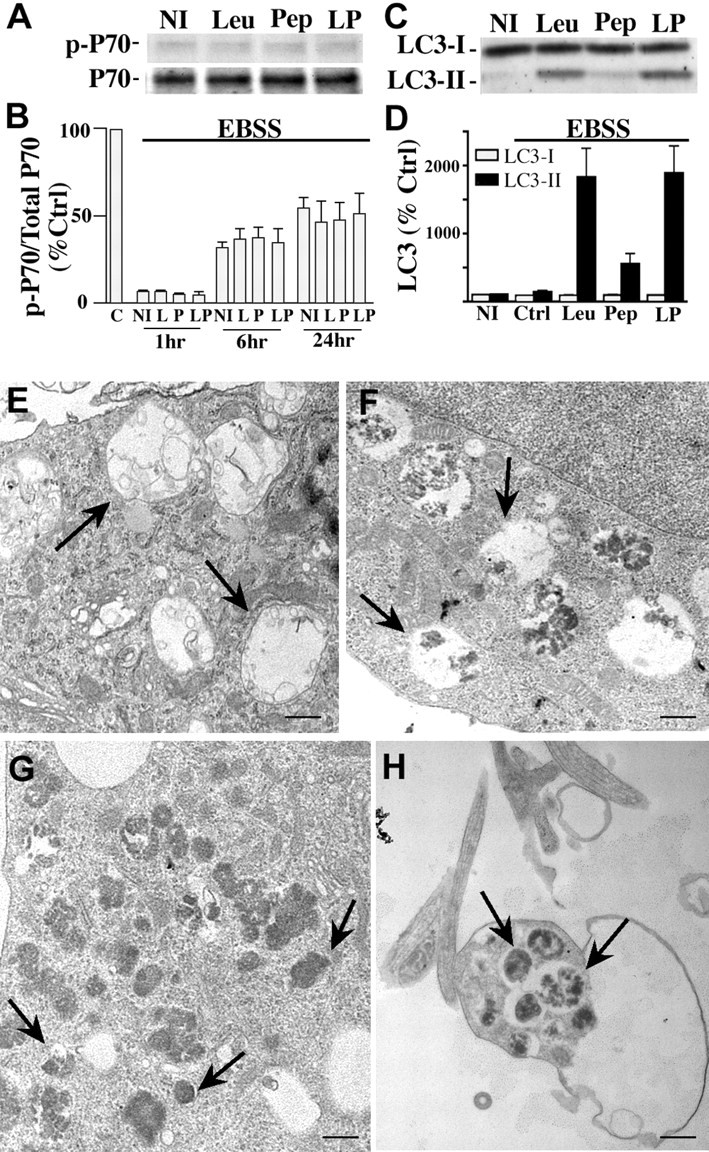
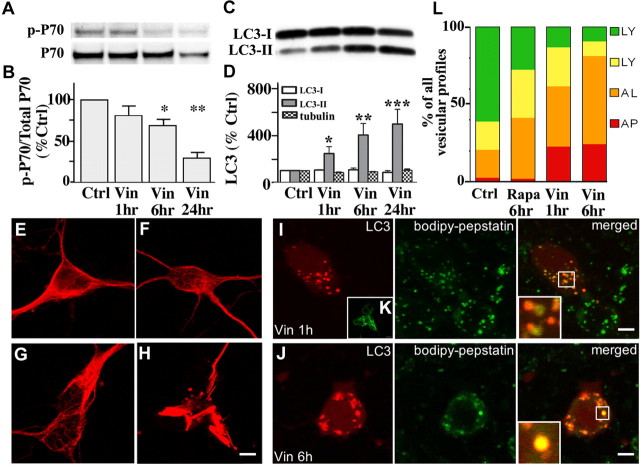
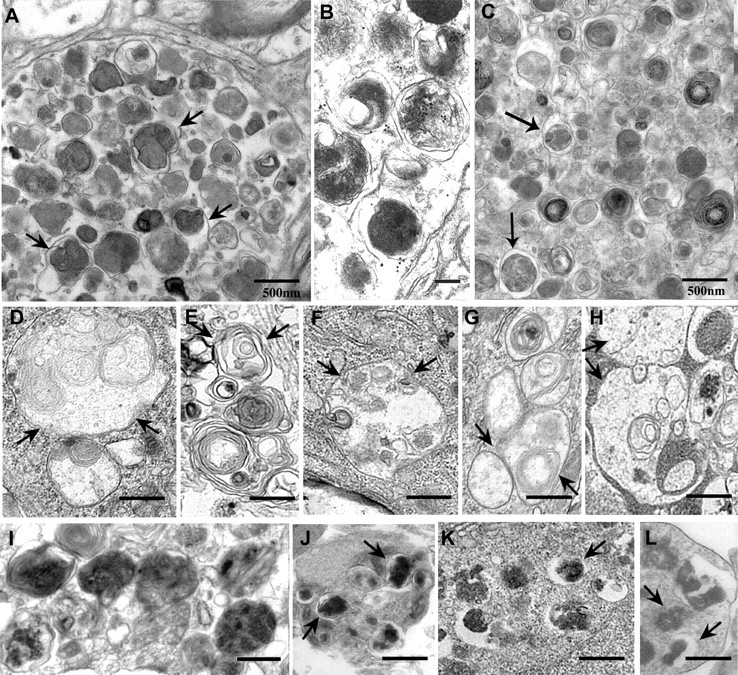
Macroautophagy, a major pathway for organelle and protein turnover, has been implicated in the neurodegeneration of Alzheimer's disease (AD). The basis for the profuse accumulation of autophagic vacuoles (AVs) in affected neurons of the AD brain, however, is unknown. In this study, we show that constitutive macroautophagy in primary cortical neurons is highly efficient, because newly formed autophagosomes are rapidly cleared by fusion with lysosomes, accounting for their scarcity in the healthy brain. Even after macroautophagy is strongly induced by suppressing mTOR (mammalian target of rapamycin) kinase activity with rapamycin or nutrient deprivation, active cathepsin-positive autolysosomes rather than LC3-II-positive autophagosomes predominate, implying efficient autophagosome clearance in healthy neurons. In contrast, selectively impeding late steps in macroautophagy by inhibiting cathepsin-mediated proteolysis within autolysosomes with cysteine- and aspartyl-protease inhibitors caused a marked accumulation of electron-dense double-membrane-limited AVs, containing cathepsin D and incompletely degraded LC3-II in perikarya and neurites. Similar structures accumulated in large numbers when fusion of autophagosomes with lysosomes was slowed by disrupting their transport on microtubules with vinblastine. Finally, we find that the autophagic vacuoles accumulating after protease inhibition or prolonged vinblastine treatment strongly resembled AVs that collect in dystrophic neurites in the AD brain and in an AD mouse model. We conclude that macroautophagy is constitutively active and highly efficient in healthy neurons and that the autophagic pathology observed in AD most likely arises from impaired clearance of AVs rather than strong autophagy induction alone. Therapeutic modulation of autophagy in AD may, therefore, require targeting late steps in the autophagic pathway.


Figures

Figure 1.
Figure 1.
Autophagy induction in primary cortical neurons. A, Western blot analyses showing a rapid and sustained decrease in mTOR-mediated phosphorylation of p-p70 immunoreactivity relative to total p70 immunoreactivity after rapamycin (10 nm) addition to the medium for 1–24 h. B, Densitometric analyses of gels in A (n = 6; mean ± SEM): ratios of immunoreactive p-p70 relative to total p70 in rapamycin-treated neurons are expressed as a percentage of the untreated control value for each time point (***p < 0.001). C, Representative blot of LC3-I and LC3-II immunoreactivity in neurons treated with rapamycin (10 nm) for 1, 6, and 24 h. D, Graph depicting changes in LC3-I, LC3-II, and tubulin levels in neurons treated with rapamycin 1, 6, and 24 h (*p < 0.05). E, Immunostaining for LC3 distribution in control cortical neurons and rapamycin-treated (10 nm; 24 h) neurons. F, The arrows indicate punctate LC3 representative of AV membranes. Scale bars, 5 μm. G–I, Live imaging of BODIPY-pepstatin-FL in DsRed-LC3 transfected neurons. DsRed-LC3 is primarily cytosolic in control neurons (G, left panel) but relocated into vesicles after treatment with rapamycin (10 nm) for 6 h (H, left panels). Rapamycin-induced AVs contain lysosomal enzymes: H and I, inset, illustrate varying degrees to which autolysosomes have matured to lysosomes. Background BODIPY-pepstatin-FL labeling indicates lysosomal compartments in neighboring untransfected neurons. Scale bars: G–I, 10 μm.
Figure 2.
Figure 2.
A, B, AV ultrastructure in neurons during autophagy induction: 5-d-old primary cortical neurons displayed few AVs in their cell bodies (A) (scale bar, 2 μm) and neurites (B). C, Appearance of large clear autophagic fusion compartments in the cell body after rapamycin (10 nm) treatment for 1 h. D, Electron-dense sequestered material was observed in neurites after rapamycin (10 nm) treatment for 1 h. E, F, Prolonged activation of autophagy with rapamycin (10 nm; 24 h) revealed multiple autophagic compartments in both cell bodies (E) and neurites (F). G, H, Ultrastructural localization of cathepsin D in control (G) and rapamycin (10 nm; 6 h)-treated neurons by silver-enhanced immunogold labeling with cathepsin D antibody (H). In control neurons, cathepsin D is abundant in lysosomes with relatively little electron-dense content (arrows). Most AVs in rapamycin-treated neurons are decorated with silver-enhanced immunogold (arrows), indicating the presence of cathepsin D. Scale bars, 500 nm (except as otherwise noted).
Figure 3.
Figure 3.
Cathepsin inhibition markedly elevates LC3-II levels without inducing mTOR-mediated autophagy. A, Immunoblot analyses of phospho-p70 and total p70 after leupeptin (20 μm), pepstatin (20 μm), or both (LP) were added to the medium for 24 h. B, Densitometric analyses of gels in A (n = 5): ratios of phospho-p70 relative to total p70 are expressed as a percentage of the untreated control value. Error bars indicate SEM. C, Immunoblot analyses of LC3-I and LC3-II after neurons were exposed to protease inhibitors for 24 h. D, Densitometric analyses of LC3-I, LC3-II, and tubulin immunoreactivity in neurons after protease inhibitor treatment (n = 5; **p < 0.01). E, Live image of DsRed-LC3 transfected neurons treated with leupeptin (20 μm) for 24 h loaded with BODIPY-pepstatin-FL. Vesicular LC3 localizes within BODIPY-pepstatin-positive compartments: lack of degradation results in a strong LC3 signal (E, right panel inset). Neurons treated with leupeptin and pepstatin for 24 h immunostained for LC3 show a similar pattern of punctate LC3 accumulation (E, left panel inset). F, GFP-Endomarker transfected neurons immunostained with LC3 (red) and cathepsin D (blue). Under normal conditions, LC3 and GFP-Endo occasionally colocalize (F, middle panel inset), whereas endosomes and cathepsin D do not (F, left panel inset). Cotreatment with leupeptin and pepstatin causes accumulation of LC3- and GFP-Endomarker-positive amphisomes (G, middle panel, arrows), as well as GFP-Endomarker and cathepsin D-positive endosomes and lysosomes.
Figure 4.
Figure 4.
Ultrastructure and cathepsin D content of AVs accumulating after exposure of neurons to leupeptin (20 μm). A–C, After 6 h, numbers of mainly double-membrane-limited autophagosomes containing amorphous electron-dense material are seen in the cell bodies of some neurons (A) and in neurites (B), which was more evident after 24 h in all neurons (C). D, Undegraded organellar material was also present in AVs within the neurites of neurons after 24 h. AV morphologies were similar in neurons treated with leupeptin plus pepstatin (data not shown). E, Silver-enhanced immunogold ultrastructural localization of cathepsin D in AVs (arrowheads) in neurons treated with leupeptin (24 h; 20 μm). Scale bars, 500 nm.
Figure 5.
Figure 5.
Autophagy induction by serum starvation with or without cathepsin inhibition. A, Western blot analyses of p-p70 and total p70 in neurons grown in EBSS in the absence [no inhibitor (NI)] or presence of pepstatin (Pep, P; 20 μm), leupeptin (Leu, L; 20 μm), or both (LP) for 24 h. B, Densitometric analyses of multiple gels in A (n = 5): ratios of p-p70 and p70 immunoreactivity are expressed as a percentage of the untreated control (C) value shown at 100% (p < 0.0001 for 1 h, p < 0.001 for 6 h, and p < 0.05 for 24 h treatments in EBSS culture media). Error bars indicate SEM. C, Representative immunoblots of LC3-I and LC3-II immunoreactivity in neurons grown in EBSS in the absence or presence of protease inhibitors for 24 h. D, Densitometric analyses of LC3-I and LC3-II levels after neurons grown in EBSS in the absence or presence of protease inhibitors for 24 h. In B and D, densitometric values are expressed as ratios of immunoreactivity levels after each inhibitor treatment relative to the corresponding ratio for untreated control neurons grown in NBM/B27. E, Ultrastructure of AVs in neuronal perikaryon after growth in EBSS for 24 h (F) EBSS with leupeptin (20 μm) and pepstatin (20 μm) for 6 h. Scale bar, 500 nm. G, H, Cell body (G) and neurite (H) of neurons cultured in EBSS with leupeptin (20 μm) and pepstatin (20 μm) for 24 h. Arrows indicate different AV morphologies seen in each treatment. Scale bars, 500 nm.
Figure 6.
Figure 6.
Vinblastine effects on AV accumulation and autophagy induction. A, Western blot analyses of p-p70 and total p70 after exposure of neurons to vinblastine (10 μm) for 1–24 h. B, Densitometric analyses of immunoblots in A (n = 6): ratios of p-p70 relative to total p70 are expressed as percentages of the control value from each set of treatments (*p < 0.05; **p < 0.01; ***p < 0.001). Error bars indicate SEM. C, Representative immunoblots of LC3-I and LC3-II in neurons exposed to vinblastine (10 μm) for 1, 6, and 24 h. D, Densitometry of LC3-I, LC3-II, and tubulin levels after neurons exposed to vinblastine (10 μm) for 1, 6, and 24 h (n = 6; *p < 0.05, **p < 0.01). E–H, Immunostaining of primary neurons stained with TUJ-1 antibody for neuron-specific β-III-tubulin. Tubulin remains intact when autophagy is induced (F) or lysosomal proteolysis is inhibited by leupeptin (20 μm) (G), but is disrupted after 24 h treatment with vinblastine (10 μm) (H). Scale bars, 5 μm. I, J, Live image of BODIPY-pepstatin-FL in DsRed-LC3 transfected neurons after treatment with vinblastine (10 μm). Autophagosomes that have not fused with lysosomes are the predominant AVs accumulating after 1 h of vinblastine (I, right panel). J, After 6 h of vinblastine, LC3 mostly colocalizes with BODIPY-pepstatin vesicles indicating that fusion between autophagosomes and lysosomes occurs despite impairment in microtubule-dependent lysosome transport. K, AV accumulation seen in vinblastine (10 μm; 1 h)-treated neurons immunostained with LC3 antibody. L, Quantification of vesicular profiles in DsRed-LC3 transfected cells loaded with BODIPY-pepstatin. The average number of each vesicle type is shown as a percentage of the total number: red, autophagosome (AP); orange, autolysosome (AL); yellow, lysosomes with minimal traces of DsRed-LC3; green, lysosomes. In untreated neurons transiently expressing DsRed-LC3 loaded with BODIPY-pepstatin, most vesicles (∼80%) are lysosomes. Autophagosomes are efficiently fused with lysosomes after rapamycin because the proportion of autophagosomes remains very low, and only autolysosomes are increased. Between 1 and 6 h of vinblastine treatment, autophagosome maturation also occurs as indicated by the increased proportion of autolysosomes.
Figure 7.
Figure 7.
Ultrastructure and cathepsin D content of AVs accumulating after exposure of neurons to vinblastine (10 μm). A, Vinblastine treatment caused accumulation of predominantly double-membrane-limited AVs containing organelle structures with mostly undegraded material (arrows) in the cell body and neurites (inset) after 1 h, similar in morphology to autophagosomes that accumulated after treatment with ammonium chloride (50 mm, 6 h; bottom inset). C, These structures contained undetectable levels of cathepsin D by silver-enhanced immunogold labeling. B, D, After 6 h of vinblastine treatment, double-membrane-limited AVs contained more amorphous electron-dense material and cathepsin D (D) reflecting partial digestion of autophagosomal contents in cell bodies (B, arrows) and neurites (B, inset). Most AVs at 6 h after vinblastine were decorated by silver-enhanced immunogold-conjugated cathepsin D antibodies. Scale bars, 500 nm.
Figure 8.
Figure 8.
A–C, Comparison of AV ultrastructure in Alzheimer's disease and treated primary neurons: In the brains of patients with Alzheimer's disease (A, B) or the brain of a PS/APP mouse model of AD (C), dystrophic neurites in cerebral cortex contain robust accumulations of single- and double-membrane-limited AVs with electron-dense content, which contain cathepsin D (B). D–L represent the internal morphology of primary neurons during different autophagy modulating conditions. D and E depict conditions in which autophagy is strongly induced: cell body (D, F) and neurite (E) of rapamycin (10 nm; 24 h)-treated neurons; cell body (G) of EBSS-starved neurons (24 h). H depicts autophagosomes in perikarya after 1 h vinblastine treatment in which autophagosome fusion with lysosomes are severely impaired. I–L depict conditions involving impaired AV clearance illustrating AV morphologies resembling those in AD brain: cell body of vinblastine (10 μm)-treated neurons for 6 h (I, J); cell body (K) of EBSS plus pepstatin (20 μm; 24 h)-treated neurons; cell body (L) of leupeptin (20 μm; 24 h)-treated neurons. Arrows indicate different AV morphologies seen in each treatment. Scale bars, 500 nm.

Similar articles

Cited by

References

    1. Anglade P, Vyas S, Javoy-Agid F, Herrero MT, Michel PP, Marquez J, Mouatt-Prigent A, Ruberg M, Hirsch EC, Agid Y. Apoptosis and autophagy in nigral neurons of patients with Parkinson's disease. Histol Histopathol. 1997;12:25–31. - PubMed
    1. Barber AJ, Nakamura M, Wolpert EB, Reiter CE, Seigel GM, Antonetti DA, Gardner TW. Insulin rescues retinal neurons from apoptosis by a phosphatidylinositol 3-kinase/Akt-mediated mechanism that reduces the activation of caspase-3. J Biol Chem. 2001;276:32814–32821. - PubMed
    1. Berg TO, Fengsrud M, Strømhaug PE, Berg T, Seglen PO. Isolation and characterization of rat liver amphisomes. Evidence for fusion of autophagosomes with both early and late endosomes. J Biol Chem. 1998;273:21883–21892. - PubMed
    1. Bi X, Zhou J, Lynch G. Lysosomal protease inhibitors induce meganeurites and tangle-like structures in entorhinohippocampal regions vulnerable to Alzheimer's disease. Exp Neurol. 1999;158:312–327. - PubMed
    1. Blommaart EF, Luiken JJ, Blommaart PJ, van Woerkom GM, Meijer AJ. Phosphorylation of ribosomal protein S6 is inhibitory for autophagy in isolated rat hepatocytes. J Biol Chem. 1995;270:2320–2326. - PubMed

Publication types

MeSH terms