. 2008 Sep;100(3):1498-512.
doi: 10.1152/jn.90447.2008. Epub 2008 Jul 2.

Early and late changes in the distal forelimb representation of the supplementary motor area after injury to frontal motor areas in the squirrel monkey

Affiliations

Early and late changes in the distal forelimb representation of the supplementary motor area after injury to frontal motor areas in the squirrel monkey

Ines Eisner-Janowicz et al. J Neurophysiol. 2008 Sep.

Abstract

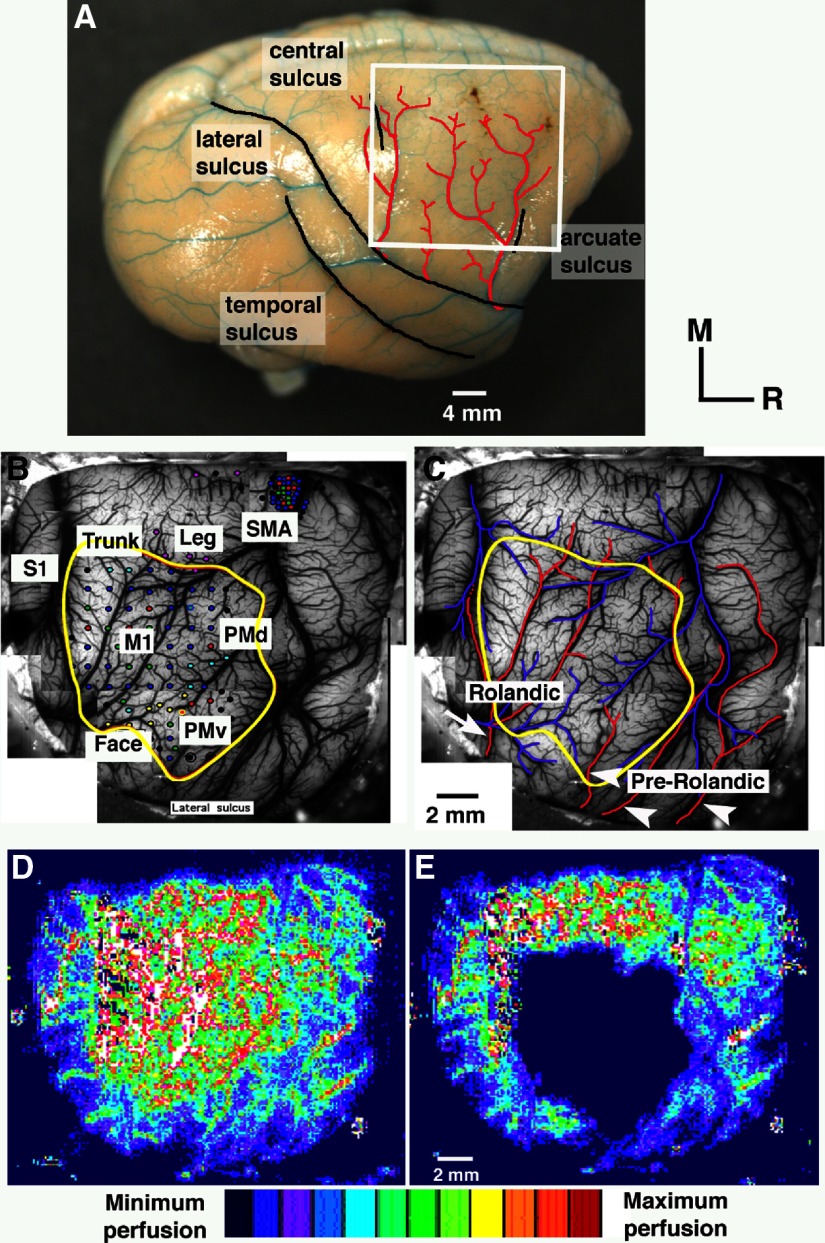
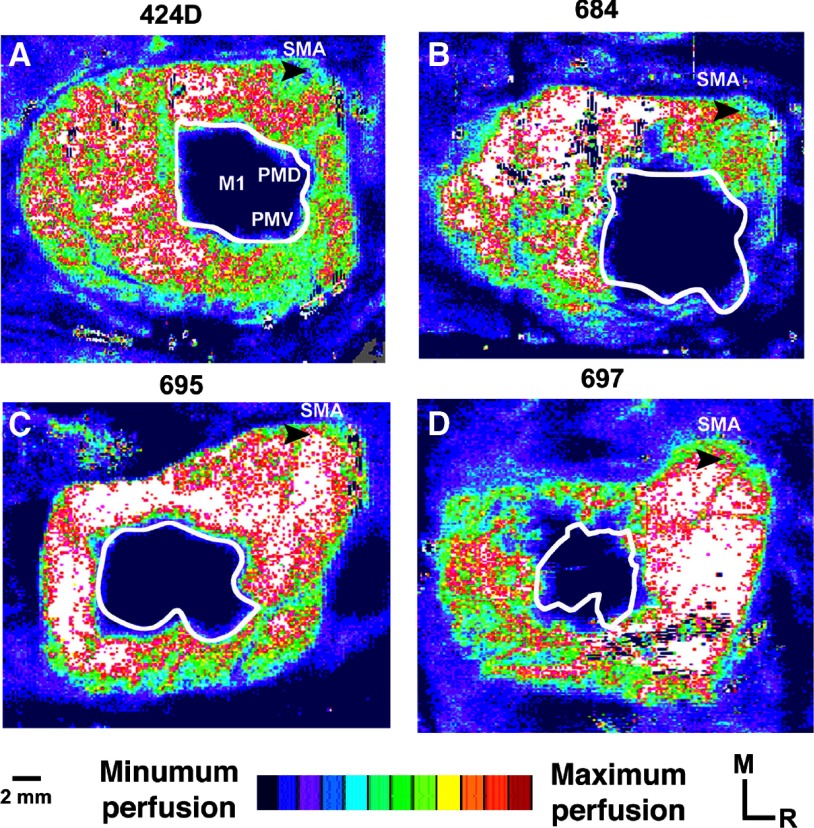
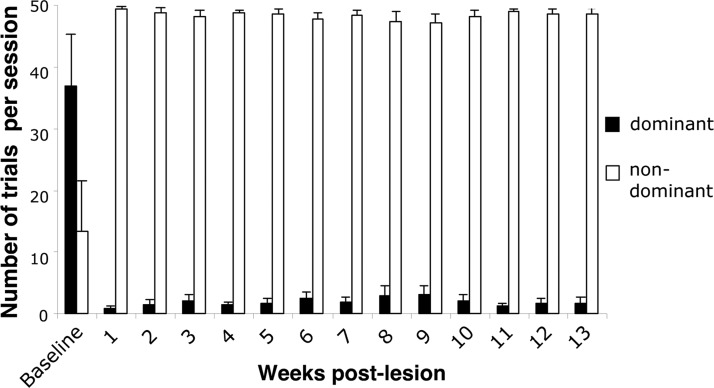
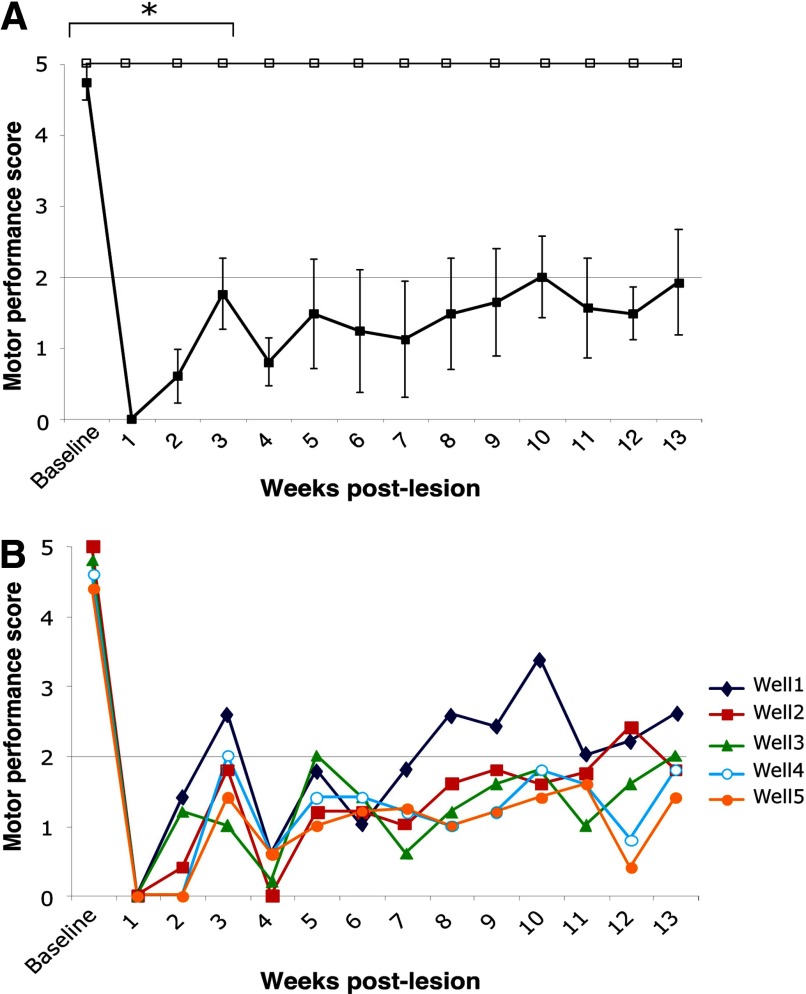
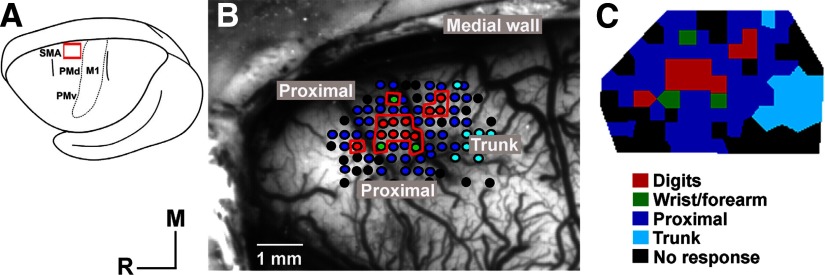
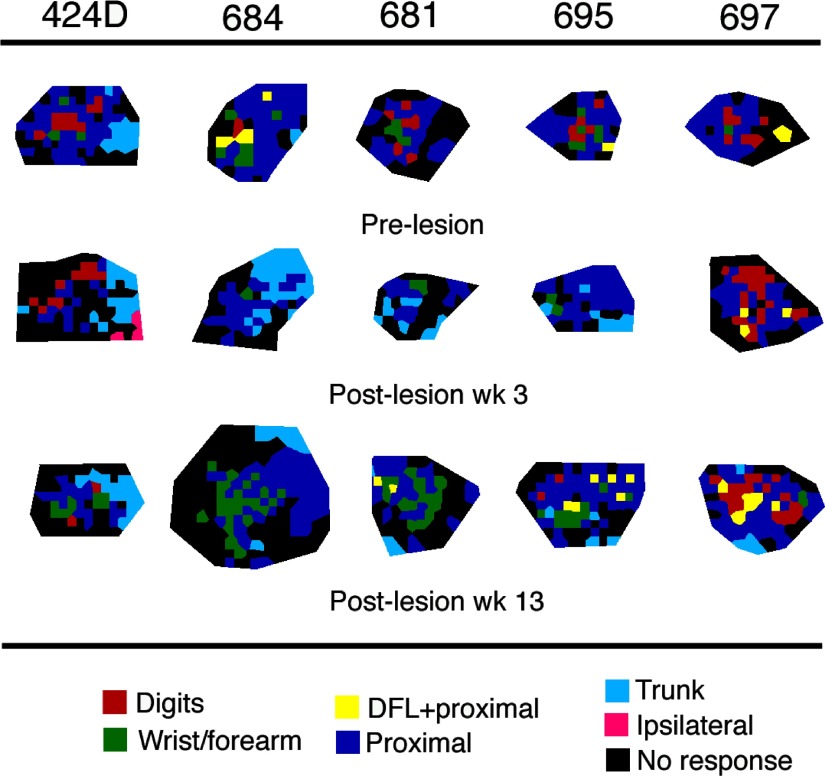
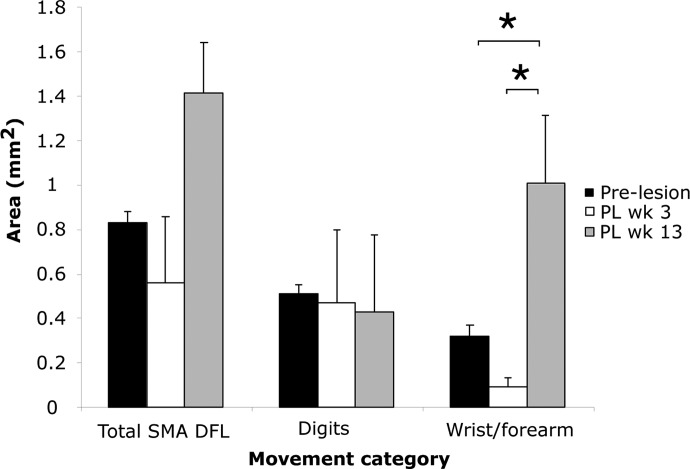
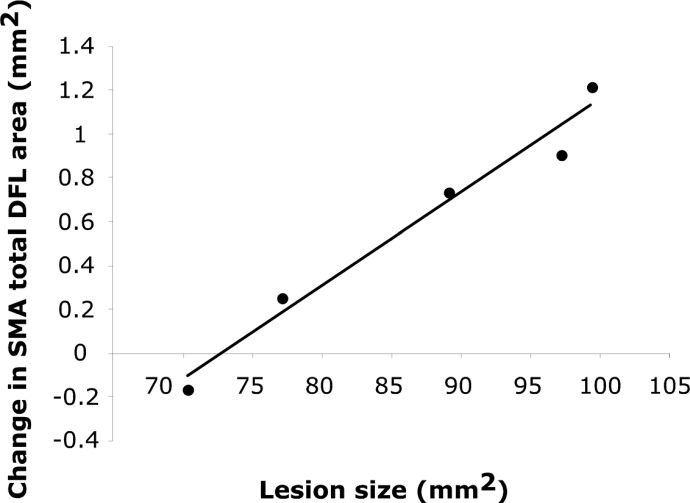
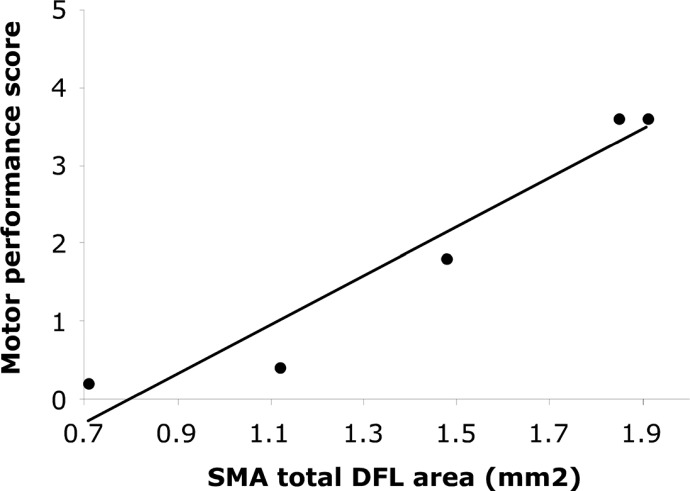
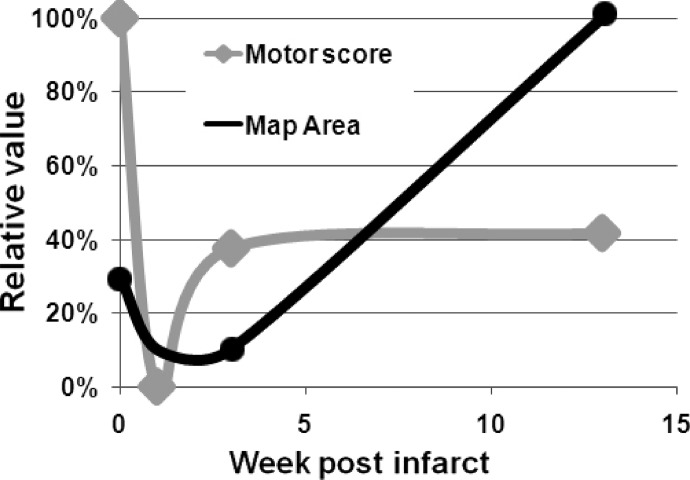
Neuroimaging studies in stroke survivors have suggested that adaptive plasticity occurs following stroke. However, the complex temporal dynamics of neural reorganization after injury make the interpretation of functional imaging studies equivocal. In the present study in adult squirrel monkeys, intracortical microstimulation (ICMS) techniques were used to monitor changes in representational maps of the distal forelimb in the supplementary motor area (SMA) after a unilateral ischemic infarct of primary motor (M1) and premotor distal forelimb representations (DFLs). In each animal, ICMS maps were derived at early (3 wk) and late (13 wk) postinfarct stages. Lesions resulted in severe deficits in motor abilities on a reach and retrieval task. Limited behavioral recovery occurred and plateaued at 3 wk postinfarct. At both early and late postinfarct stages, distal forelimb movements could still be evoked by ICMS in SMA at low current levels. However, the size of the SMA DFL changed after the infarct. In particular, wrist-forearm representations enlarged significantly between early and late stages, attaining a size substantially larger than the preinfarct area. At the late postinfarct stage, the expansion in the SMA DFL area was directly proportional to the absolute size of the lesion. The motor performance scores were positively correlated to the absolute size of the SMA DFL at the late postinfarct stage. Together, these data suggest that, at least in squirrel monkeys, descending output from M1 and dorsal and ventral premotor cortices is not necessary for SMA representations to be maintained and that SMA motor output maps undergo delayed increases in representational area after damage to other motor areas. Finally, the role of SMA in recovery of function after such lesions remains unclear because behavioral recovery appears to precede neurophysiological map changes.


Figures

FIG. 1.
FIG. 1.
Cortical infarct. A: lateral view of blue pigment casted squirrel monkey brain. An additional animal was used to study the brain arterial vascular pattern of the squirrel monkey by injection of a plastic mixture through the ascending aorta. Highlighted in black are the main sulci. The pre-Rolandic and Rolandic branches of the middle cerebral artery that emerge from the depths of the lateral sulcus are highlighted in red. All craniectomies (outlined in white) in the 5 monkeys included the central sulcus on the caudal aspect, and the arcuate sulcus on the rostral aspect, bordered the lateral sulcus on the lateral aspect, and the sagittal sinus on the medial aspect. B and C: intracortical microstimulation (ICMS) mapping techniques were used to determine the extent of upper extremity motor representations in frontal cortex. In each case, the target of ischemic lesions was defined by a contiguous area bounded by the physiologically defined primary motor (M1) and ventral and dorsal premotor cortices (PMv and PMd) upper extremity representations, including digits (red), wrist/forearm (green) and proximal (blue) representations, and excluding M1 leg (purple) and trunk (light blue) representations and S1. Most of the face (yellow) representation was excluded, except for an area on the border between M1 and PMv. The outline of the lesion was delineated according to the physiological representation areas, but respecting also a general rule regarding the major blood vessel pattern shown in C (see text). Distal branches of the Rolandic (arrow) and pre-Rolandic (arrowheads) arteries are labeled. D and E: laser-Doppler blood flow images of the area of interest before (D) and 1 h after (E) the ischemic lesion. The scale depicts relative perfusion.
FIG. 2.
FIG. 2.
Lesion verification. Laser-Doppler images of each of the remaining four monkeys obtained 1 h after the infarct for each case. M1, PMV and PMD distal forelimb (DFL) locations are labeled and included in the infarct area. The outline of the intended lesion is superimposed on the Doppler image. ▸, location of supplementary motor area (SMA) in relation to the infarct. For simplicity, all images are shown in the right hemisphere.
FIG. 3.
FIG. 3.
Representative 50-μm-thick coronal section through the lesion stained with Cresyl violet, confirming the cortical location of the injury. Throughout the infarcted area, the lesion extended through all cortical layers. The underlying white matter was largely intact, except for some fibers near the center of the lesion, presumably due to degeneration of corticofugal neurons in the infarct zone. Histology was performed following perfusion 4 mo postinfarct.
FIG. 4.
FIG. 4.
Change in hand preference. Prior to the infarct, all monkeys (n = 5) were tested during 2 consecutive days for baseline Klüver Board performance to assess spontaneous forelimb use and hand preference. The monkeys demonstrated a clear asymmetry in hand use as they preferred one hand over the other on ∼75% of the 50 trials. After the infarct, when presented with the open board task, monkeys showed a change in hand preference, retrieving the pellets almost exclusively with their nonimpaired arm (i.e., the previously nondominant hand). This change in hand preference persisted throughout the 13-wk period of observation.
FIG. 5.
FIG. 5.
Klüver board performance. A: throughout the 13-wk postinfarct period, when the barrier was employed on the Klüver board to encourage the use of the impaired hand (filled squares), the monkeys were able to reach and attempt pellet retrievals but mostly unsuccessfully. Open squares, performance with the nonimpaired hand; asterisk, improvement in motor performance scores from postlesion week 1 to postlesion week 3. Scores at postlesion week 3 were significantly different from prelesion. B: motor performance scores for individual wells showed a trend in the degree of recovery from wells 1 to 5 reflecting the increasing level of difficulty in retrieving pellets from the smaller wells. For example, compare performance on well 1 (largest well; blue lines) to well 5 (smallest well; orange lines). For clarity, error bars are not shown. Note that the temporary decline in performance on week 4 is most likely a residual effect of the mapping procedure conducted after the probe trials on week 3.
FIG. 6.
FIG. 6.
Representative intracortical microstimulation (ICMS) map of DFL in SMA. A: in the squirrel monkey, the SMA DFL is exposed on the dorsal surface near the midline. B: SMA digit and wrist/forearm representations, outlined in red, are surrounded by proximal representations. Small dots represent microelectrode penetration sites, placed ∼250 μm apart. C: 2-dimensional color-coded reconstruction of an SMA DFL map.
FIG. 7.
FIG. 7.
ICMS maps of SMA DFL before and after cortical infarct. Colors represent the movement(s) evoked by electrical stimulation (60 μA) at that site. Prelesion neurophysiological maps of the DFL representation were compared with maps at postinfarct weeks 3 and 13. The total SMA DFL representation averaged 0.83 ± 0.05 (SE) mm2 at baseline, 0.56 ± 0.3 mm2 on postinfarct week 3, and 1.41 ± 0.23 mm2 on postinfarct week 13. The total DFL area included digit and wrist/forearm representations, which contributed 61 and 39%, respectively, at baseline, and then in different proportions on postinfarct weeks 3 and 13. The DFL area was further analyzed for individual digit and wrist/forearm representations. Sites where ICMS evoked combined distal and proximal movements were coded separately but grouped with either DFL or proximal representations according to the movement evoked at the lowest threshold.
FIG. 8.
FIG. 8.
Total SMA distal forelimb area (mm2) for preinfarct and postinfarct (PI) weeks 3 and13. The mean digit representation at preinfarct was 0.51 ± 0.041 mm2, 0.47 ± 0.33 mm2 on postinfarct week 3 and 0.43 ± 0.35 mm2 on postinfarct week 13 (ANOVA, F = 0.042, P = 0.96). Mean wrist/forearm representations showed a statistically significant increase on postinfarct week 13. Mean values were 0.32 ± 0.5 mm2 preinfarct, 0.09 ± 0.39 mm2 on postinfarct week 3, and 1.01 ± 0.3 SE mm2 on postinfarct week 13 (ANOVA, F = 9.27, P < 0.01; Fisher's for preinfarct vs. postinfarct week 3 P = 0.33; preinfarct vs. postinfarct week 13 P = 0.01; postinfarct week 3 vs. postinfarct week 13 P = 0.003).
FIG. 9.
FIG. 9.
Correlation between change in SMA total DFL representation and lesion size at postlesion week 13. The changes in DFL representation areas from preinfarct to postinfarct week 13 positively correlated with lesion size (R2 = 0.973, P = 0.0004).
FIG. 10.
FIG. 10.
Correlation between SMA total DFL representation and Klüver board performance score at postlesion week 13. Behavioral performance was positively correlated to the SMA total DFL representation on postlesion week 13 (R2 = 0.925, P = 0.005).
FIG. 11.
FIG. 11.
Temporal mismatch between recovery of motor performance and expansion of motor maps in SMA. In this smoothed rendition of the data derived from the present study, the preinfarct motor score (week 0) is set at 100%. Behavioral performance declined immediately after the infarct, then recovered to nearly 40% of preinfarct performance. Behavioral performance was relatively constant throughout the remaining 10 wk of postinfarct assessment. Map area (SMA DFL area) was set at 100% at the 13-wk time point, when the largest SMA DFL maps were observed. Preinfarct maps were ∼30% of the size of maps derived at 13 wk postinfarct. The mean map area declined to ∼10% at 3 wk postinfarct, a nonsignificant decrease. Finally, signficant and substantial map expansion occurred sometime between 3 and 13 wk postinfarct. There are several possible reasons why this temporal mismatch occurs as discussed in the text.

Similar articles

Cited by

References

    1. Aizawa H, Inase M, Mushiake H, Shima K, Tanji J. Reorganization of activity in the supplementary motor area associated with motor learning and functional recovery. Exp Brain Res 84: 668–671, 1991. - PubMed
    1. Boudrias MH, Belhaj-Saif A, Park MC, Cheney PD. Contrasting properties of motor output from the supplementary motor area and primary motor cortex in rhesus macaques. Cereb Cortex 16: 632–638, 2006. - PubMed
    1. Brinkman C Supplementary motor area of the monkey's cerebral cortex: short- and long-term deficits after unilateral ablation and the effects of subsequent callosal section. J Neurosci 4: 918–929, 1984. - PMC - PubMed
    1. Butefisch CM, Kleiser R, Seitz RJ. Post-lesional cerebral reorganisation: evidence from functional neuroimaging and transcranial magnetic stimulation. J Physiol 99: 437–454, 2006. - PubMed
    1. Cao Y, D'Olhaberriague L, Vikingstad EM, Levine SR, Welch KM. Pilot study of functional MRI to assess cerebral activation of motor function after poststroke hemiparesis. Stroke 29: 112–122, 1998. - PubMed

Publication types