. 2009 Mar;58(3):431-42.
doi: 10.1136/gut.2007.147207. Epub 2008 Jul 2.

Mechanisms regulating cytochrome c release in pancreatic mitochondria

Affiliations

Mechanisms regulating cytochrome c release in pancreatic mitochondria

I V Odinokova et al. Gut. 2009 Mar.

Abstract

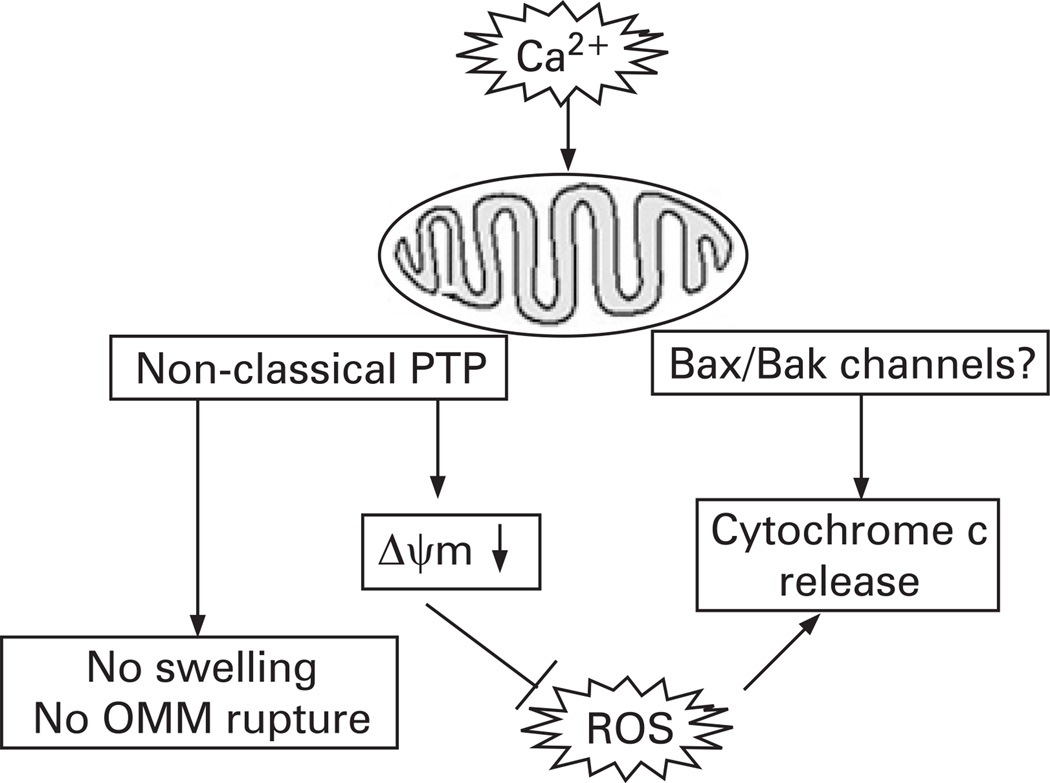
Background: Mechanisms of acinar cell death in pancreatitis are poorly understood. Cytochrome c release is a central event in apoptosis in pancreatitis. Here, we assessed the regulation of pancreatic cytochrome c release by Ca(2+), mitochondrial membrane potential (Delta Psi m), and reactive oxygen species (ROS), the signals involved in acute pancreatitis. We used both isolated rat pancreatic mitochondria and intact acinar cells hyperstimulated with cholecystokinin-8 (CCK-8; in vitro model of acute pancreatitis).

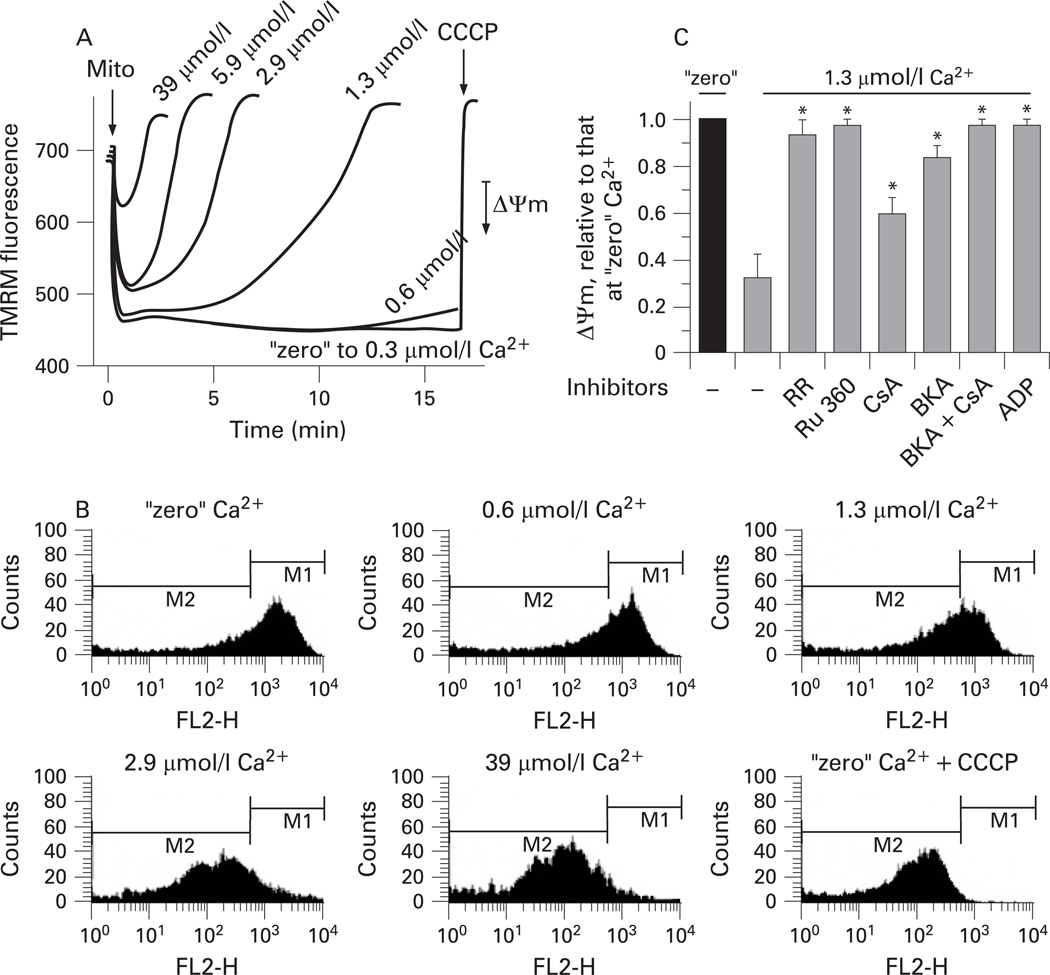
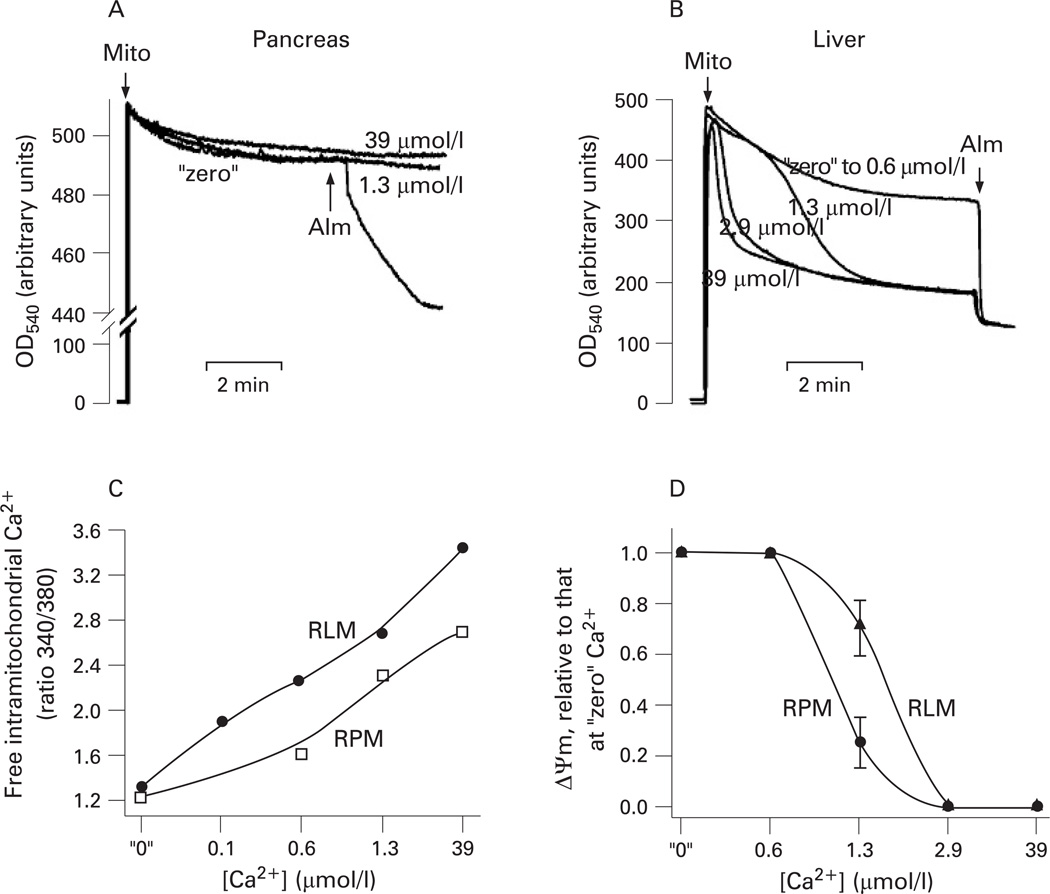
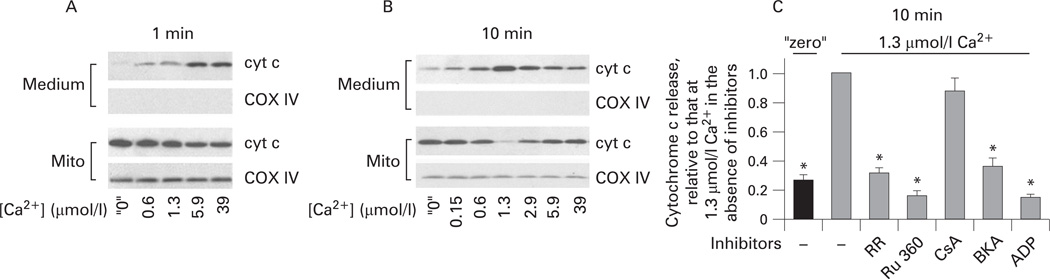
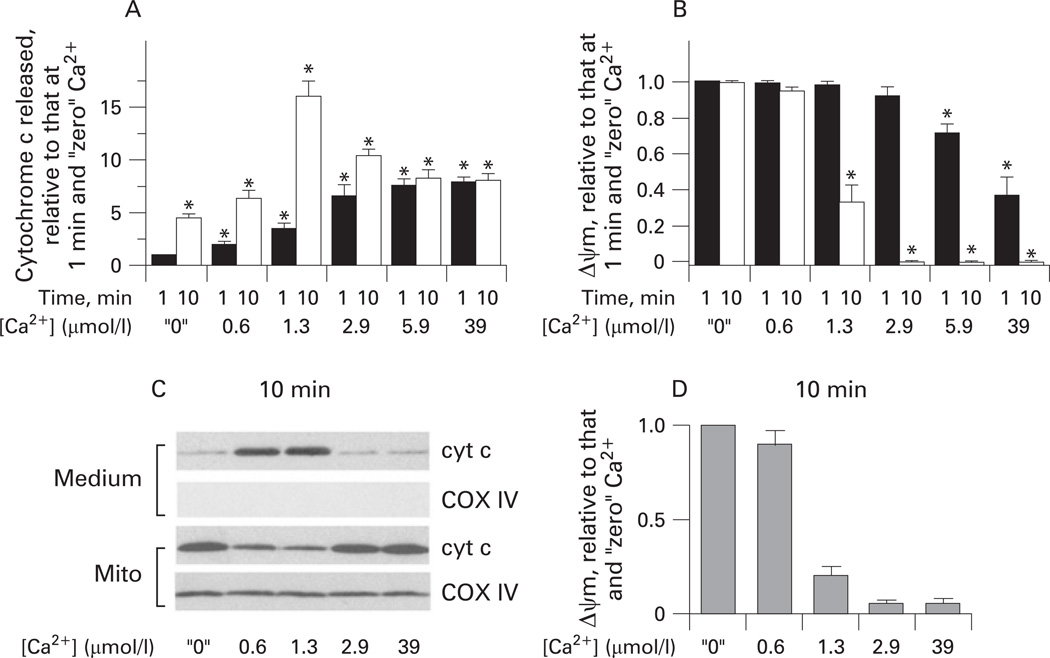
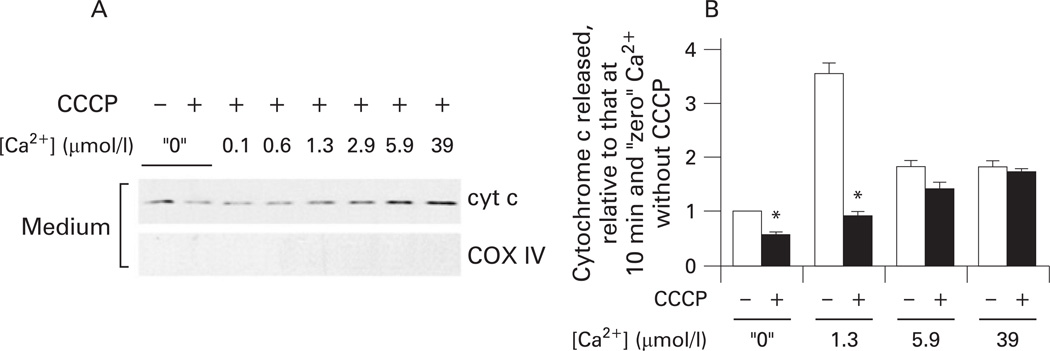
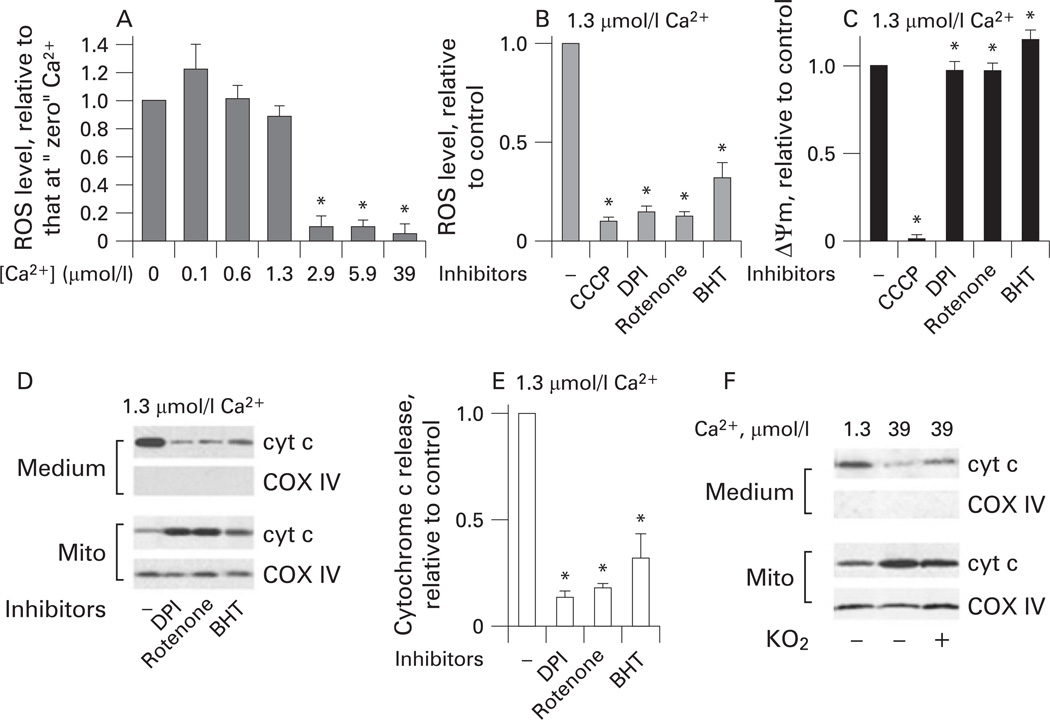
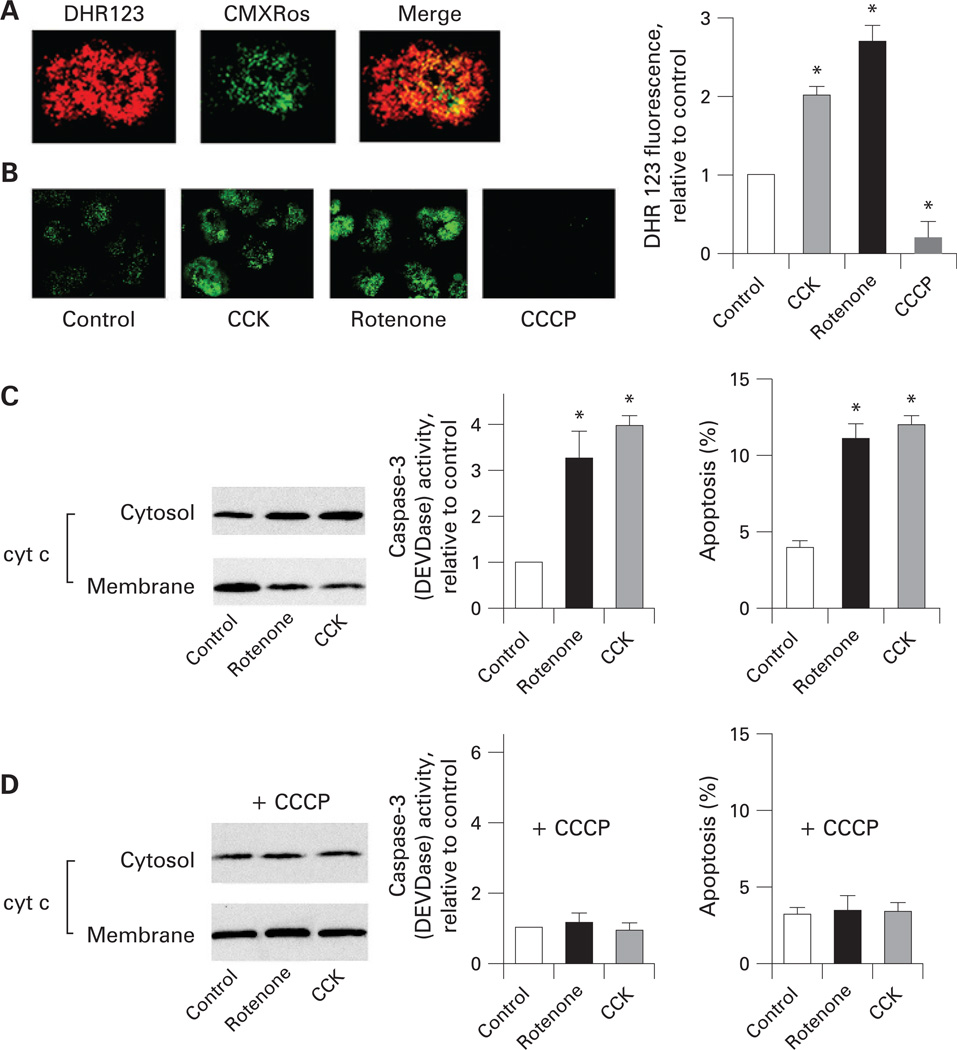
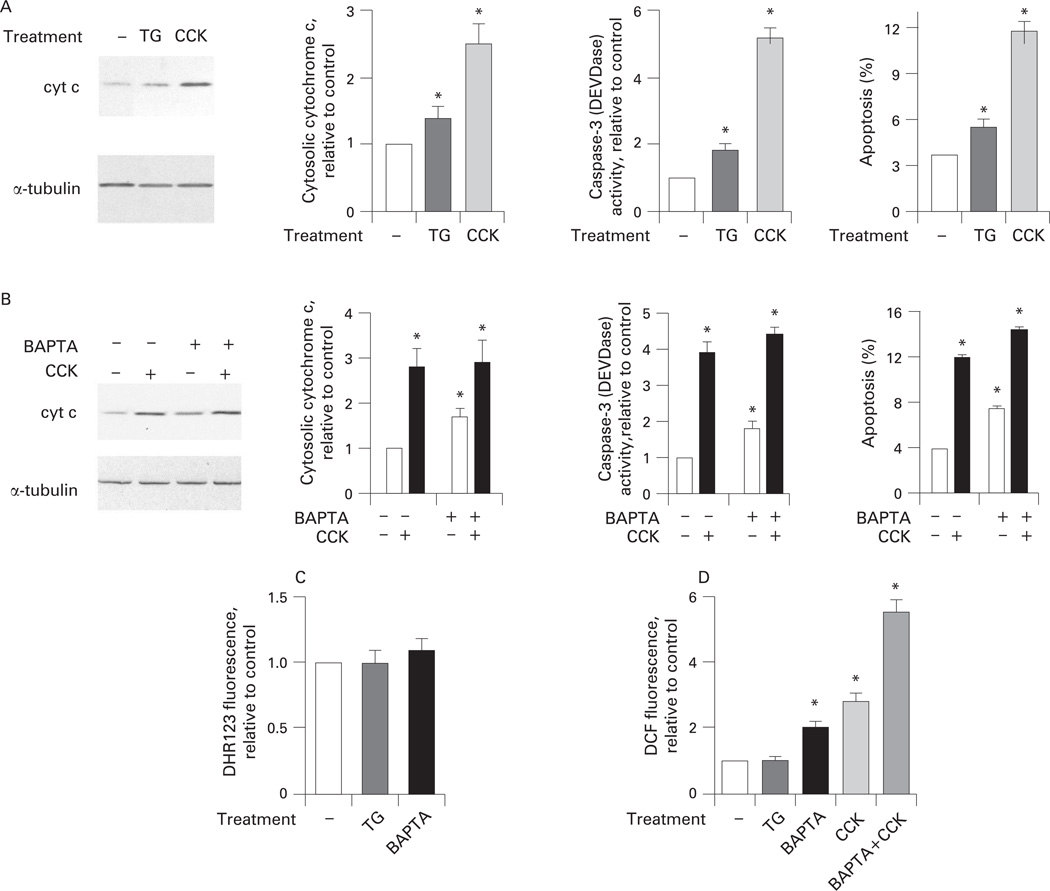
Results: Micromolar amounts of Ca(2+) depolarised isolated pancreatic mitochondria through a mechanism different from the "classical" (ie, liver) mitochondrial permeability transition pore (mPTP). In contrast with liver, Ca(2+)-induced mPTP opening caused a dramatic decrease in ROS and was not associated with pancreatic mitochondria swelling. Importantly, we found that Ca(2+)-induced depolarisation inhibited cytochrome c release from pancreatic mitochondria, due to blockade of ROS production. As a result, Ca(2+) exerted two opposite effects on cytochrome c release: Ca(2+) per se stimulated the release, whereas Ca(2+)-induced depolarisation inhibited it. This dual effect caused a non-monotonous dose-dependence of cytochrome c release on Ca(2+). In intact acinar cells, cytochrome c release, caspase activation and apoptosis were all stimulated by ROS and Ca(2+), and inhibited by depolarisation, corroborating the findings on isolated pancreatic mitochondria.

Conclusions: These data implicate ROS as a key mediator of CCK-induced apoptotic responses. The results indicate a major role for mitochondria in the effects of Ca(2+ )and ROS on acinar cell death. They suggest that the extent of apoptosis in pancreatitis is regulated by the interplay between ROS, Delta Psi m and Ca(2+). Stabilising mitochondria against loss of Delta Psi m may represent a strategy to mitigate the severity of pancreatitis.


Figures

Figure 1
Figure 1
Ca2+ dose- and time-dependently depolarises pancreatic mitochondria. Rat pancreatic mitochondria were isolated in the presence of 1 mmol/l ethylene glycol tetraacetic acid (EGTA) and incubated for the times indicated (A) or for 10 min (B,C) at different concentrations of free Ca2+ maintained with Ca2+/EGTA buffers (medium B). In this and other figures presenting the results on isolated mitochondria, 10 mmol/l succinate was used as the respiratory substrate if not stated otherwise. The mitochondrial membrane potential (ΔΨm) was measured by tetramethylrhodamine methyl ester (TMRM) fluorescence in the spectrofluorimeter cuvette (A,C) or by flow cytometry (B). Mitochondria (mito) and carbonyl cyanide m-chlorophenylhydrazone (CCCP; 5 µmol/l) were added as indicated. In (C), ΔΨm was measured in the presence and absence of the Ca2+ uniporter inhibitors, ruthenium red (RR; 1.5 µmol/l) and ruthenium red 360 (Ru 360; 2 µmol/l); or the mitochondrial permeability transition pore (mPTP) inhibitors cyclosporin A (CsA; 2 µmol/l), bongkrekic acid (BKA; 5 µmol/l) and ADP (100 µmol/l). ΔΨm values are means with the standard error (n=3) normalised to that for mitochondria incubated at “zero” Ca2+ without inhibitors. *p<0.05 vs mitochondria incubated without inhibitors at 1.3 µmol/l Ca2+. FL2H, TMRM fluorescence intensity; M1 and M2 are gating regions.
Figure 2
Figure 2
Ca2+ induces swelling in liver but not pancreatic mitochondria. Mitochondria were isolated from rat pancreas and liver in the presence of 1 mmol/l ethylene glycol tetraacetic acid (EGTA) and incubated in medium B for the times indicated (A,B) or 10 min (C,D) at various concentrations of free Ca2+. (A,B) Changes in light scattering were measured at 540 nm in pancreatic (A) or liver (B) mitochondria (mito) suspension. The pore-forming agent alamethicin (Alm; 40 µmol/l) was added as indicated. (C) Changes in the intra-mitochondrial free Ca2+ were measured by the ratio of fluorescence intensities at 340 nm and 380 nm in rat pancreatic mitochondria (RPM) or rat liver mitochondria (RLM) loaded with Fura-2 and incubated at the indicated concentrations of external free Ca2+. The data are representative of two experiments with similar results. (D) The mitochondrial membrane potential (ΔΨm) was measured in RPM or RLM with a tetraphenyl phosphonium ion (TPP+) electrode, and its values normalised to those for mitochondria incubated at “zero” Ca2+. Values are means with the standard error from at least three different preparations of mitochondria.
Figure 3
Figure 3
Dual effect of Ca2+ on cytochrome c (cyt c) release from pancreatic mitochondria. Rat pancreatic mitochondria were isolated in the presence of 1 mmol/l ethylene glycol tetraacetic acid (EGTA) and incubated for 1 min (A) or 10 min (B,C) in medium B at the indicated free Ca2+ concentrations. (A,B). Cytochrome c levels were measured by western blot analysis both in the incubation medium and the mitochondria pellet (mito). Blots were reprobed for the mitochondrial marker complex IV cytochrome C oxidase (COX IV) to assess the quality of mitochondrial separation and to confirm equal protein loading. (C) Cytochrome c release was measured in the presence and absence of the Ca2+ uniporter inhibitors, ruthenium red (RR; 1.5 µmol/l) and ruthenium red 360 (Ru 360; 2 µmol/l); or the mitochondrial permeability transition pore (mPTP) inhibitors cyclosporin A (CsA; 2 µmol/l), bongkrekic acid (BKA; 5 µmol/l) and ADP (100 µmol/l). The band intensity of cytochrome c released into the incubation medium was quantified by using densitometry and normalised to that at 1.3 µmol/l Ca2+ in the absence of the inhibitors. Values are means with the standard error (n=3). *p<0.05 vs mitochondria incubated at 1.3 µmol/l Ca2+ without inhibitors.
Figure 4
Figure 4
Ca2+-induced loss of mitochondrial membrane potential (ΔΨm) correlates with inhibition of cytochrome c (cyt c) release from pancreatic mitochondria. Rat pancreatic mitochondria were isolated in the presence of 1 mmol/l ethylene glycol tetraacetic acid (EGTA), and then incubated in medium B for 1 or 10 min at the concentrations of free Ca2+ indicated, in the presence of 10 mmol/l succinate (A,B) or 10 mmol/l glutamate plus 2.5 mmol/l malate (C,D) as the respiratory substrates. (A,C) Cytochrome c levels were measured by western blot analysis both in the incubation medium and the mitochondria pellet (mito). Blots were re-probed for the mitochondrial marker complex IV cytochrome C oxidase (COX IV) to assess the quality of mitochondria separation and to confirm equal protein loading. The band intensity of cytochrome c released into the medium during 1 min or 10 min incubation was quantified by using densitometry. (B,D) ΔΨm was measured in the same mitochondrial preparations by using a tetraphenyl phosphonium ion (TPP+) electrode. In (A,B), the values are means with the standard error from at least three different preparations of mitochondria, normalised to those for mitochondria incubated for 1 min at “zero” Ca2+. *p<0.05 vs mitochondria incubated for 1 min at “zero” Ca2+. In (D), the values are means with the ranges from two preparations of mitochondria, normalised to those for mitochondria incubated for 10 min at “zero” Ca2+.
Figure 5
Figure 5
Ca2+ exerts both mitochondrial membrane potential (ΔΨm)-dependent and -independent effects on cytochrome c (cyt c) release from pancreatic mitochondria. Rat pancreatic mitochondria were isolated in the presence of 1 mmol/l ethylene glycol tetraacetic acid (EGTA), and then incubated in medium B for 10 min at the indicated concentrations of free Ca2+, in the absence or presence of 1 µmol/l carbonyl cyanide m-chlorophenylhydrazone (CCCP). (A) Cytochrome c release was measured by western blot analysis. (B) The band intensity of cytochrome c released into the medium during 10 min incubation was quantified by using densitometry. Values are means with the standard error from at least three different preparations of mitochondria, normalised to those for mitochondria incubated at “zero” Ca2+ without CCCP. *p<0.05 vs mitochondria incubated without CCCP at the same concentration of Ca2+.
Figure 6
Figure 6
Inhibition of mitochondrial reactive oxygen species (ROS) prevents Ca2+-induced cytochrome c (cyt c) release from pancreatic mitochondria. Rat pancreatic mitochondria were isolated in the presence of 1 mmol/l ethylene glycol tetraacetic acid (EGTA), and then incubated in medium B for 10 min at the indicated concentrations of free Ca2+, in the absence or presence of the inhibitors of mitochondrial ROS production: the mitochondrial uncoupler carbonyl cyanide m-chlorophenylhydrazone (CCCP; 5 µmol/l); the complex I inhibitors diphenyliodonium (DPI) (15 µmol/l) and rotenone (2 µmol/l); or the lipid peroxidation inhibitor butylated hydroxytoluene (BHT; 10 µmol/l). (A,B). Changes in ROS levels in the mitochondria suspension were measured with Amplex Red. (C) Mitochondrial membrane potential (ΔΨm) was measured in the same mitochondria preparations with a tetraphenyl phosphonium ion (TPP+) electrode. (D–F) Cytochrome c levels in the incubation medium and the mitochondria (mito) were measured by western blot analysis. Blots were re-probed for complex IV cytochrome c oxidase (COX IV) to assess the quality of mitochondria separation and to confirm equal protein loading. The band intensity of cytochrome c released into the incubation medium was quantified by using densitometry. (F) The effect of superoxide generation with KO2 (1 mmol/l) on the release of cytochrome c from mitochondria. Values are means with the standard error from at least three different preparations, normalised to those for mitochondria incubated at “zero” Ca2+ (A) or without inhibitors (B,C,E). *p<0.05 vs mitochondria incubated at “zero” Ca2+ (A) or without inhibitors (B,C,E).
Figure 7
Figure 7
Reactive oxygen species (ROS) mediate cytochrome c (cyt c) release, caspase-3 activation, and apoptosis in pancreatic acinar cells. (A) Rat pancreatic acinar cells were labelled with the mitochondrial ROS-sensitive rhodamine dye DHR123 and the mitochondria marker MitoTracker Red (CMXRos), and analysed by confocal microscopy. (B) DHR123-labelled acinar cells were incubated for 15 min without (control) and with cholecystokinin-8 (CCK-8; 100 nmol/l), rotenone (5 µmol/l) or carbonyl cyanide m-chlorophenylhydrazone (CCCP; 5 µmol/l), and imaged using confocal microscopy. DHR123 fluorescence was quantified and normalised to the cell number in the field (at least 100 cells in three different cell preparations). Values are means with the standard error (n = 3) normalised to those in control (ie, untreated acinar cells). *p<0.05 vs control. (C,D). Pancreatic acinar cells were pre-incubated for 15 min with or without 5 µmol/l CCCP, and then incubated for 3 h with and without 5 µmol/l rotenone or 100 nmol/l CCK-8. In (C,D), cytochrome c levels were measured in cytosolic and membrane fractions by western blot analysis. Blots were re-probed for tubulin (cytosolic fractions) and for complex IV cytochrome c oxidase (COX IV, membrane fractions) to confirm equal protein loading (not shown). The band intensity of cytochrome c in the cytosolic fraction was quantified by using densitometry and normalised to that for tubulin in the same sample. Caspase-3 activity was measured with a fluorogenic assay, using Asp-Glu-Val-Asp-AMC (where AMC is 7-amino-4-methylcoumarin) (DEVD-AMC) as a substrate. Apoptosis was measured by the percentage of cells with apoptotic nuclear morphology using Hoechst 33258 staining. For each condition, at least 1000 cells were counted in three different acinar cell preparations. Values are means with the standard error (n=3) normalised to those in control (ie, acinar cells incubated without CCK and rotenone). *p<0.05 vs control cells.
Figure 8
Figure 8
Cholecystokinin (CCK)-induced apoptosis in pancreatic acinar cells is mediated through both Ca2+-dependent and -independent mechanisms. (A) Isolated rat pancreatic acinar cells were incubated for 3 h with and without CCK-8 (100 nmol/l) or thapsigargin (TG; 1 µmol/l). (B) Prior to the addition of CCK, cells were pre-incubated for 40 min with or without 50 µmol/l 1,2-bis(o-aminophenoxy)ethoxy-ethane-N′-tetraacetic acid (BAPTA-AM), washed, and re-suspended in the same buffer containing no BAPTA. The incubation continued for 3 more hours with and without CCK. In (A,B), cytochrome c (cyt c) levels were measured in cytosolic fractions by western blot analysis. Blots were re-probed for tubilin to confirm equal protein loading. Cytochrome c band intensity was quantified by using densitometry and normalised to that for tubulin in the same sample. Caspase-3 activity was measured with a fluorogenic assay, using Asp-Glu-Val-Asp-AMC (where AMC is 7-amino-4-methylcoumarin) (DEVD-AMC) as a substrate. Apoptosis was measured by the percentage of cells with apoptotic nuclear morphology using Hoechst 33258 staining. For each condition, at least 1000 cells were counted in three different acinar cell preparations. Values are means with the standard error (n = 3) normalised to those in controls (ie, acinar cells incubated without CCK, thapsigargin or BAPTA). *p<0.05 vs control cells. (C, D) Cells were labelled with (C) the rhodamine dye DHR123 sensitive to mitochondrial reactive oxygen species (ROS) or (D) 2,7-dichlorofluorescein (DCF) sensitive to both mitochondrial and non-mitochondrial ROS. Cells labelled with either DHR123 or DCF were incubated for 15 min without (control) and with thapsigargin (TG; 1 µmol/l) or CCK-8 (100 nmol/l), and imaged using confocal microscopy. DHR123 or DCF fluorescence was quantified and normalised to the cell number in the field. In experiments with BAPTA, cells were pre-incubated for 40 min with or without 50 µmol/l BAPTA-AM, washed, and re-suspended in the same buffer containing no BAPTA. Values are means with the standard error from three different cell preparations, normalised to those in controls (ie, untreated acinar cells). *p<0.05 vs control.
Figure 9
Figure 9
Schematic illustrating the regulation of cytochrome c release in pancreatic mitochondria. ΔΨm, mitochondrial membrane potential; OMM, outer mitochondrial membrane; PTP, permeability transition pore; ROS, reactive oxygen species.

Comment in

Similar articles

Cited by

References

    1. Gukovskaya AS, Pandol SJ. Cell death pathways in pancreatitis and pancreatic cancer. Pancreatology. 2004;4:567–586. - PubMed
    1. Halangk W, Lerch MM. Early events in acute pancreatitis. Clin Lab Med. 2005;25:1–15. - PubMed
    1. Kaiser AM, Saluja AK, Sengupta A, et al. Relationship between severity, necrosis, and apoptosis in five models of experimental acute pancreatitis. Am J Physiol Cell Physiol. 1995;269:C1295–C1304. - PubMed
    1. Gukovskaya AS, Perkins P, Zaninovic V, et al. Mechanisms of cell death after pancreatic duct obstruction in the opossum and the rat. Gastroenterology. 1996;110:875–884. - PubMed
    1. Sandoval D, Gukovskaya A, Reavey P, et al. The role of neutrophils and platelet-activating factor in mediating experimental pancreatis. Gastroenterology. 1996;111:1081–1091. - PubMed

Publication types