. 2008 Sep;295(3):C661-78.
doi: 10.1152/ajpcell.90650.2007. Epub 2008 Jul 2.

Large-scale quantitative LC-MS/MS analysis of detergent-resistant membrane proteins from rat renal collecting duct

Affiliations

Large-scale quantitative LC-MS/MS analysis of detergent-resistant membrane proteins from rat renal collecting duct

Ming-Jiun Yu et al. Am J Physiol Cell Physiol. 2008 Sep.

Abstract

In the renal collecting duct, vasopressin controls transport of water and solutes via regulation of membrane transporters such as aquaporin-2 (AQP2) and the epithelial urea transporter UT-A. To discover proteins potentially involved in vasopressin action in rat kidney collecting ducts, we enriched membrane "raft" proteins by harvesting detergent-resistant membranes (DRMs) of the inner medullary collecting duct (IMCD) cells. Proteins were identified and quantified with LC-MS/MS. A total of 814 proteins were identified in the DRM fractions. Of these, 186, including several characteristic raft proteins, were enriched in the DRMs. Immunoblotting confirmed DRM enrichment of representative proteins. Immunofluorescence confocal microscopy of rat IMCDs with antibodies to DRM proteins demonstrated heterogeneity of raft subdomains: MAL2 (apical region), RalA (predominant basolateral labeling), caveolin-2 (punctate labeling distributed throughout the cells), and flotillin-1 (discrete labeling of large intracellular structures). The DRM proteome included GPI-anchored, doubly acylated, singly acylated, cholesterol-binding, and integral membrane proteins (IMPs). The IMPs were, on average, much smaller and more hydrophobic than IMPs identified in non-DRM-enriched IMCD. The content of serine 256-phosphorylated AQP2 was greater in DRM than in non-DRM fractions. Vasopressin did not change the DRM-to-non-DRM ratio of most proteins, whether quantified by tandem mass spectrometry (LC-MS/MS, n=22) or immunoblotting (n=6). However, Rab7 and annexin-2 showed small increases in the DRM fraction in response to vasopressin. In accord with the long-term goal of creating a systems-level analysis of transport regulation, this study has identified a large number of membrane-associated proteins expressed in the IMCD that have potential roles in vasopressin action.


Figures
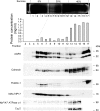
Fig. 1.
Fig. 1.
Preparation and characterization of inner medullary collecting duct (IMCD) detergent-resistant membrane (DRM) fractions. Kidneys from 20 adult Sprague-Dawley rats were used to prepare the IMCD cell suspension and, subsequently, DRM fractions by Triton X-100 detergent extraction and discontinuous sucrose gradient centrifugation. IMCD DRM fractions were located at the junction between 5% and 35% sucrose solutions, reflecting an indoor fluorescent lamp illumination with a dark background (15). Seventeen fractions (1–17) were collected from the top to the bottom of the centrifuge tube. A 10-μl protein sample from each fraction was used for immunoblot analysis. DRM fractions (fractions 5–7) were enriched with membrane raft marker proteins (flotillin-1 and MAL/VIP17) and deenriched of some integral membrane proteins [calnexin, Na+-K+-ATPase α1-subunit, and Na+- and Cl-dependent taurine transporter (TauT)].
Fig. 2.
Fig. 2.
Label-free quantification of MAL2 protein using QUOIL software. A–C: reconstructions of liquid chromatographic (LC) elution profiles of the MAL2 peptide (ITLPAGPDILR with +2 charge) identified in gel slices k, m, and o (see supplemental Fig. S1). Solid line, elution profile reconstructed from fraction 5 (Fr 5); dashed line, elution profile reconstructed from fraction 14 (Fr 14). Areas under the elution profile of the identified MAL2 peptide were used for MAL2 protein (NP_942081.2) quantification by QUOIL software.
Fig. 3.
Fig. 3.
Quantitative analysis of proteins identified in fractions 5 (DRM fraction) and 14 (non-DRM fraction) in IMCD cells. Relative protein abundance in DRM and non-DRM fractions was calculated using QUOIL software on the basis of relative abundance of peptides identified for that protein in fractions 5 and 14. Quantification was based on areas of the LC elution profiles of peptides identified in both fractions (see Fig. 2). Numbers of proteins identified were plotted against mean log2 values of peptide abundance ratios in fractions 5 and 14. Grey bars indicate a total of 639 proteins with ≥3 reconstructed peptide elution profiles for the quantification. Black bars indicate a total of 384 proteins that passed the Student's t-test (P < 0.1) for qualification as IMCD DRM proteins (enriched in fraction 5) or as non-DRM proteins (enriched in fraction 14); 186 proteins were considered IMCD DRM proteins (black bars with mean log2 values >0); 198 proteins were considered non-DRM proteins (black bars with mean log2 values <0). Enrichment in either fraction could not be determined for 255 proteins that did not pass the t-test (P > 0.1). Some sample proteins are shown, along with their RefSeq accession numbers in parentheses.
Fig. 4.
Fig. 4.
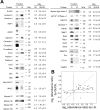
A: immunoblot analysis of proteins identified in fraction 5 (IMCD DRM fraction) vs. fraction 14 (non-DRM fraction). Protein (10 μg) of fractions 5 and 14 was separated on a 4–15% SDS-polyacrylamide gel and transferred to a nitrocellulose membrane. Proteins were detected with primary antibodies and visualized with fluorophore-coupled species-specific antibodies. Band intensity was quantified using the Odyssey Infrared Imaging System. Log2 values of protein abundance ratios in fraction 5 vs. fraction 14 by immunoblot (IB) analysis and QUOIL software (means ± SE) analysis are shown. B: results obtained by QUOIL software plotted against results from immunoblot analysis. Solid line, linear regression of 32 data points; dashed line, identical results from QUOIL and immunoblot analysis. RefSeq accession numbers are as follows: NP_112406.1 for β-actin, NP_063970.1 for annexin A2, NP_077069.3 for annexin A4, NP_036910.1 for AQP1, NP_037041.2 for AQP2, NP_742005.1 for calnexin, NP_598412.1 for caveolin-1, NP_112624.1 for E-cadherin, NP_062230.1 for ezrin, NP_073192.1 for flotillin-1, NP_114018.1 for flotillin-2, NP_001013137.1 for Gαi3, NP_062005.1 for Gαs, NP_112249.1 for Gβ1, NP_112299.1 for Gβ2, NP_942081.2 for MAL2, NP_037115.2 for myosin IC, NP_037326.1 for myosin IIA, NP_113708.1 for myosin IIB, NP_058779.1 for myosin VB, NP_059039.1 for myosin light chain 2, NP_036636.1 for Na+-K+-ATPase α1-subunit, NP_062007.1 for NKCC2, NP_068641.2 for syntaxin 7, NP_001073405.1 for Rab5b, NP_112414.1 for Rab11a, NP_112355.1 for RalA, NP_001005765.1 for Rap1a, NP_073180.1 for SNAP23, NP_114183.1 for Src, NP_062220.1 for UT-A1, and NP_036795.1 for VAMP2. Caveolin-2, MAL, Sec6, and Sec8 were not identified by mass spectrometry.
Fig. 5.
Fig. 5.
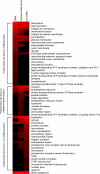
Cellular component gene ontology (GO) term analysis of proteins identified in IMCD DRM fraction, indeterminable protein group, and non-DRM fraction. In the IMCD DRM fraction, 425 cellular component GO terms were associated with 186 unique protein identifications. In the indeterminable group, 433 cellular component GO terms were associated with 255 protein identifications. In the IMCD non-DRM fraction, 316 cellular component GO terms were associated with 198 unique protein identifications. The 30 most frequently occurring GO terms in each fraction were grouped into 3 classes: those predominant in the IMCD DRM fraction, those predominant in the indeterminable group, and those predominant in the non-DRM fraction.
Fig. 6.
Fig. 6.
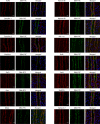
Confocal immunofluorescence localization of 14 DRM proteins in rat kidney sections. Localization of proteins was detected indirectly using primary antibodies followed by species-specific secondary antibodies (red). Fluorescein (FITC)-conjugated Dolichos biflorus agglutinin (DBA) was used to identify IMCDs (green). Labeling with DBA is largely at the apical plasma membrane. Nuclei were visualized with 4′,6-diamidino-2-phenylindole (blue). Scale bars, 10 μm. RefSeq accession numbers are as follows: NP_037041.2 for AQP2, NP_598412.1 for caveolin-1, NP_073192.1 for flotilllin-1, NP_001013137.1 for Gαi3, NP_062005.1 for Gαs, NP_942081.2 for MAL2, NP_113708.1 for myosin IIB, NP_058779.1 for myosin VB, NP_112414.1 for Rab11a, NP_112355.1 for RalA, NP_073180.1 for SNAP23, and NP_068641.2 for syntaxin 7. Caveolin-1 was identified in the indeterminable protein group. Caveolin-2 and Sec8 were identified by immunoblotting, but not by mass spectrometry.
Fig. 7.
Fig. 7.
Confocal immunofluorescence localization of 3 classical membrane raft protein markers in rat kidney sections. Localization of proteins was detected indirectly using primary antibodies followed by species-specific secondary antibodies: MAL2 (green) and caveolin-2 and flotillin-1 (red). Nuclei were visualized with 4′,6-diamidino-2-phenylindole (blue). Scale bars, 10 μm. RefSeq accession numbers are as follows: NP_073192.1 for flotillin-1 and NP_942081.2 for MAL2.
Fig. 8.
Fig. 8.
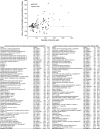
Kyte-Doolittle hydrophilicity analysis of integral membrane proteins (IMPs). IMPs identified in the IMCD DRM fraction (DRM IMP, n = 58) were compared with IMPs randomly selected from previous studies (Random IMP, n = 58). Hydrophilicity indices of each amino acid of a protein was calculated on the basis of a window of 7 amino acids using a World Wide Web interface to the utilities within the Genetics Computer Group (GCG) suite of sequence analysis programs (GCG-Lite, http://molbio.info.nih.gov/molbio/gcglite/). Sum of the hydrophilicity indices of amino acids in a protein (Sum) was assumed to correlate with overall hydrophilicity of the protein and plotted against the number of amino acids (aa) in the protein.
Fig. 9.
Fig. 9.
A: immunoblot assessment of purity and viability of IMCD cell suspension. Each lane was loaded with 10 μg of proteins from IMCD cell suspension (lane I), non-IMCD cell suspension (lane N), and whole inner medulla suspension (lane W) isolated from 20 rats. Antibodies against IMCD marker protein AQP2 and non-IMCD marker protein AQP1 were used to assess purity of cell suspension. Half of IMCD cell suspension was treated with vehicle (lane V) and the other half with [deamino-Cys1,d-Arg8]vasopressin (dDAVP, lane D) for 20 min. Viability of IMCD cell suspension was tested using rabbit antibody against phosphorylated AQP2 at serine 256 (AQP2 256Sp) (41) and chicken antibody against total AQP2 (1). Molecular weight markers are indicated. B: immunoblot assessment of IMCD DRM preparation from vehicle- and 1 nM dDAVP-treated (20 min) IMCD cells. DRM fraction was enriched in fraction 5, where staining for membrane raft marker MAL/VIP17 was the strongest. AQP2 was found in IMCD DRM and non-DRM fractions. Each lane was loaded with a 10-μl protein sample.
Fig. 10.
Fig. 10.
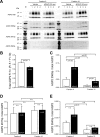
A: representative immunoblots showing effects of dDAVP on association of AQP2 with IMCD DRM fraction. For each experiment (1–4), 20 rats were used for preparation of IMCD cell suspension. Half of suspension was treated with vehicle and the other half with dDAVP for 20 min before DRM preparation. Each lane was loaded with 10 μl of protein from fractions 5 (DRM fraction) and 10 (non-DRM fraction) for immunoblot analysis. AQP2 phosphorylated at serine 256 (AQP2 256Sp), 261 (AQP2 261Sp), and 264 (AQP2 264Sp) was detected with phosphoserine-specific rabbit antibodies (14, 18, 41). Total AQP2 was detected with the chicken antibody (1) that detects nonphosphorylated AQP2 peptide and phosphorylated AQP2 peptides at serines 256 and 261, but not 264 (unpublished data). Lane M, molecular weight markers. B–E: summary of results from 8 experiments, including Fig. 10A and supplemental Fig. S8.
Fig. 11.
Fig. 11.
Immunoblot analysis of effects of dDAVP on association of selected proteins with IMCD DRM fraction. For each experiment (14), 20 rats were used for preparation of IMCD cell suspension. Half of suspension was treated with vehicle and the other half with dDAVP for 20 min before DRM preparation. Each lane was loaded with 10 μl of protein from fractions 5 (DRM fraction) and 10 (non-DRM fraction) for immunoblot analysis.

Similar articles

Cited by

References

    1. Barile M, Pisitkun T, Yu MJ, Chou CL, Verbalis MJ, Shen RF, Knepper MA. Large-scale protein identification in intracellular aquaporin-2 vesicles from renal inner medullary collecting duct. Mol Cell Proteomics 4: 1095–1106, 2005. - PMC - PubMed
    1. Beausoleil SA, Villen J, Gerber SA, Rush J, Gygi SP. A probability-based approach for high-throughput protein phosphorylation analysis and site localization. Nat Biotechnol 24: 1285–1292, 2006. - PubMed
    1. Brown D, Roth J, Orci L. Lectin-gold cytochemistry reveals intercalated cell heterogeneity along rat kidney collecting ducts. Am J Physiol Cell Physiol 248: C348–C356, 1985. - PubMed
    1. Brown DA Lipid rafts, detergent-resistant membranes, and raft targeting signals. Physiology (Bethesda) 21: 430–439, 2006. - PubMed
    1. Brown DA, Rose JK. Sorting of GPI-anchored proteins to glycolipid-enriched membrane subdomains during transport to the apical cell surface. Cell 68: 533–544, 1992. - PubMed

Publication types

MeSH terms

LinkOut - more resources