. 2008 Sep;19(9):3909-22.
doi: 10.1091/mbc.e08-04-0433. Epub 2008 Jul 2.

RACK1 regulates directional cell migration by acting on G betagamma at the interface with its effectors PLC beta and PI3K gamma

Affiliations

RACK1 regulates directional cell migration by acting on G betagamma at the interface with its effectors PLC beta and PI3K gamma

Songhai Chen et al. Mol Biol Cell. 2008 Sep.

Abstract

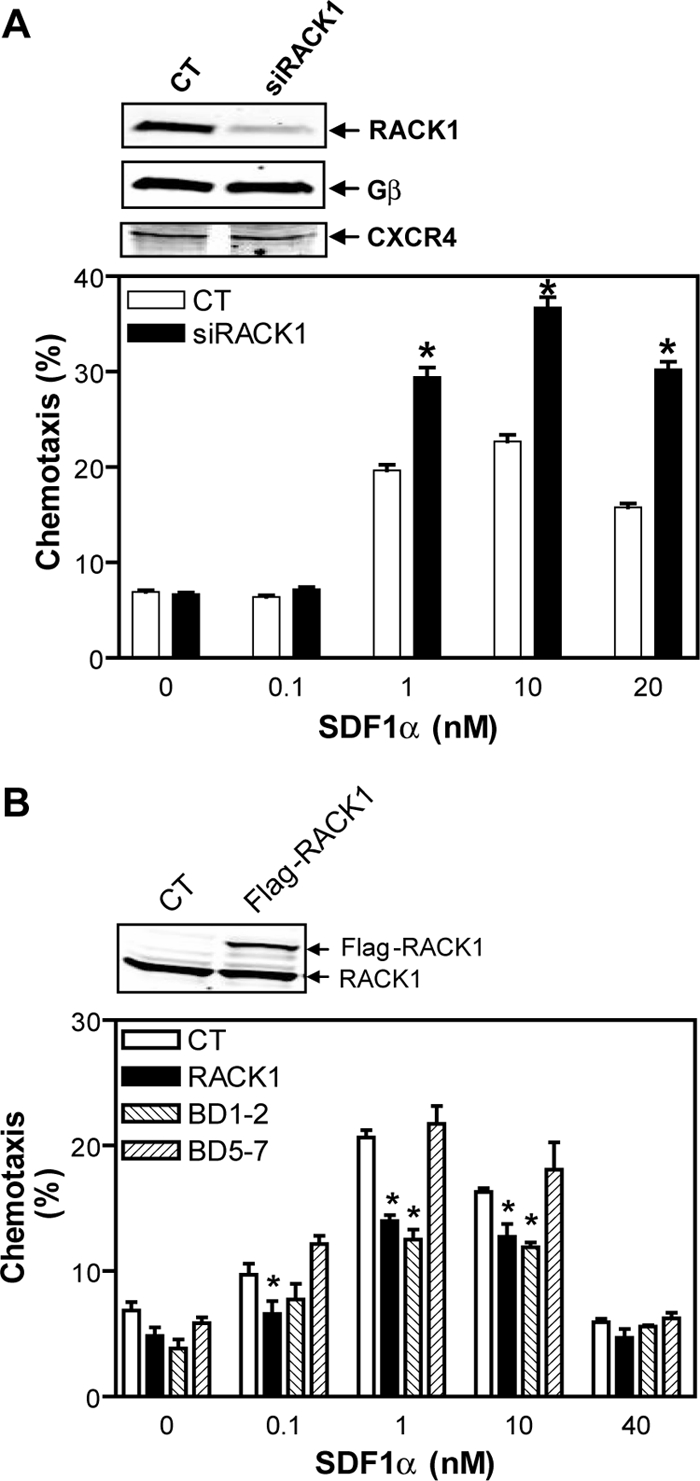
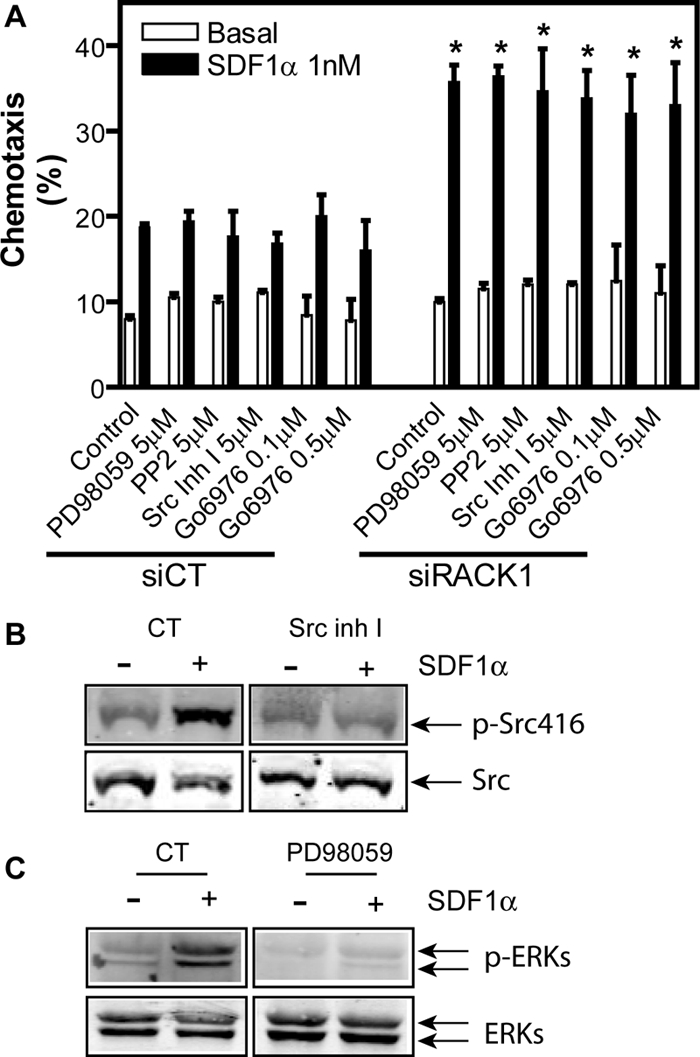
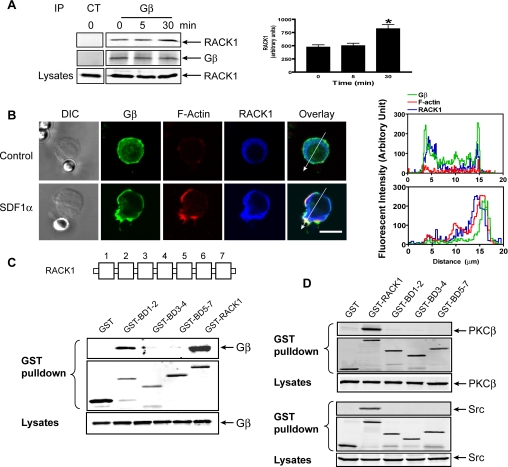
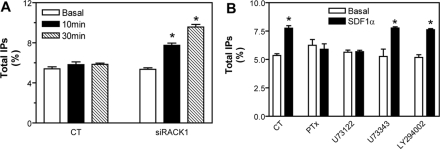
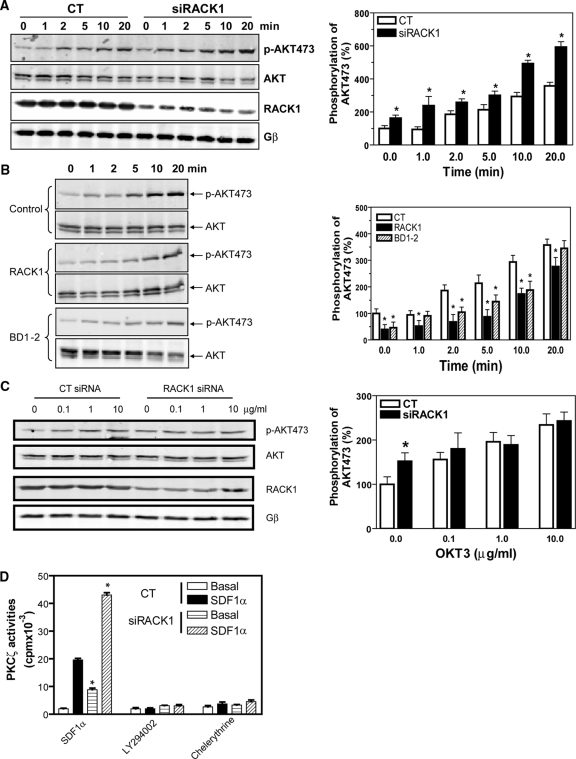
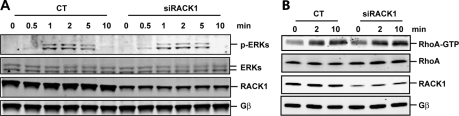
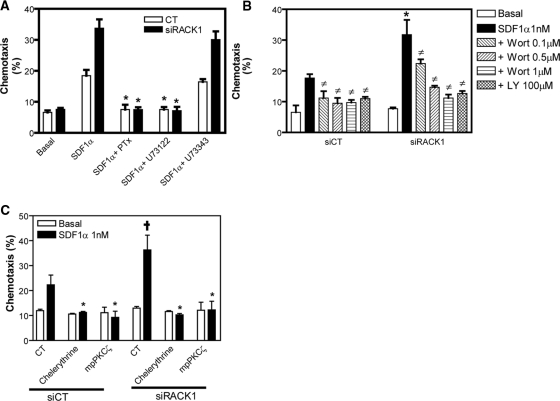
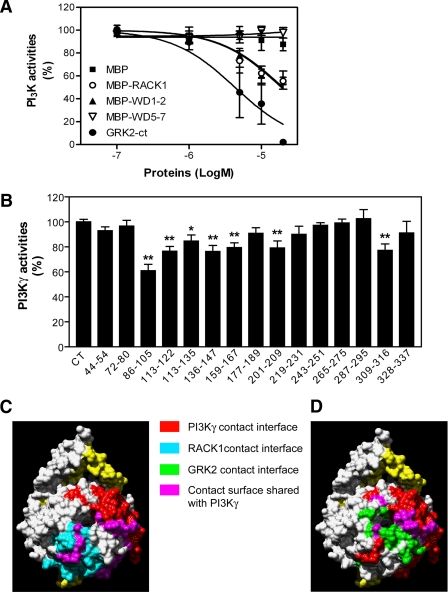
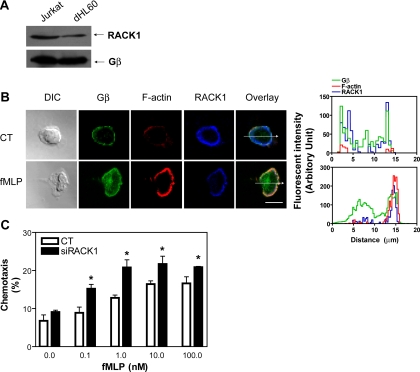
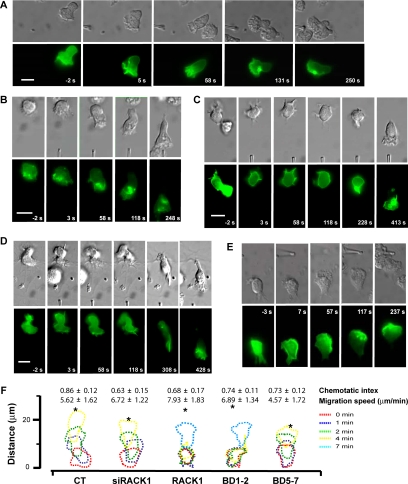
Migration of cells up the chemoattractant gradients is mediated by the binding of chemoattractants to G protein-coupled receptors and activation of a network of coordinated excitatory and inhibitory signals. Although the excitatory process has been well studied, the molecular nature of the inhibitory signals remains largely elusive. Here we report that the receptor for activated C kinase 1 (RACK1), a novel binding protein of heterotrimeric G protein betagamma (G betagamma) subunits, acts as a negative regulator of directed cell migration. After chemoattractant-induced polarization of Jurkat and neutrophil-like differentiated HL60 (dHL60) cells, RACK1 interacts with G betagamma and is recruited to the leading edge. Down-regulation of RACK1 dramatically enhances chemotaxis of cells, whereas overexpression of RACK1 or a fragment of RACK1 that retains G betagamma-binding capacity inhibits cell migration. Further studies reveal that RACK1 does not modulate cell migration through binding to other known interacting proteins such as PKC beta and Src. Rather, RACK1 selectively inhibits G betagamma-stimulated phosphatidylinositol 3-kinase gamma (PI3K gamma) and phospholipase C (PLC) beta activity, due to the competitive binding of RACK1, PI3K gamma, and PLC beta to G betagamma. Taken together, these findings provide a novel mechanism of regulating cell migration, i.e., RACK1-mediated interference with G betagamma-dependent activation of key effectors critical for chemotaxis.


Figures

Figure 1.
Figure 1.
RACK1 inhibits chemotaxis of Jurkat cells. (A) Transfection of Jurkat cells with a siRNA against RACK1 (siRACK1) but not control siRNA (CT) enhances SDF1α-stimulated Jurkat cell migration. Chemotaxis was determined by the modified Boyden chamber assays. Inset, Western blots show expression of RACK1, Gβ, and CXCR4 in Jurkat cells transfected with the indicated siRNAs. (B) Jurkat cells stably expressing RACK1 and the deletion mutant BD1–2 but not BD5–7 exhibit decreased chemotactic response to SDF1α. CT, control cells transfected with vector alone. Inset, Western blot shows expression of endogenous RACK1 and Flag-RACK1 in control (CT) cells or cells stably expressing Flag-RACK1. *p < 0.05, significant difference versus control.
Figure 2.
Figure 2.
The role of Src, ERK and PKC in SDF1α-stimulated Jurkat cell migration. (A) Jurkat cells transfected with a control siRNA (siCT) or RACK1 siRNA were pretreated with or without (control) the indicated inhibitors. The transwell migration of Jurkat cells was then induced with or without (basal) 1 nM SDF1α. *p < 0.05, significance versus siCT. (B and C) Effects of the inhibitors on Src (B) and ERK (C) activation. Jurkat cells were pretreated with or without (CT) Src inhibitor I (Src Inh I) or MAPK inhibitor (PD98059) and then stimulated with SDF1α (20 nM for Src and 50 nM for ERKs) for 15 and 2 min, respectively. The activation of Src and ERKs was detected by the indicated specific antibodies against phosphorylated proteins.
Figure 3.
Figure 3.
Interaction of RACK1 with Gβγ. (A) Association of RACK1 with Gβγ was determined after stimulation of Jurkat cells with SDF1α (20 nM) for the indicated times, and Gβγ was immunoprecipitated from the cell lysates with a control antibody (CT) or Gβ antibody that recognizes Gβ1, 2, 3, and 4 isoforms. The presence of RACK1 and Gβ in the precipitate was detected by specific antibodies. Left panel, representative Western blots; right panel, quantitative data. *p < 0.05, significant difference versus 0 min. (B) Colocalization of RACK1 and Gβγ in Jurkat cells. Cells were treated with control beads or SDF1α-conjugated beads for 2 min and then stained with specific antibodies or Alexa-568–conjugated phalloidin for F-actin. Distraction interference contrast (DIC) and fluorescent images are shown. Bar, 10 μm. The graphs on the right panel show the distribution of fluorescent intensity of Gβ, F-actin, and RACK1 along the line drawn across the cells. The images are the representatives of more than 20 cells from at least three separate experiments with similar results. (C and D) Association of RACK1 and its mutants with Gβ1γ2 (C), PKCβ or Src (D) was determined by GST pulldown assays after coexpression of HA-Gβ1γ2, PKCβ, or Src with the indicated constructs in HEK293 cells. The presence of the proteins in the GST pulldown pellets and lysates was detected with specific antibodies. A schematic representation of RACK1 structure is shown in the top panel of C.
Figure 4.
Figure 4.
RACK1 regulates PLC activity. (A) Total IP production in Jurkat cells transfected with control (CT) or RACK1 siRNA (siRACK1) and stimulated with SDF1α (500 nM) for the indicated times. (B) RACK1 siRNA-transfected Jurkat cells were pretreated in the absence (CT) or presence of PTx (0.2 μg/ml) overnight, 5 μM of U73122 or U73343, or 50 μM of LY294002 for 1 h, and then stimulated with SDF1α for 10 min before the measurement of total IPs. *p < 0.05, significant difference versus basal.
Figure 5.
Figure 5.
RACK1 specifically regulates SDF1α-stimulated PI3K and PKCζ activities in Jurkat cells. (A–C) AKT phosphorylation at serine 473 in Jurkat cells. Cells were transiently transfected with control (CT) or RACK1 siRNA (A and C), or stably transfected with a control vector, RACK1, or BD1–2 (B) and stimulated with SDF1α (20 nM; A and B) for the indicated times or stimulated with OKT3 antibody at the indicated concentrations for 10 min (C). Representative Western blots are shown on the left panel, and quantitative analysis of data from at least three independent experiments and expressed as percentage increase over the basal in control cells is shown on the right. *p < 0.05, significant difference versus control. (D) RACK1 regulates PKCζ activity. Control (CT) or RACK1 siRNA-transfected Jurkat cells were pretreated in the absence (SDF1α and chelerythrine) or presence of LY294002 (50 μM) and stimulated with SDF1α (50 nM) for 5 min. PKCζ was then immunoprecipitated and assayed for its activity in the presence or absence of chelerythrine (10 μM). *p < 0.05, significance versus control siRNA-treated cells.
Figure 6.
Figure 6.
RACK1 does not affect ERK and RhoA activation. (A and B) The activities of ERKs (A) and RhoA (B) in Jurkat cell transfectants stimulated with SDF1α (100 nM) for the indicated times. The level of total ERKs and RhoA, RACK1, and Gβ is also displayed.
Figure 7.
Figure 7.
SDF1α-induced chemotaxis of Jurkat cells involves PLC, PI3K, and PKCζ. (A–C) Jurkat cell transfectants were pretreated with or without the indicated inhibitors. The chemotactic response of cells to buffer alone (basal) or 1 nM of SDF1α is then determined. (A) *p < 0.05, significant difference versus chemotaxis induced by SDF1α alone. (B) *p < 0.05, significant difference versus SiCT. p < 0.05, significant difference versus chemotaxis induced by SDF1α alone. (C) *p < 0.05, significant difference versus chemotaxis induced by SDF1α alone. p < 0.05, significant difference versus SiCT. Wort, wortmannin; LY, LY294002; mpPKCζ, myristoylated psudosubstrate of PKCζ.
Figure 8.
Figure 8.
RACK1 inhibits Gβ1γ2-stimulated PI3Kγ activity. (A) The activity of purified PI3Kγ stimulated by Gβ1γ2 was measured in the presence of increasing concentration of various proteins as indicated. (B) Effects of peptides on Gβ1γ2-mediated PI3Kγ activation. The activity of PI3Kγ was measured in the absence (CT) or presence of various Gβ1-derived peptides (0.5 mM). *p < 0.05 and **p < 0.01, significant difference versus the activity of PI3Kγ in the absence of peptides. (C and D) Structural determinants of Gβ1 for interactions with PI3Kγ and RACK1 (C) and GRK2 (D). Based on the crystal coordinates of Gβ1γ1 (Sondek et al., 1996), the molecular surface of Gβ1γ1 was generated using the UCSF chimera package (Pettersen et al., 2004). The surface that interacts with PI3Kγ was generated based on the data from B, whereas those for RACK1 and GRK2 were from previous reports (Lodowski et al., 2003; Chen et al., 2005).
Figure 9.
Figure 9.
Expression, cellular distribution and functions of RACK1 in dHL60 cells. (A) Immunoblot showing expression of RACK1 and Gβ in Jurkat and dHL60 cells. An equal number of cells (2 × 10⁶) was loaded. (B) Cellular distribution of RACK1 and Gβ in dHL60 cells treated with or without (control) a uniform concentration of fMLP (0.5 μM) for 3 min. Cells were stained with specific antibodies against Gβ and RACK1. F-actin was labeled with Alexa-568–conjugated phalloidin. DIC and fluorescent images are shown. Bar, 10 μm. The graphs on the right show the distribution of fluorescent intensity of Gβ, F-actin, and RACK1 along the line drawn across the cells. The images are the representatives of more than 20 cells from at least three separate experiments with similar results. (C) Down-regulation of RACK1 enhances chemotactic response of dHL60 cells. dHL60 cells were transfected with GFP, together with a control siRNA (CT) or a siRNA against RACK1. Chemotaxis of GFP-positive cells was determined by the modified Boyden chamber assays. *p < 0.05, significance versus control.
Figure 10.
Figure 10.
RACK1 regulates migration of dHL60 cells toward a point source of fMLP. (A–E) Time-lapse images of dHL60 cell migration toward a point source of fMLP. dHL60 cells were transfected with PH-AKT-GFP together with a control (A), RACK1 siRNA (B), RACK1 (C), BD1–2 (D), or BD5–7 (E). The migration of cells imaged by Nomarski microscopy (top panel) and the spatial localization of PH-AKT-GFP (bottom panel) at the indicated times before and after fMLP stimulation are shown. Time-lapse videos of these cells are shown in the Supplemental Material. Bar, 10 μm. (F) Outlines of dHL60 cells responding to stimulation of fMLP (10 μM) delivered by a micropipette. Each set of outlines represents the migration path of a single cell from each transfection condition at the indicated time intervals after exposure to fMLP. Asterisks (*) indicate the location of stimuli. The chemotactic index and migration speed of the corresponding transfected cells calculated from multiple experiments are also shown. For cells expressing RACK1 and BD1–2, the chemotactic index and migration speed were calculated after the beginning of directional migration. Data are expressed as the mean ± SEM.

Similar articles

Cited by

References

    1. Bach T. L., et al. Phospholipase cbeta is critical for T cell chemotaxis. J. Immunol. 2007;179:2223–2227. - PMC - PubMed
    1. Balkwill F. Cancer and the chemokine network. Nat. Rev. Cancer. 2004;4:540–550. - PubMed
    1. Blackmer T., Larsen E. C., Takahashi M., Martin T. F., Alford S., Hamm H. E. G protein betagamma subunit-mediated presynaptic inhibition: regulation of exocytotic fusion downstream of Ca2+ entry. Science. 2001;292:293–297. - PubMed
    1. Buensuceso C. S., Obergfell A., Soriani A., Eto K., Kiosses W. B., Arias-Salgado E. G., Kawakami T., Shattil S. J. Regulation of outside-in signaling in platelets by integrin-associated protein kinase C beta. J. Biol. Chem. 2005;280:644–653. - PubMed
    1. Buensuceso C. S., Woodside D., Huff J. L., Plopper G. E., O'Toole T. E. The WD protein Rack1 mediates protein kinase C and integrin-dependent cell migration. J. Cell Sci. 2001;114:1691–1698. - PubMed

Publication types

MeSH terms

LinkOut - more resources