

Review
doi: 10.1056/NEJMra0708473.
Effect of in utero and early-life conditions on adult health and disease
Affiliations
- PMID: 18596274
- PMCID: PMC3923653
- DOI: 10.1056/NEJMra0708473
Item in Clipboard
Review
Effect of in utero and early-life conditions on adult health and disease
N Engl J Med.
.
No abstract available
Figures
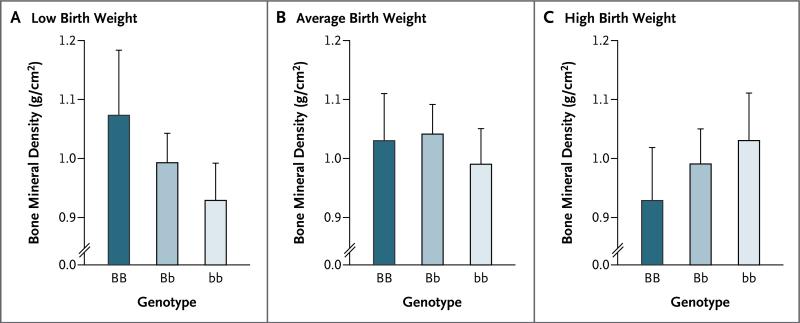
Among persons in the lowest third of the birth-weight distribution, spine bone mineral density was significantly higher among persons of genotype BB than among persons of the Bb or bb genotype (P = 0.01) after adjustment for age, sex, and current weight. In contrast, in the highest third of the birth-weight distribution, spine bone mineral density was reduced among persons of genotype BB as compared with persons of the Bb or bb genotype (P = 0.04). A significant interaction was found between vitamin D receptor genotype and birth weight as determinants of bone mineral density (P = 0.02). Adapted from Dennison et al.
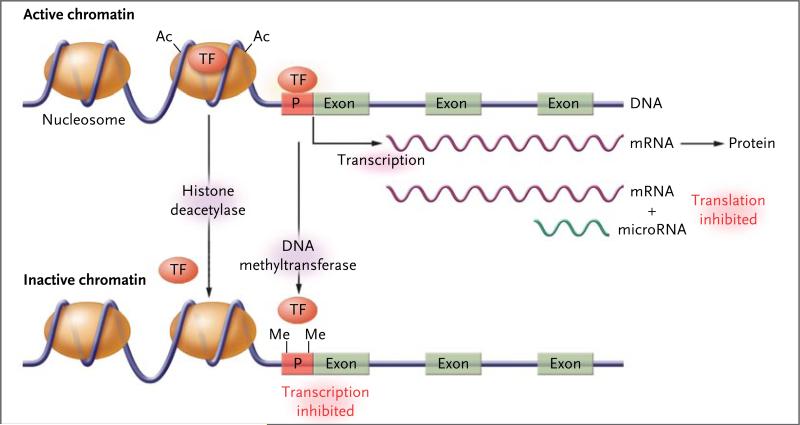
Epigenetic modification of histones or of DNA itself controls access of transcription factors (TFs) to the DNA sequence, thereby modulating the rate of transcription to messenger RNA (mRNA). Transcriptionally active chromatin (top) characterized by the presence of acetyl groups (Ac) on specific lysine residues of core histones in the nucleosome, which decreases their binding to DNA and results in a more open chromatin structure that permits access of transcription factors. In addition, cytidine–guanosine (CpG) sequences in the promoter regions (P) of actively transcribed genes are generally unmethylated, allowing for the binding of transcription factors. Transcriptionally inactive chromatin (bottom) is characterized by histone deacetylation, promoter CpG methylation (as indicated by methyl groups [Me]), and decreased binding of transcription factors. (For simplicity, other histone modifications [such as methylation] and additional regulatory factors [such as methyl-CpG binding proteins] are not shown.) A further level of epigenetic control is provided by microRNA molecules (19 to 22 nucleotides in length), which bind to complementary sequences in the 3′ end of mRNA and reduce the rate of protein synthesis.
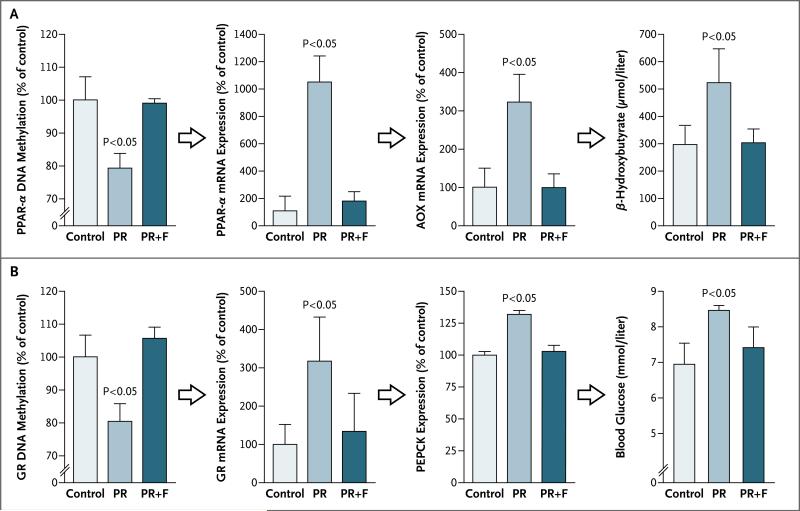
The offspring of rats fed a protein-restricted diet (PR) show reduced promoter methylation and increased messenger RNA (mRNA) expression of the transcription factor peroxisome proliferator-activated receptor α (PPAR-α) in the liver, as compared with control rats fed a normal diet (Panel A). Increased PPAR-α expression is associated with increased expression of the downstream enzyme acyl-CoA oxidase (AOX), a key enzyme in fatty acid β oxidation, and increased circulating concentrations of the ketone β-hydroxybutyrate. These effects were prevented by supplementation of the maternal diet with folate (PR+F). The offspring of rats in the PR group show reduced promoter methylation and increased mRNA expression of the glucocorticoid receptor (GR) in the liver, associated with increased expression of the gluconeogenic enzyme phosphoenolpyruvate carboxykinase (PEPCK) and increased blood glucose levels (Panel B). Again, the effects are not seen in offspring of rats in the PR+F group. P values are shown for the comparison of the PR group with the control group; the P values for the comparison of the PR+F group with the control group indicated no significant difference. Data are means; T bars indicate SEs. Adapted from Lillycrop et al., and Burdge et al.
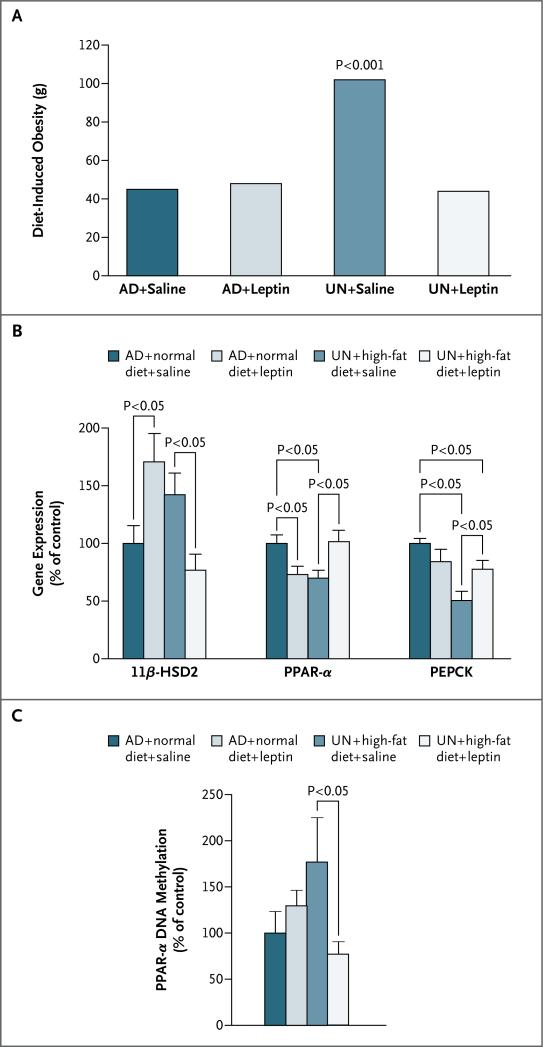
Female rats were subjected in utero to maternal undernutrition (UN) or ad libitum feeding (AD), treated with saline or leptin between days 3 and 13 of life, and fed a normal diet or a high-fat diet after having been weaned. Panel A shows the diet-induced obesity (defined as the difference in total body weight between rats fed a high-fat diet and those fed a normal diet) at 170 days of age. Neonatal leptin treatment prevented the increased susceptibility to diet-induced obesity associated with a high-fat diet after maternal undernutrition. The P value is for the comparison of the UN group with the other three groups. The expression of hepatic genes (for 11β-hydroxysteroid dehydrogenase type 2 [11β-HSD2], peroxisome proliferator-activated receptor α [PPAR-α], and phosphoenolpyruvate carboxykinase [PEPCK]) (Panel B) and promoter methylation of the PPAR-α gene (Panel C) are shown for female rats at 170 days of age. The data in Panels B and C are means, with T bars indicating SEs, for eight rats per group. The control groups in Panels B and C consisted of female offspring in the AD group, treated with saline and fed a normal diet after weaning. Adapted from Vickers et al. and Gluckman et al.
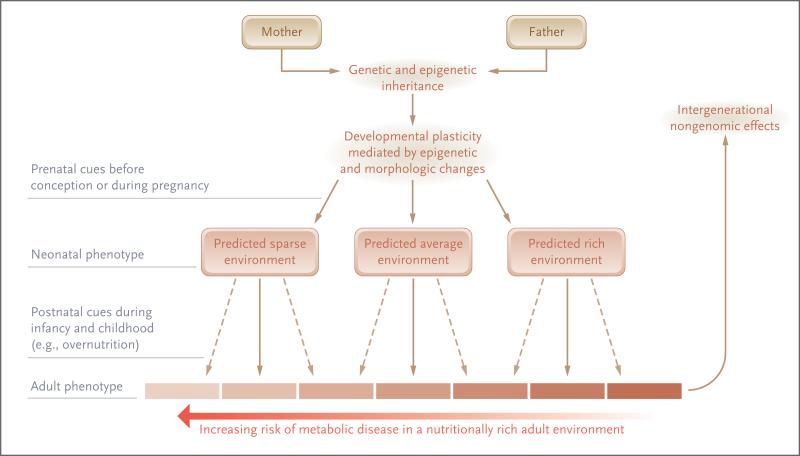
Prenatal cues predicting a nutritionally sparse environment will cause a shift in the trajectory of structural and functional development toward a phenotype matched to that environment. Such a phenotype will have a reduced capacity to cope with a nutritionally rich environment later in life, increasing the risk of metabolic disease. Postnatal cues, such as childhood overnutrition leading to compensatory growth, could further shift the positioning of the adult phenotype, exacerbating the mismatch (dashed lines) between phenotype and environment. Although there is a continuous range of possible developmental trajectories and multiple sequential cues that act during development, for simplicity only two developmental cues (before and after birth) and three trajectories are shown.
Comment in
-
In utero and early-life conditions and adult health and disease.N Engl J Med. 2008 Oct 2;359(14):1523; author reply 1524. doi: 10.1056/NEJMc081629. N Engl J Med. 2008. PMID: 18832254 No abstract available.
-
In utero and early-life conditions and adult health and disease.N Engl J Med. 2008 Oct 2;359(14):1523; author reply 1524. N Engl J Med. 2008. PMID: 18837129 No abstract available.
-
In utero and early-life conditions and adult health and disease.N Engl J Med. 2008 Oct 2;359(14):1523-4; author reply 1524. N Engl J Med. 2008. PMID: 18837146 No abstract available.
References
-
- Bateson P, Barker D, Clutton-Brock T, et al. Developmental plasticity and human health. Nature. 2004;430:419–21. - PubMed
-
- Barker DJ, Osmond C. Infant mortality, childhood nutrition, and ischaemic heart disease in England and Wales. Lancet. 1986;1:1077–81. - PubMed
-
- Kensara OA, Wootton SA, Phillips DI, et al. Fetal programming of body composition: relation between birth weight and body composition measured with dual-energy X-ray absorptiometry and anthropometric methods in older Englishmen. Am J Clin Nutr. 2005;82:980–7. - PubMed
-
- Hales CN, Barker DJ. Type 2 (non-insulin-dependent) diabetes mellitus: the thrifty phenotype hypothesis. Diabetologia. 1992;35:595–601. - PubMed
Publication types
MeSH terms
Grants and funding
LinkOut - more resources
Full Text Sources
Other Literature Sources
Medical