. 2008 Jul;67(7):687-701.
doi: 10.1097/NEN.0b013e318181b8ae.

Proepileptic influence of a focal vascular lesion affecting entorhinal cortex-CA3 connections after status epilepticus

Affiliations

Proepileptic influence of a focal vascular lesion affecting entorhinal cortex-CA3 connections after status epilepticus

Giuseppe Biagini et al. J Neuropathol Exp Neurol. 2008 Jul.

Abstract

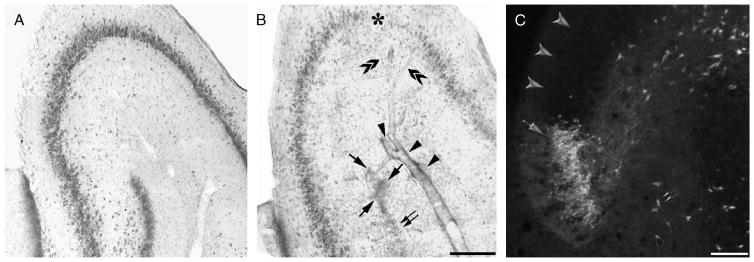
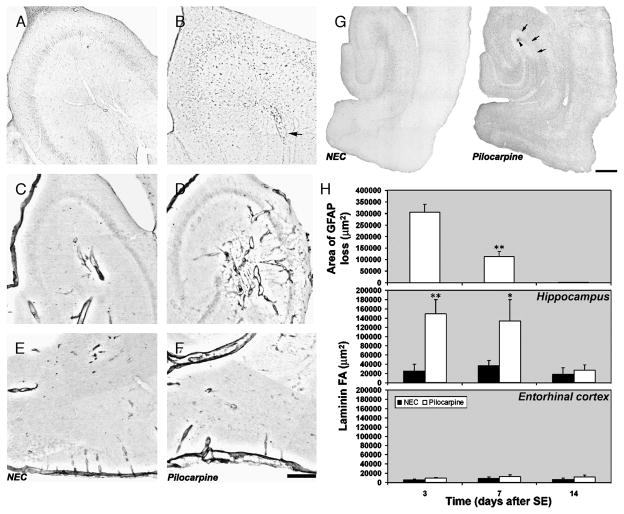
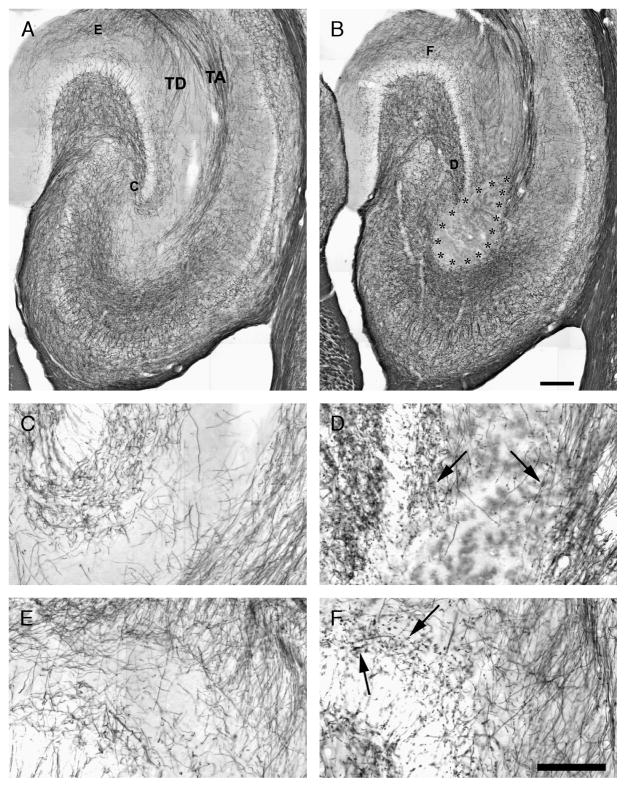
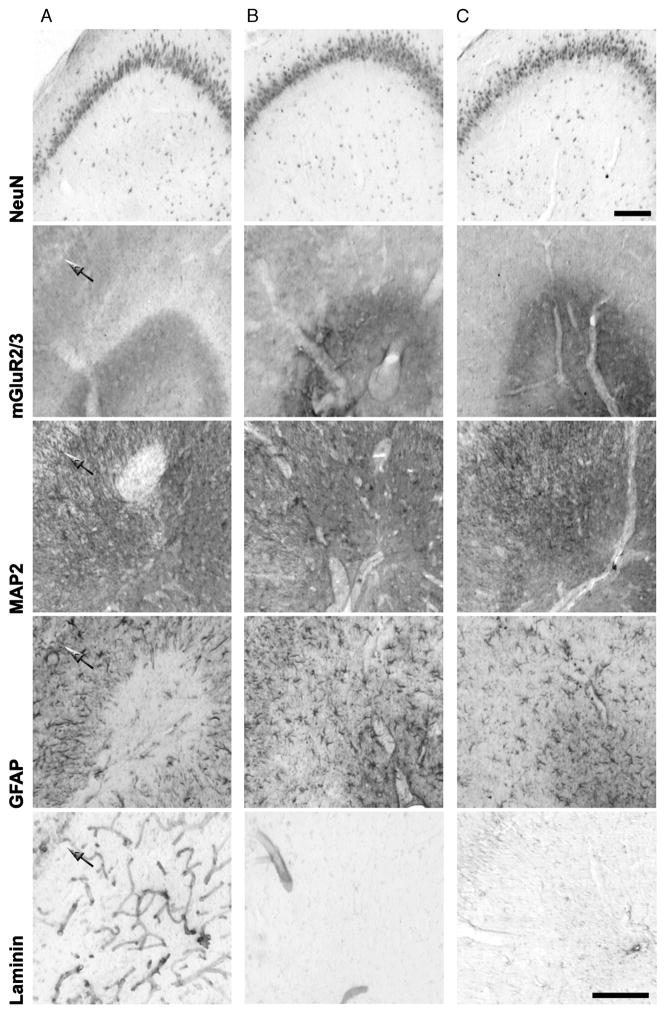
In limbic seizures, neuronal excitation is conveyed from the entorhinal cortex directly to CA1 and subicular regions. This phenomenon is associated with a reduced ability of CA3 to respond to entorhinal cortex inputs. Here, we describe a lesion that destroys the perforant path in CA3 after status epilepticus (SE) induced by pilocarpine injection in 8-week-old rats. Using magnetic resonance imaging, immunohistochemical, and ultrastructural analyses, we determined that this lesion develops after 30 minutes of SE and is characterized by microhemorrhages and ischemia. After a longer period of SE, the lesion invariably involves the upper blade of the dentate gyrus. Adult rats treated with subcutaneous diazepam (20 mg kg for 3 days) did not develop the dentate gyrus lesion and had less frequent spontaneous recurrent seizures (p < 0.01). Young (3-week-old) rats rarely (20%) developed the CA3 lesion, and their spontaneous seizures were delayed (p < 0.01). To investigate the role of the damaged CA3 in seizure activity, we reinduced SE in adult and young epileptic rats. Using FosB/DeltaFosB markers, we found induction of FosB/DeltaFosB immunopositivity in CA3 neurons of young but not in adult rats. These experiments indicate that SE can produce a focal lesion in the perforant path that may affect the roles of the hippocampus in epileptic rats.


Figures

FIGURE 1
FIGURE 1
Photomicrographs illustrating the presence of a focal hemorrhagic lesion centered in the CA3 stratum lacunosum–moleculare 1 week after exposure to 180 minutes of status epilepticus (SE). (A, B) Toluidine blue staining of the CA3 region in a nonepileptic control animal (A) and in a pilocarpine-treated rat (B). (B) Note the presence of perivascular extravasated erythrocytes (arrowheads) and focal hemorrhages (arrows) close to an area of granule cell disappearance in the dentate gyrus (double arrow); an area of marked cell loss in CA3 (asterisk) is reached by dilated branches (double arrowheads) of the vessel surrounded by the microhemorrhages. (C) A cluster of necrotic cells visualized by the Fluoro-Jade method in the upper blade of the dentate gyrus 3 days after SE (C; arrow); only a few positively stained cells are identified outside of the lesion (arrowheads) or in the dentate hilus (double arrowhead). Scale bars = (A, B) 300 μm; (C) 100 μm.
FIGURE 2
FIGURE 2
Changes in immunoreactivity of markers for glial cells and blood vessel wall. (A, B) Distribution of immunoreactivity for heme oxygenase-1 in a control rat (A) and in a pilocarpine-treated rat (B); the arrow points to a dilated blood vessel in which many heme oxygenase-1-positive cells can be identified. Immunoreactivity for laminin in basal condition (C, E) and in a pilocarpine-treated rat (D, F) in CA3 (C, D) and in the entorhinal cortex (E, F). (G) Distribution of glial fibrillary acidic protein (GFAP)-positive astrocytes in a control rat. In the pilocarpine-treated rat, note the clear-cut area devoid of immunoreactivity in the CA3 stratum lacunosum-moleculare (arrows) surrounding a focal microhemorrhage (arrowhead). (H) The top panel shows the quantification of the area of GFAP loss after status epilepticus (SE). *, p < 0.01 versus 3 days after SE group using analysis of variance, followed by the least-significant-difference test for multiple comparisons. Quantification of laminin immunoreactivity is shown in middle and bottom panels. *, p < 0.05; **, p < 0.01 versus controls. Analysis of variance, followed by the least-significant-difference test for multiple comparisons. Scale bars = (AF) 300 μm; (G) 500 μm. NEC, nonepileptic control.
FIGURE 3
FIGURE 3
Staining of nerve fibers with the Black-Gold method in a nonepileptic control animal (A) and in a pilocarpine-treated rat with a large lesion (delimited by asterisks) in the CA3 stratum lacunosum-moleculare (B). (A) The perforant path (PP) projection is clearly detectable and consists either of fibers crossing the hippocampal fissure to reach the dentate gyrus molecular layer (TD) or fibers crossing the hippocampus and terminating in the CA3 stratum lacunosum-moleculare (TA). (CF) Show the regions magnified in the following panels. (C, D) Magnification of PP nerve fibers in CA3, in control, and in pilocarpine-treated rats. (D) Note the fiber loss and the presence of punctuate stained beads and varicosities (arrows). (E, F) Details of PP nerve fibers reaching the dentate gyrus are shown in control (E) and pilocarpine-treated rats (F). Note the presence of intensely stained nerve fiber beads and varicosities (arrows) (F). Scale bars = (A, B) 250 μm; (CF) 100 μm. TA, temporoammonic projection; TD, temporodentate projection.
FIGURE 4
FIGURE 4
Lesions in extrahippocampal regions. (A) The immunostaining with a polyclonal antibody against glial fibrillary acidic protein (GFAP) is shown in a control animal. (B) Glial fibrillary acidic protein immunostaining reveals a focal area devoid of immunoreactivity in the hippocampus of a rat exposed to 180-minute status epilepticus (SE). There is also an irregular zone almost devoid of GFAP-positive cells at the boundary between the piriform and insular cortices (arrowhead). Microhemorrhages are visible in the hypothalamus and thalamus (arrows). Hemorrhagic lesions were not present when SE was limited to 30 minutes (C). In sections close to those used for GFAP immunostaining, laminin immunoreactivity was increased in the basement membrane of blood vessels of rats exposed to 180- (E) or to 30-minute (F) SE compared with a control (D). The increase in laminin immunostaining was clearly focal (H and I are higher magnifications of the hippocampi shown in E and F, respectively). The hippocampus of a control rat is shown (G). Scale bars = 1 mm.
FIGURE 5
FIGURE 5
Electron photomicrographs of vascular lesions in the CA3 of rats exposed to 30 minutes of status epilepticus (SE) and killed 1 to 3 days later. (A) A blood vessel with preserved morphology from a control nonepileptic rat; astrocytic end-foot processes (ASs) are close to endothelial cells (Es) delimiting the vessel wall. (B) A pilocarpine-treated rat studied 1 day after SE. (C) A pilocarpine-treated rat 3 days after SE. The capillary shows reduction in the lumen (L). There are several microvilli on the surface of endothelial cells (arrows) and large vacuoles within their cytoplasm (asterisks). There is also an apparently migrating pericyte (P), marked edema of ASs, and axon degeneration (arrowheads). Scale bar = 1 μm (original magnification, ×4,000).
FIGURE 6
FIGURE 6
Nuclear magnetic resonance imaging illustrating the distribution of brain lesions after status epilepticus (SE) in pilocarpine-treated rats and neuroprotection with diazepam. (A) Horizontal T2-weighted (T2W) images from bregma level 8.6 to 2.6 mm (20) are shown for an nonepileptic control (NEC) rat and a pilocarpine-treated rat exposed to 180-minute SE. Note the appearance of hyperintense signals in several brain regions, including the hippocampal CA3 subfield (5.6; arrow). (B) The hyperintense signals in T2W and the hypointense signals in Tr(D) images are progressively delayed by shortening the SE duration (arrows). (C) Hyperintense signals in T2W and hypointense signals in Tr(D) images are observed in rats exposed to 30-minute SE 72 hours after pilocarpine injection. Neuroprotection of these animals with repeated diazepam administration prevented the changes in signal intensities. (D) Rats exposed to 30-minute SE and neuroprotected developed spontaneous recurrent seizures with a time course similar to that seen in rats exposed to 120-minute SE. (E) The seizure frequency seemed to be significantly lower in rats exposed to 30-minute SE. *, p < 0.05, **, p < 0.01; analysis of variance followed by the least-significant-difference test for multiple comparisons.
FIGURE 7
FIGURE 7
Protective effects of repeated diazepam treatment in pilocarpine-treated rats exposed to 30-minute status epilepticus (SE). The lesion was investigated with antibodies against neuronal (neuron-specific nuclear protein [NeuN]; metabotropic glutamate receptor 2/3 [mGluR2/3]; microtubule-associated protein 2 [MAP2]), glial (glial fibrillary acidic protein [GFAP]) and blood vessel (laminin) antigens in serial sections of pilocarpine-treated and control rats. Frames shown (A; defective neuroprotection) illustrate a rat in which diazepam did not preclude the development of damage in the CA3 stratum lacunosum-moleculare. The arrows indicate the pyramidal cell layer in the respective frames. (B; effective neuroprotection) A pilocarpine-treated rat that experienced 30-minute SE in which the protocol of diazepam administration prevented the appearance of unstained areas and increased laminin immunoreactivity. The control is shown (C). Scale bars = 150 μm.
FIGURE 8
FIGURE 8
Photomicrographs of the CA3 lesion occurring after exposure to 60-minute status epilepticus (SE) in serial sections of adult (8-week-old) and young (3-week-old) rats. (A) The CA3 lesion is identified in adult 8-week-old rats by microtubule-associated protein 2 (MAP2) and metabotropic glutamate receptor 2/3 (mGluR2/3) staining. The correlation of mGluR2/3 immunoreactivity to disappearance of perforant path axons was confirmed using Black-Gold staining (arrowheads). This staining is shown at higher magnification (B). The fibers were detected in the young animals (arrows). (C) Bars indicate the percentages of animals with the CA3 focal lesion. *, p < 0.05, **, p < 0.01 versus 8-week-old 60-minute SE group. (D) Quantification of the volume of glial fibrillary acidic protein (GFAP), MAP2, and mGluR2/3 disappearance. **, p < 0.01 versus 8-week-old 60-minute SE group. Analysis of variance, followed by the least-significant-difference test for multiple comparisons were used (C, D). Scale bars = 200 μm.
FIGURE 9
FIGURE 9
Differences in epileptogenesis, status epilepticus (SE) reinduction, CA3 activation, and perforant path (PP) lesion in rats receiving the initial pilocarpine treatment when either 3 or 8 weeks old. (A) Kaplan-Meier analysis of period when spontaneous Racine Stage 5 seizures appeared (shown on the left; **, p < 0.01; logrank test). In the right panels, the effects of SE reinduction obtained by injecting subthreshold pilocarpine doses in the epileptic rats or in nonepileptic control (NEC) animals. In the top panel, SE reinduction reveals a significantly decreased threshold in the young (3-week-old) group of rats. The bottom panel shows a significantly lower latency. (*, p < 0.05, **, p < 0.01 versus NEC; ##, p < 0.01 versus adult epileptic rats; analysis of variance, followed by the least-significant-difference test for multiple comparisons). (B) FosB/ΔFosB and neuron-specific nuclear protein (NeuN) immunostaining in serial sections of the hippocampal formation in young and adult epileptic rats 1 day after SE reinduction. FosB/ΔFosB immunoreactivity was found in the CA3 of 8 of 10 young rats. Differences in other areas or in NeuN staining are not evident. (C) Metabotropic glutamate receptor 2/3 (mGluR2/3)-immunostained perforant path nerve terminals in a young (left) and an adult (center) rat corresponding to the respective FosB/ΔFosB immunostaining (B). On the right, the percentage of animals with mGluR2/3 loss in stratum lacunosum-moleculare is indicated for each group. Scale bars = 150 μm. DG, dentate gyrus; MEC, medial entorhinal cortex; Sub, subiculum.

Similar articles

Cited by

References

    1. Avoli M, D’Antuono M, Louvel J, et al. Network and pharmacological mechanisms leading to epileptiform synchronization in the limbic system. Prog Neurobiol. 2002;68:167–207. - PubMed
    1. Pitkanen A, Sutula TP. Is epilepsy a progressive disorder? Prospects for new therapeutic approaches in temporal-lobe epilepsy. Lancet Neurol. 2002;1:173–81. - PubMed
    1. Morimoto K, Fahnestock M, Racine RJ. Kindling and status epilepticus models of epilepsy: Rewiring the brain. Prog Neurobiol. 2004;73:1–60. - PubMed
    1. Willoughby JO, Mackenzie L, Medvedev A, et al. Fos induction following systemic kainic acid: Early expression in hippocampus and later widespread expression correlated with seizure. Neuroscience. 1977;77:379–92. - PubMed
    1. Hsieh PF, Watanabe Y. Time course of c-FOS expression in status epilepticus induced by amygdaloid stimulation. Neuroreport. 2000;11:571–74. - PubMed

Publication types

MeSH terms

Grants and funding