Comparative Study
. 2008 Oct;29(5):725-45.
doi: 10.1097/AUD.0b013e31817bdd42.

Classification and cue weighting of multidimensional stimuli with speech-like cues for young normal hearing and elderly hearing-impaired listeners

Affiliations
Comparative Study

Classification and cue weighting of multidimensional stimuli with speech-like cues for young normal hearing and elderly hearing-impaired listeners

Xin Wang et al. Ear Hear. 2008 Oct.

Abstract

Objective: The purpose of this study was to investigate how young normal-hearing (YNH) and elderly hearing-impaired (EHI) listeners make use of redundant speech-like cues when classifying nonspeech sounds having multiple stimulus dimensions.

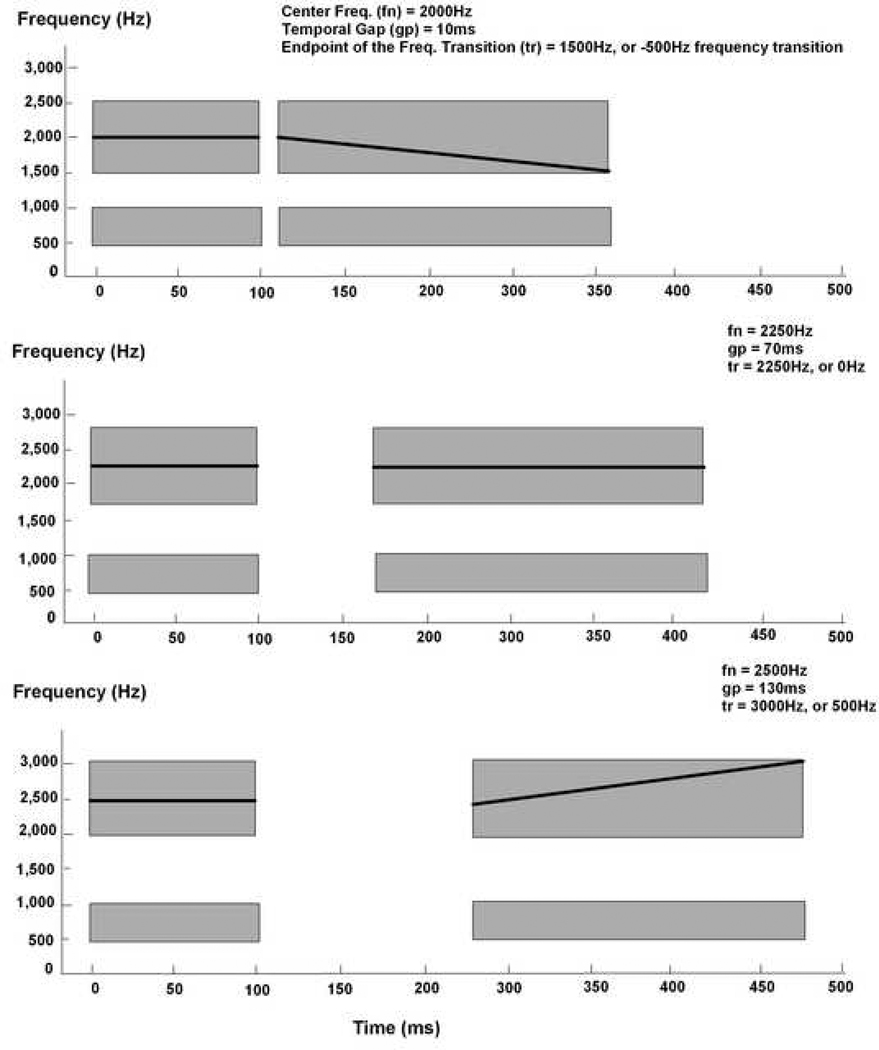
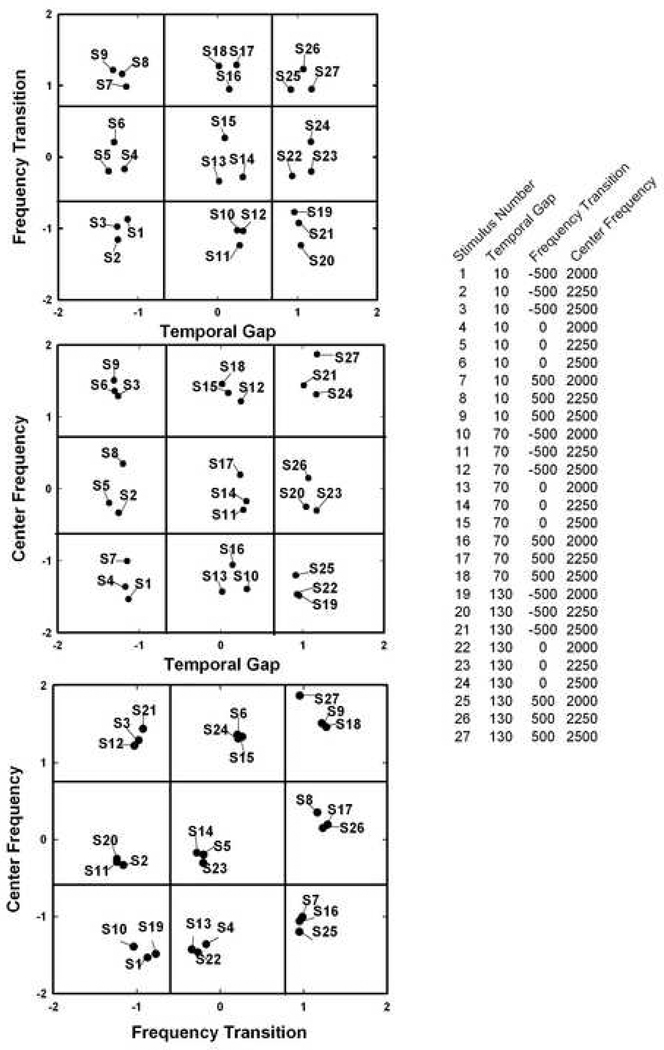
Design: A total of four experiments were conducted with 10 to 12 listeners per group in each experiment. There were 27 stimuli, making use of all possible combinations of three stimulus values along each of three cue dimensions. Stimuli were comprised of two brief sequential noise bursts separated by a temporal gap. Stimulus dimensions were: (1) the center frequency of the noise bursts; (2) the duration of the temporal gap separating the noise bursts; and (3) the direction of a frequency transition in the second noise burst.

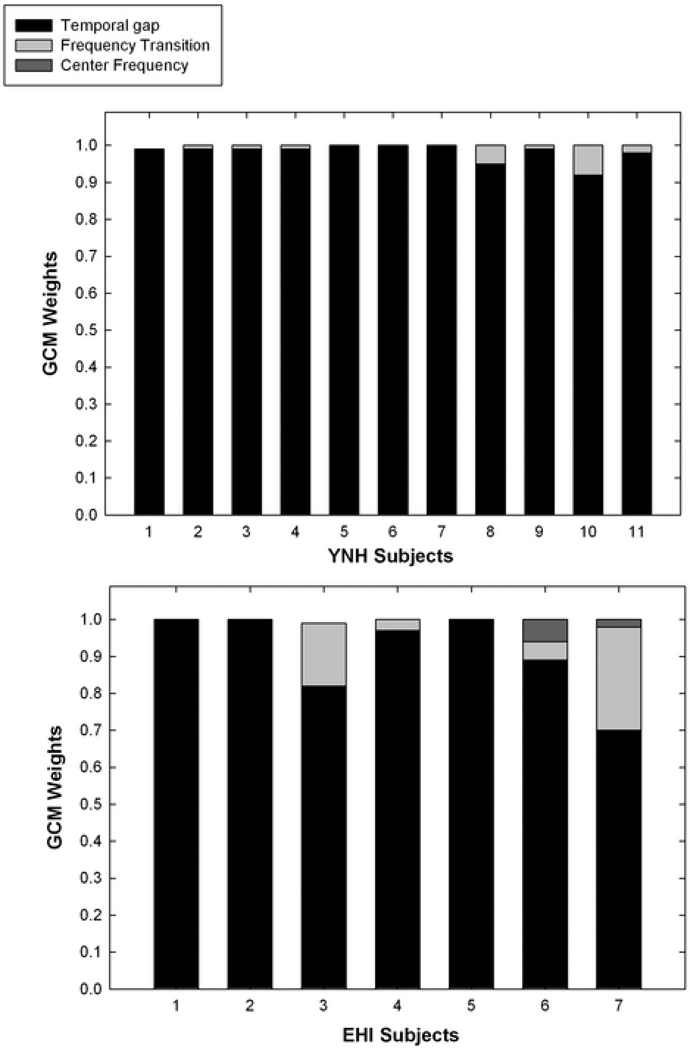
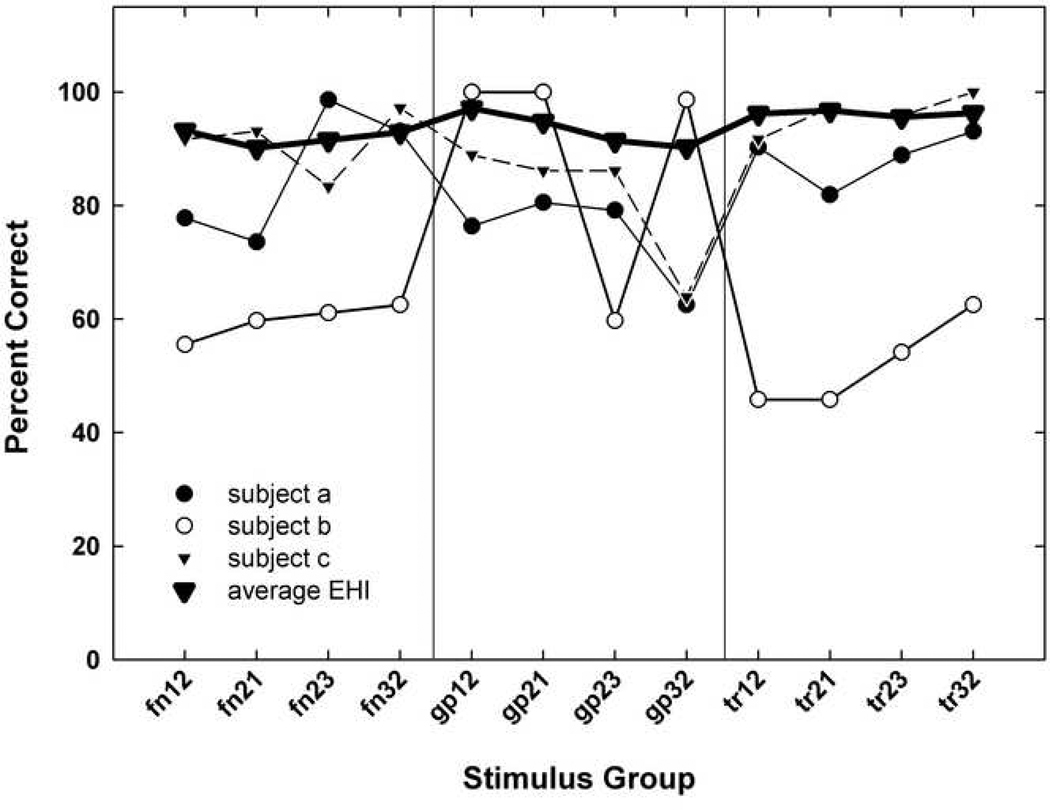
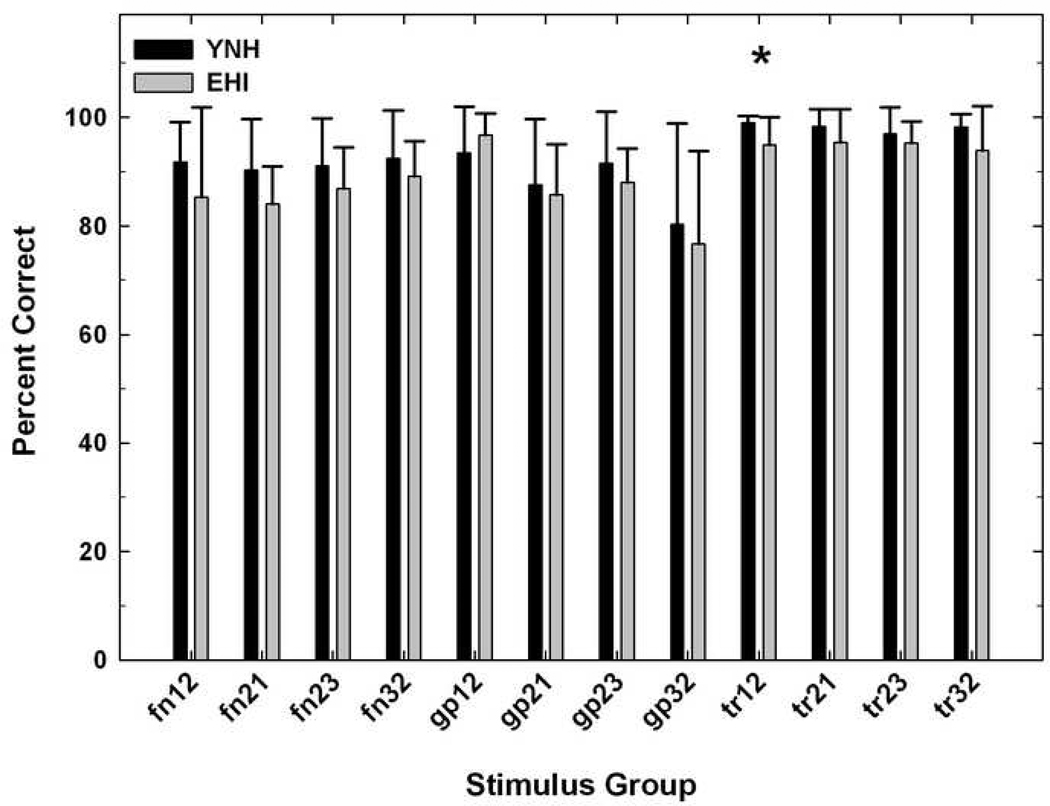
Results: Experiment 1 verified that the stimulus values selected resulted in adjacent steps along each stimulus being easily discriminable [(P(c) > or = 90%]). In experiment 2, similarity judgments were obtained for all possible pairs of the 27 stimuli. Multidimensional scaling confirmed that the three acoustic dimensions existed as separate dimensions perceptually. In experiment 3, listeners were then trained to classify three exemplar stimuli. After the training, they were required to classify all 27 stimuli and these results led to the derivation of attentional weights for each stimulus dimension. Both groups focused their attention on the frequency-transition dimension during the classification task. Finally, experiment 4 demonstrated that the attentional weights derived in experiment 3 were reliable and that both EHI and YNH participants could be trained to shift their attention to a cue dimension (temporal-gap) not preferred in experiment 3, although older adults required much more training to achieve this shift in attention.

Conclusion: For the speech-like, multidimensional acoustic stimuli used here, YNH and EHI listeners attended to the same dimensions of the stimuli when classifying them. In general, the EHI listeners required more time to acquire the ability to categorize the stimuli, and to change their focus to alternate stimulus dimensions.


Figures

FIGURE 1
FIGURE 1
Pure tone air-conduction hearing threshold for 12 elderly hearing-impaired (EHI) subjects (right ear). The bolded line and circles represent the mean hearing threshold.
FIGURE 2
FIGURE 2
Schematics of three exemplar stimuli, which take the small, median and large values in each of the three cue dimensions, from top to bottom panel. The top graph represents the stimulus containing one 100-ms fricative noise burst (represented by the 1st shaded box), which is separated by a 10-ms temporal gap with another 200ms fricative noise burst (represented by the 2nd shaded box). Both bursts center at 2000 Hz (represented by the bold line) and the 2nd burst has an endpoint of the frequency transition of 1500 Hz or a −500 Hz frequency transition (represented by the bold line). The middle graph represents a stimulus with a center frequency at 2250 Hz, a 70-ms temporal gap and an endpoint of the frequency transition of 2250 Hz or a 0 Hz frequency transition. The bottom graph represents a stimulus with a center frequency at 2500 Hz, a 130-ms temporal gap and an endpoint of the frequency transition of 3000 Hz or a 500 Hz frequency transition. The gray boxes at the bottom of each panel represent the band-pass filtered noises with the temporal gap which line up with those of the fricative noise.
FIGURE 3
FIGURE 3
Comparison between shaped stimuli and thresholds for both EHI and YNH groups. The x axis presents the 1/3 OCT frequency from 125 Hz to 8000 Hz. The y axis presents the corresponding amplitude in dB SPL in each 1/3 OCT frequency. The top curve, “CalMin” (filled circles), is the calibration noise matching the trough amplitude across all 27 stimuli. The other three curves from top to bottom are “Maximum EHI threshold” (unfilled circles), the worst threshold across all EHI participants; the “Average EHI threshold” (filled triangles) and the “Average YNH threshold” (unfilled triangles), respectively.
FIGURE 4
FIGURE 4
Results of the discrimination task for all YNH and EHI participants. The average percent-correct scores for each dimension are plotted for both YNH and EHI groups. The black, light gray and darker gray bars represent the fn (center frequency), gp (temporal gap) and tr (frequency transition) cue dimension, respectively. Error bars represent standard deviations of each group across all three cue dimensions. The dashed line represents 90% correct. The asterisks indicate significant differences between the two cue dimensions in terms of the discrimination scores.
FIGURE 5
FIGURE 5
Two-dimensional plots of all 27 stimuli derived by the MDS ALSCAL solution for both YNH and EHI participants. Each plot represents a perceptual space by two dimensions with the relative distance of all 27 stimuli graphed. Each plot is partitioned by the stimulus value on each dimension. All stimuli are labeled as S1 to S27 and their corresponding value in each of three dimensions can be seen from the legend on the right side of the graph.
FIGURE 6
FIGURE 6
Individual MDS weights derived from MDS INDSCAL solution are plotted for all three cue dimension for each YNH (top panel) and EHI (bottom panel) subject.
FIGURE 7
FIGURE 7
GCM weights for each dimension are plotted as stacked bars for each YNH (top panel) and EHI (bottom panel) participant following the classification test. The weights allocated in all the three cue dimensions for each participant sum to 1.
FIGURE 8
FIGURE 8
Result of the classification test for two EHI participants--Subject 2 (top panel), a typical frequency transition user, and Subject 12 (middle and bottom panels), a typical temporal gap user. The x-axes in the top and middle panels represent the three possible values that each stimulus can take on the frequency transition dimension, −500, 0 and 500 Hz, from left to right. The x-axis in the bottom panel represents the three possible values that each stimulus can take on the temporal gap dimension, 10, 70 and 130 ms. The y-axis represents the percentage that each stimulus was classified as Circle, Triangle and Square for 80 presentations. The corresponding GCM weight on three dimensions for each participant is plotted beside each graph.
FIGURE 9
FIGURE 9
GCM weights for each dimension are plotted as stacked bars for each YNH (top panel) and EHI (bottom panel) participant following the temporal-gap training test. The weights allocated in all the three cue dimensions for each participant sum to 1.
FIGURE 10
FIGURE 10
Histogram showing distribution of the number of training blocks needed by each YNH and EHI participants to reach the 80%-correct criterion in the exemplar-classification task. The maximum number of training blocks administered in Experiment 4 was 20. One YNH and three EHI who could not reach the 80% criterion after 20 blocks of training, indicated as “> 20” on the graph.
FIGURE 11
FIGURE 11
Percent-correct scores for the fixed-discrimination task were plotted across all 12 stimulus pairs for the three excluded EHI participants (subject a, b, c) after the first assessment. The big bold triangles linked by the bold line represent the average performance of all 12 enrolled EHI participants after their first assessment in fixed-discrimination task.
FIGURE 12
FIGURE 12
Percent-correct scores across 12 stimulus pairs in the fixed-discrimination task are plotted for both YNH and EHI groups after their initial assessment. Error bars represent the standard deviations of each group across all 12 stimulus pairs. The asterisk indicates significant differences between the YNH and EHI groups for stimulus pair “tr12”.

Similar articles

Cited by

References

    1. American National Standards Institute. Maximum permissible ambient noise levels for audiometric test rooms. (ANSI S3.1-1991) New York: ANSI; 1991.
    1. American National Standards Institute. Specifications for audiometers. (ANSI S3.6-1996) New York: ANSI; 1996.
    1. Ballas JA. Common factors in the identification of an assortment of brief everyday sounds. Journal of Experimental Psychology: Human Perception and Performance. 1993;19:250–267. - PubMed
    1. Christensen LA, Humes LE. Identification of multidimensional stimuli containing speech cues and the effects of training. Journal of the Acoustical Society of America. 1997;102:2297–2310. - PubMed
    1. Corso JF. Age and sex differences in pure tone thresholds: survey of hearing levels from 18 to 65 years. Archives of Otolaryngology. 1963;77:385–405. - PubMed

Publication types