. 2008 Jun 30:14:1187-203.

Distribution of basal membrane complex components in elongating lens fibers

Affiliations

Distribution of basal membrane complex components in elongating lens fibers

Jeffrey Y Lu et al. Mol Vis. .

Abstract

Purpose: To localize specific components of the Basal Membrane Complex (BMC) of elongating lens fibers at defined points in their migration to the posterior sutures.

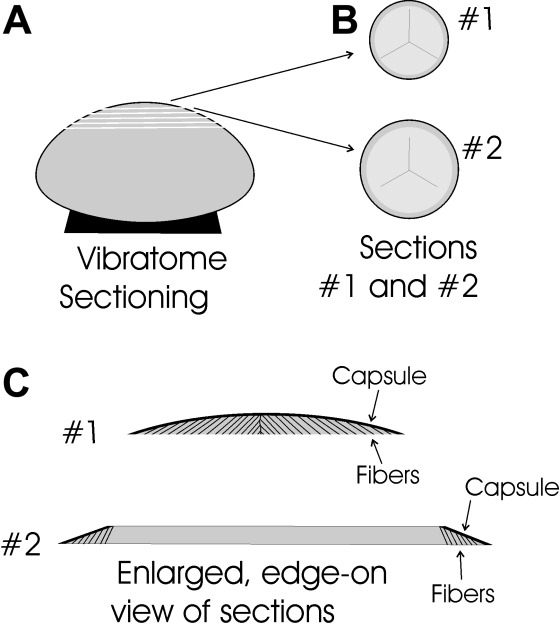
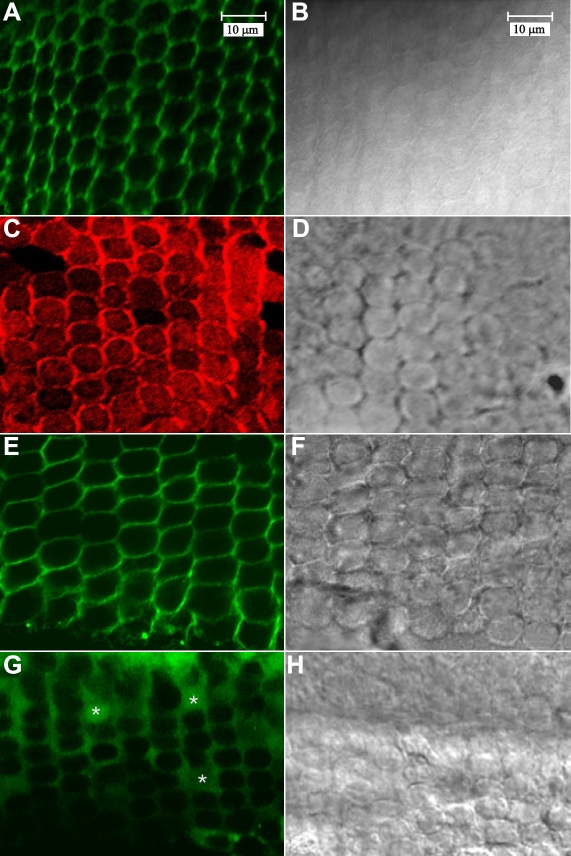
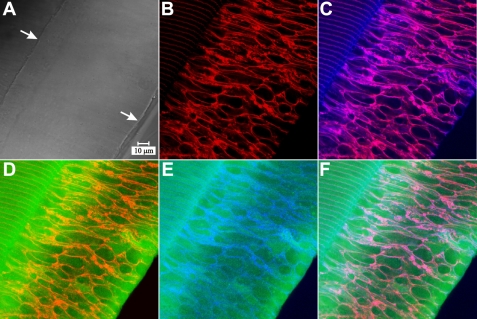
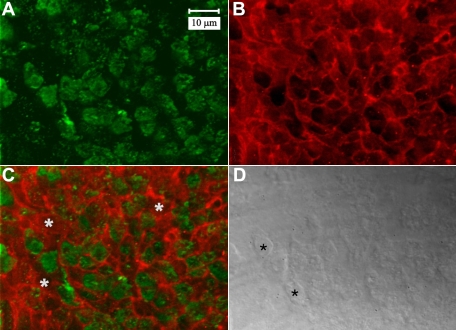
Methods: Normal, juvenile (4-6 week old) Sprague-Dawley rat lenses (n=46) were utilized. Lenses were either decapsulated to obtain whole mounts of lens capsules or sectioned with a vibrating knife microtome. Sections (100 microm thick) were cut parallel to the equatorial plane, beginning at the posterior pole. On both sections and whole mounts, F-actin was localized using phalloidin-FITC while myosin, cadherins, and beta1 integrin were localized using immunofluorescent labeling. Specimens were visualized on a laser scanning confocal microscope.

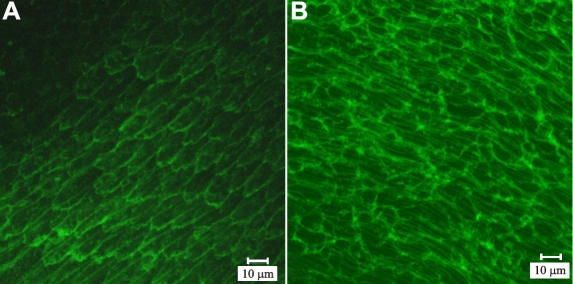
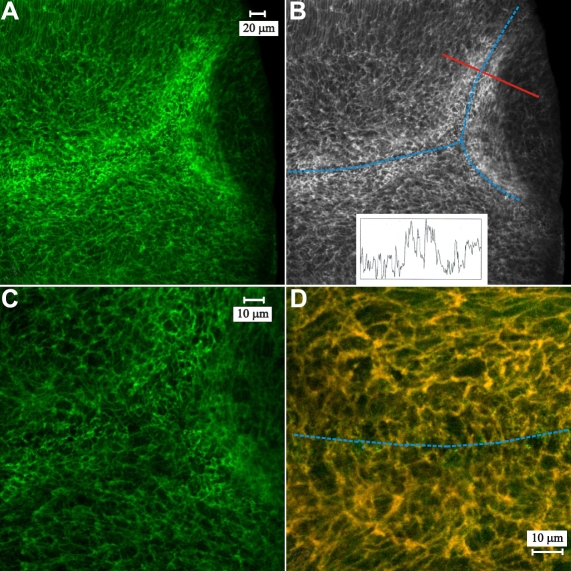
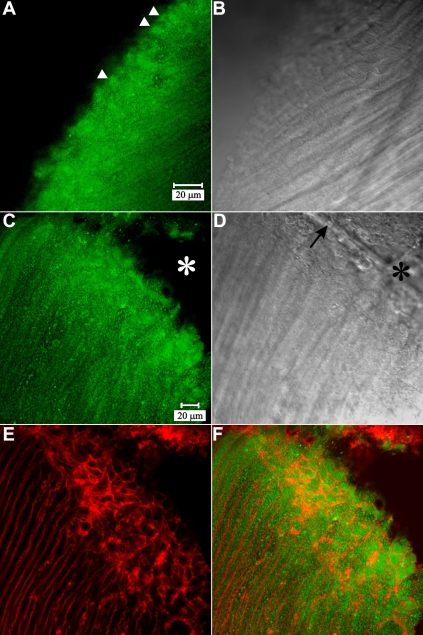
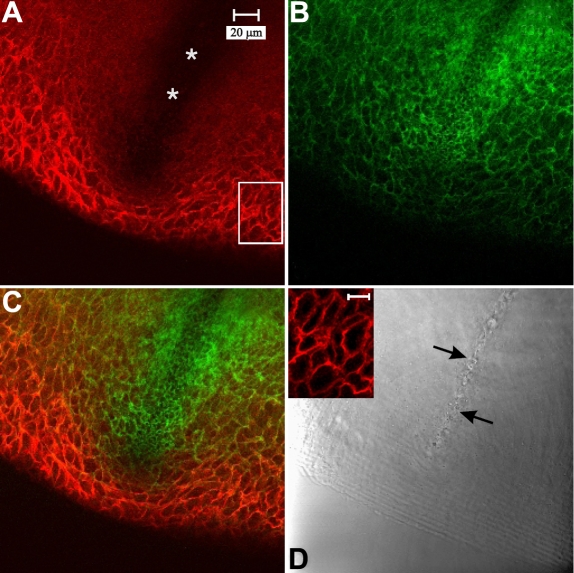
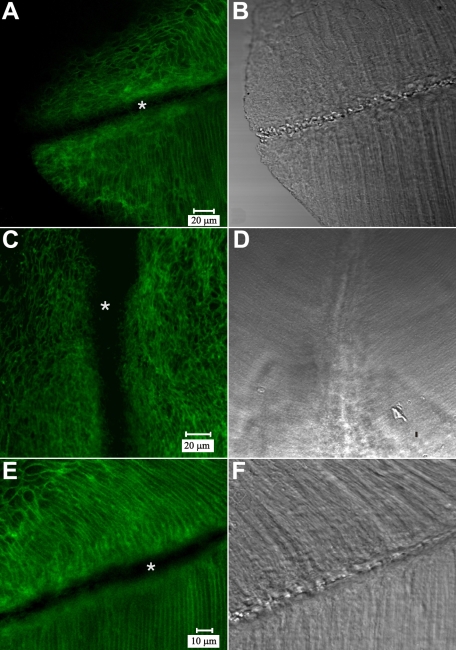
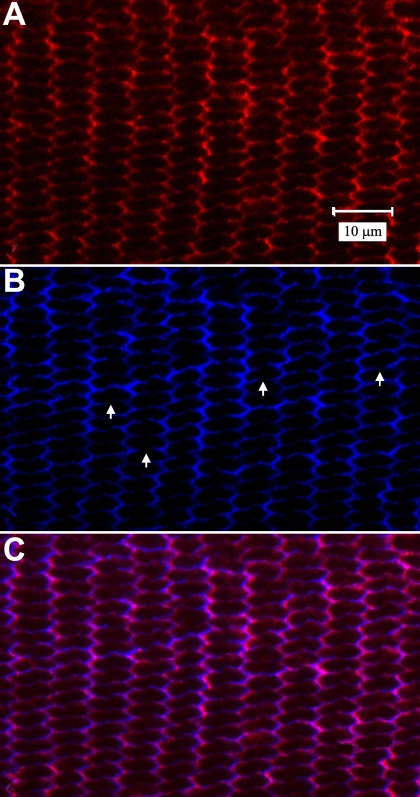
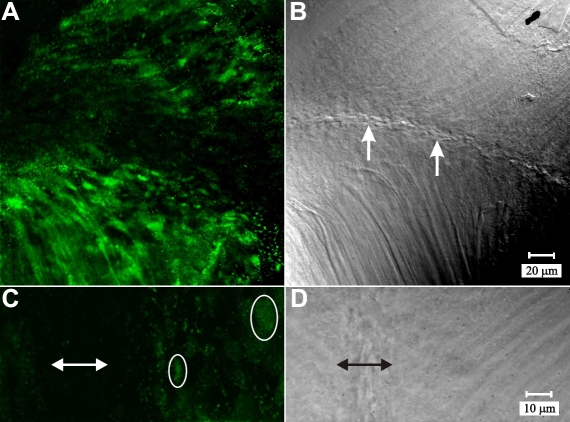
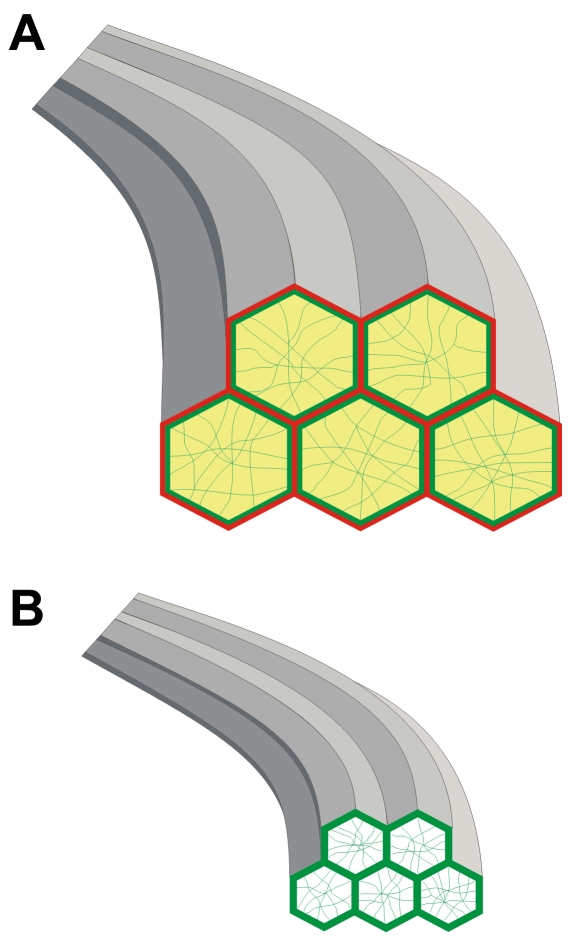
Results: F-actin labeling in the equatorial and peri-sutural regions was predominately localized to the periphery of basal fiber ends (consistent with our prior results). At sutures, labeling for F-actin in the BMC was rearranged into numerous small profiles. Furthermore, labeling intensity for F-actin was increased at sutures. Myosin was present in the BMC in all locations examined as a diffuse plaque at fiber ends. Similarly, beta1 integrin was also distributed throughout the BMC within the actin-rich borders in all regions except adjacent to and at the suture branches. In that location immunofluorescence for beta1 integrin appeared to be reduced. In the equatorial, lateral-posterior, and peri-sutural regions, cadherin showed strong localization around the periphery of basal fiber ends. However, cadherin labeling was markedly reduced in the BMC as fibers detached from the capsule and abutted to form sutures (i.e. in the sutural region). Cadherin was concentrated along the short faces of elongating fiber mid-segments.

Conclusions: It appears that F-actin, cadherin and beta1 integrin components of the BMC undergo controlled rearrangements in the final stages of migration and detachment from the capsule.


Figures

Figure 1
Figure 1
Diagrammatic representation of the vibratome sectioning technique. A: Lenses were mounted on the anterior surface and sectioned beginning at the posterior pole. B: When viewed face-on, all sections contain portions of the suture planes. Typically the first 1-3 sections contain elongating fiber ends in the peri-sutural and sutural regions. C: An enlarged, edge-on view of the first two sections demonstrates that migrating fiber ends are present beneath the entire curved surface of the capsule in section #1. However, in section #2 (and all subsequent sections) elongating fiber ends are present only beneath the beveled edges of sections covered by capsule.
Figure 2
Figure 2
LSCM visualization of BMC components in whole-mount lens capsules at the equatorial region. A-B: Paired fluorescent (A) and DIC (B) images of F-actin labeled with phalloidin-FITC. F-actin is concentrated at cell borders. C-D: Paired fluorescent (C) and DIC (D) images of (non-muscle) myosin IIA labeling. Myosin is distributed throughout the BMC and enriched at the cell periphery. E-F: Paired fluorescent (E) and DIC (F) images of pan-cadherin labeling. As expected, cadherin was localized to lateral membranes. G-H: Paired fluorescent (G) and DIC (H) images of β1 integrin labeling. Distribution of β1 integrin label was diffuse, forming a plaque at the basal portion of the cells (asterisks). Micrographs A-H are at equivalent magnifications.
Figure 3
Figure 3
Animations of LSCM z-series from phalloidin-labeled basal fiber ends in the lateral-posterior region of fiber end migration. Animation 1 (left): Sheared-off fiber ends adhered to the lens capsule after prefixation and decapsulation were imaged from the capsule (z=0 µm), through the CFI (z≈1 µm) and to a depth of z=5 µm. Faint F-actin fluorescence was visible at the CFI, which was gradually visualized as distinct profiles with diffuse staining in the rest of the BMC (z=2 µm through z=4 µm). By z=5 µm, lateral membrane staining of fibers was noted, indicating that in some areas, portions of elongating fibers were stripped away from the lens during decapsulation. Z-distance between frames is equal to 1 µm. Animation 2 (right): Intact fiber ends in thick (100 µm) vibratome sections taken from the posterior lens surface. In sections taken beginning at the posterior pole, faint, scattered actin fluorescence was detected at the CFI, consistent with the presence of filopodia at this interface. Fiber end profiles were discernable by z=1µm. Lateral borders of fibers deep to the ends were detected by z=4 µm and were distinct by z=5 µm. Z-distance between frames is equal to 1.0 µm. A and B A and B show z-projections of each animation.
Figure 4
Figure 4
LSCM images of F-actin and fodrin distribution at, and approaching the posterior sutures. A: Low magnification overview of the peri-sutural and sutural regions of fiber end migration. F-actin labeling in the BMC was enhanced as migrating fiber ends approached a suture branch (left side) and forming sub-branches (right side). B: A greyscale version of the micrograph in A (identical magnification) is overlain to show the location of the posterior suture branches (blue dotted lines), the location where an optical density line scan (red solid line) was made and the resulting plot (inset). Higher labeling intensity was present within the sutural domain as demonstrated by peaks in the line scan. C: Higher magnification of the convergence of suture sub-branches shown in A. All BMC profiles showed strong peripheral labeling with faint fluorescence present within the brighter profiles. Fiber ends in sutural regions were rearranged into numerous smaller profiles. D: A merged image of double-labeling for F-actin (red) and fodrin (green) at a suture branch (blue dotted line) illustrates the extensive colocalization (yellow) of these two cytoskeletal components. The data indicates that actin is probably anchored to the membrane skeleton in the BMC at this location, which includes the sutural region and a portion of the adjacent peri-sutural region of fiber end migration.
Figure 5
Figure 5
LSCM micrographs of myosin IIA and actin immuno-fluorescence at posterior fiber ends. A-B: Paired fluorescent (A) and DIC (B) images of myosin IIA labeling in the peri-sutural region. Myosin was localized as a diffuse plaque in the BMC (arrowheads) and was also present filling the cytoplasm of posterior fiber segments. A and B are at identical magnification. C-F: The same field of view showing myosin IIA fluorescence (C), the DIC image (D), actin fluorescence (E) and the merged myosin-actin fluorescence (F) at a suture branch. Basal fiber ends at the suture (D, arrow), were delineated by actin (E and F, red profiles) and were filled with myosin (C and F, green plaques). Asterisks (C and D) indicate an area devoid of both labels, which was due to an artifactual break in the vibratome section. C through F are at identical magnification. The data revealed that myosin IIA distribution in the BMC was consistent in the sutural, peri-sutural, and lateral-posterior regions of fiber end migration.
Figure 6
Figure 6
LSCM images of double-labeling for N-cadherin and F-actin at a posterior suture branch. Both N-cadherin (A, inset in D) and F-actin (B) were present at the margins of the BMC in the peri-sutural region. The merged image (C) of N-cadherin (red) and F-actin (green) fluorescence showed that they were largely co-localized at cell borders (yellow to orange coloration). However, in the sutural region, immunofluorescence for N-cadherin was conspicuously decreased (asterisk in A and sutural region in C). The location of the suture branch is indicated in the DIC image (D, arrows). A through D are at identical magnification. Inset is a higher magnification of boxed area in panel A (bar=10 µm) showing N-cadherin labeling in the BMC and demonstrates that N-cadherin was distributed fairly evenly around the BMC periphery.
Figure 7
Figure 7
LSCM visualization of pan-cadherin immuno-fluorescence at a posterior suture branch. Paired fluorescent (A) and DIC (B) images of an oblique optical section. A: Because the lens surface is curved, this optical section demonstrates fluorescence due to cadherin family proteins in both the BMC (upper portion) and in the lateral fiber membranes (lower right). Notably, fluorescence is absent from the sutural region (asterisk) A and B are at identical magnification. C-D: Paired fluorescent (C) and DIC (D) LSCM images of a posterior suture branch in a detergent-extracted section. Unmasking of antigenic sites via this technique failed to reveal cadherin labeling at, and adjacent to the posterior sutures (asterisk). C and D are at identical magnification. E-F: Paired fluorescent (E) and DIC (F) images of fully-elongated fibers that have detached from the capsule and abutted to form a suture branch. Although the posterior tips of these maturing fibers lack cadherin (asterisk), strong cadherin fluorescence was apparent on the lateral fiber membranes flanking the region where fiber ends abut and interdigitate. E and F are at identical magnification.
Figure 8
Figure 8
LSCM visualization of double-labeling for actin and pan-cadherin in the equatorial segments of elongating fibers. A: Flattened hexagonal fiber cross-sections showed actin (red) concentrated along the short faces with faint label along broad faces. B: Cadherin (blue) was more prominent along the short sides of fiber profiles whereas the broad sides demonstrated reduced and often discontinuous labeling (arrows). C: As expected, merged actin and cadherin fluorescence (purple) displayed a high degree of colocalization. Fibers shown are between 95 and 115 cells deep to the equatorial capsule, corresponding to fiber ends in the distal portion of the lateral-posterior region of fiber end migration. A through C are at the same magnification.
Figure 9
Figure 9
LSCM images of triple-labeling for actin, pan-cadherin and myosin IIA in the peri-sutural region. A: DIC image demonstrating the location of the beveled edge of the Vibratome section; the lower right arrow indicates the edge of the section and the upper left arrow indicates the extent of the bevel. B: Actin immuno-fluorescence (red) delineates the fiber end profiles, which are typically heterogeneous in size and shape in this region. C: Merged actin and pan-cadherin (blue) fluorescence demonstrates nearly complete colocalization in the BMC (purple). D: Merged actin and myosin IIA fluorescence (green) shows the diffuse distribution of myosin. The areas where these components are colocalized appear orange, indicating that actin predominates at the BMC periphery. E: Merged myosin IIA and pan-cadherin shows a comparable pattern to that in D, i.e. although both proteins are colocalized at the borders of profiles, the deep turquoise color indicates that pan-cadherin fluorescence is more pronounced. F: Merged actin, pan-cadherin, and myosin IIA fluorescence demonstrates the expected distribution. The colocaliztion of all three components appears white to pink. A through F show the same field of view and are at identical magnification.
Figure 10
Figure 10
LSCM images of double-labeling for β1 integrin and F-actin in the peri-sutural region. Whereas β1 integrin (A) was distributed throughout the BMC as a plaque, F-actin (B) was most prominent at the margins of fiber ends. A merged fluorescent image (C) of β1 integrin (green) and F-actin (red) showed that they were not markedly co-localized. White asterisks denote profiles without integrin label. D shows the paired DIC image of the same field of view. Fiber ends are discernable (black asterisks). A through D are at the same magnification.
Figure 11
Figure 11
LSCM images of β1 integrin immuno-fluorescence at posterior suture branches. A-B: Paired fluorescent (A) and DIC (B) images of a posterior suture branch (arrows). The marked reduction in β1 integrin immuno-fluorescence was apparent in fiber ends at, and approaching the sutural region of fiber end migration. A and B are at identical maginificaiton. C-D: Higher magnification of paired fluorescent (C) and DIC (D) micrographs at a posterior suture branch. C: Approaching the suture, β-1 integrin was dispersed throughout the BMC (circled fiber end profiles). D: Within the nascent sutures (double-headed arrow), the paucity of label for β-1 integrin was apparent. C and D are at identical magnification.
Figure 12
Figure 12
Diagram of the distribution of BMC components. A: In the peri-sutural region, both cadherin (red) and F-actin (green) were localized predominantly at the periphery of BMC profiles (hexagons). Some F-actin was present within the remainder of the BMC (green filaments) and β1 integrin (yellow) was localized throughout the BMC. B: In the sutural region of fiber end migration, peripheral staining for F-actin was somewhat enhanced, whereas neither β1 integrin nor cadherin was apparent. Myosin is not depicted because its distribution does not change as basal fiber ends detach from the capsule and interface with opposing fiber ends at posterior sutures.

Similar articles

Cited by

References

    1. Bassnett S, Missey H, Vucemilo I. Molecular architecture of the lens fiber cell basal membrane complex. J Cell Sci. 1999;112:2155–65. - PubMed
    1. Menko AS, Philip NJ. Beta 1 integrins in epithelial tissues: a unique distribution in the lens. Exp Cell Res. 1995;218:516–21. - PubMed
    1. Menko S, Philp N, Veneziale B, Walker J. Integrins and development: how might these receptors regulate differentiation of the lens. Ann N Y Acad Sci. 1998;842:36–41. - PubMed
    1. Ferreira-Cornwell MC, Veneziale RW, Grunwald GB, Menko AS. N-cadherin function is required for differentiation-dependent cytoskeletal reorganization in lens cells in vitro. Exp Cell Res. 2000;256:237–47. - PubMed
    1. Zelenka PS. Regulation of cell adhesion and migration in lens development. Int J Dev Biol. 2004;48:857–65. - PubMed

Publication types

LinkOut - more resources