

A role for polyploidy in the tumorigenicity of Pim-1-expressing human prostate and mammary epithelial cells
- PMID: 18596907
- PMCID: PMC2440349
- DOI: 10.1371/journal.pone.0002572
A role for polyploidy in the tumorigenicity of Pim-1-expressing human prostate and mammary epithelial cells
Abstract
Background: Polyploidy is a prominent feature of many human cancers, and it has long been hypothesized that polyploidy may contribute to tumorigenesis by promoting genomic instability. In this study, we investigated whether polyploidy per se induced by a relevant oncogene can promote genomic instability and tumorigenicity in human epithelial cells.
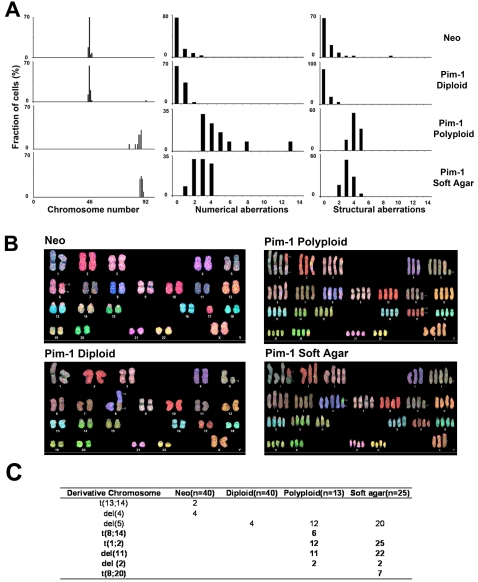
Principal findings: When the oncogenic serine-threonine kinase Pim-1 is overexpressed in immortalized, non-tumorigenic human prostate and mammary epithelial cells, these cells gradually converted to polyploidy and became tumorigenic. To assess the contribution of polyploidy to tumorigenicity, we obtained sorted, matched populations of diploid and polyploid cells expressing equivalent levels of the Pim-1 protein. Spectral karyotyping revealed evidence of emerging numerical and structural chromosomal abnormalities in polyploid cells, supporting the proposition that polyploidy promotes chromosomal instability. Polyploid cells displayed an intact p53/p21 pathway, indicating that the viability of polyploid cells in this system is not dependent on the inactivation of the p53 signaling pathway. Remarkably, only the sorted polyploid cells were tumorigenic in vitro and in vivo.
Conclusions: Our results support the notion that polyploidy can promote chromosomal instability and the initiation of tumorigenesis in human epithelial cells.
Conflict of interest statement
Figures


Similar articles
-
Overexpression of the oncogenic kinase Pim-1 leads to genomic instability.Cancer Res. 2003 Dec 1;63(23):8079-84. Cancer Res. 2003. PMID: 14678956
-
Chromosomal instability induced by Pim-1 is passage-dependent and associated with dysregulation of cyclin B1.J Biol Chem. 2005 Dec 9;280(49):40568-77. doi: 10.1074/jbc.M509369200. Epub 2005 Oct 12. J Biol Chem. 2005. PMID: 16221667
-
Tumorigenic polyploid cells contain elevated ROS and ARE selectively targeted by antioxidant treatment.J Cell Physiol. 2012 Feb;227(2):801-12. doi: 10.1002/jcp.22793. J Cell Physiol. 2012. PMID: 21503880 Free PMC article.
-
Understanding the functional discrepancy of Pim-1 in cancer.Front Biosci (Elite Ed). 2015 Jan 1;7(2):208-14. doi: 10.2741/E728. Front Biosci (Elite Ed). 2015. PMID: 25553374 Review.
-
PIM1 kinase as a target in prostate cancer: roles in tumorigenesis, castration resistance, and docetaxel resistance.Curr Cancer Drug Targets. 2014;14(2):105-14. doi: 10.2174/1568009613666131126113854. Curr Cancer Drug Targets. 2014. PMID: 24274399 Review.
Cited by
-
Oncogene-mediated alterations in chromatin conformation.Proc Natl Acad Sci U S A. 2012 Jun 5;109(23):9083-8. doi: 10.1073/pnas.1112570109. Epub 2012 May 21. Proc Natl Acad Sci U S A. 2012. PMID: 22615383 Free PMC article.
-
Human prostate side population cells demonstrate stem cell properties in recombination with urogenital sinus mesenchyme.PLoS One. 2013;8(1):e55062. doi: 10.1371/journal.pone.0055062. Epub 2013 Jan 31. PLoS One. 2013. PMID: 23383057 Free PMC article.
-
Clinical and therapeutic relevance of PIM1 kinase in gastric cancer.Gastric Cancer. 2012 Apr;15(2):188-97. doi: 10.1007/s10120-011-0097-2. Epub 2011 Oct 13. Gastric Cancer. 2012. PMID: 21993851
-
Specific and reliable detection of Myosin 1C isoform A by RTqPCR in prostate cancer cells.PeerJ. 2018 Nov 20;6:e5970. doi: 10.7717/peerj.5970. eCollection 2018. PeerJ. 2018. PMID: 30498638 Free PMC article.
-
Chromosome compartmentalization alterations in prostate cancer cell lines model disease progression.J Cell Biol. 2022 Feb 7;221(2):e202104108. doi: 10.1083/jcb.202104108. Epub 2021 Dec 10. J Cell Biol. 2022. PMID: 34889941 Free PMC article.
References
-
- Cahill DP, Kinzler KW, Vogelstein B, Lengauer C. Genetic instability and darwinian selection in tumours. Trends Cell Biol. 1999;9:M57–60. - PubMed
-
- Duesberg P. Does aneuploidy or mutation start cancer? Science. 2005;307:41. - PubMed
-
- Ganem NJ, Storchova Z, Pellman D. Tetraploidy, aneuploidy and cancer. Curr Opin Genet Dev. 2007;17:57–162. - PubMed
-
- Ganem NJ, Pellman D. Limiting the proliferation of polyploid cells. Cell. 2007;131:437–440. - PubMed
-
- Ried T, Heselmeyer-Haddad K, Blegen H, Schrock E, Auer G. Genomic changes defining the genesis, progression, and malignancy potential in solid human tumors: a phenotype/genotype correlation. Genes Chromosomes Cancer. 1999;25:195–204. - PubMed
Publication types
MeSH terms
Substances
Grants and funding
LinkOut - more resources
Full Text Sources
Other Literature Sources
Medical
Research Materials
Miscellaneous
