. 2008 Jul 9;130(27):8856-64.
doi: 10.1021/ja802383t.

Asymmetric insertion of membrane proteins in lipid bilayers by solid-state NMR paramagnetic relaxation enhancement: a cell-penetrating Peptide example

Affiliations

Asymmetric insertion of membrane proteins in lipid bilayers by solid-state NMR paramagnetic relaxation enhancement: a cell-penetrating Peptide example

Yongchao Su et al. J Am Chem Soc. .

Abstract

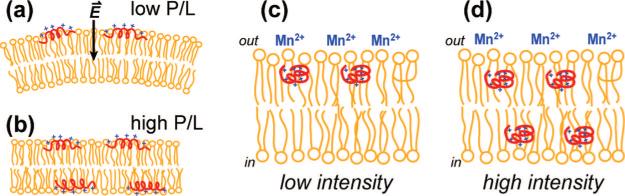
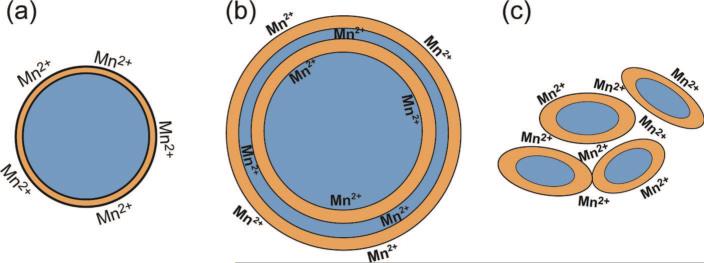
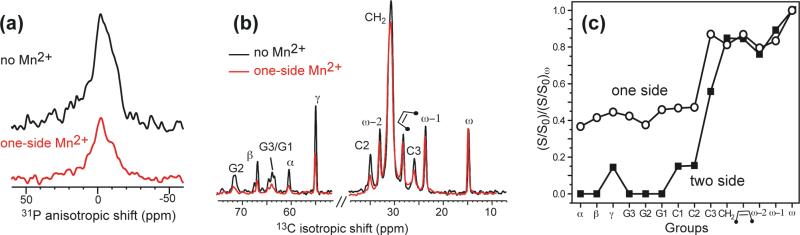
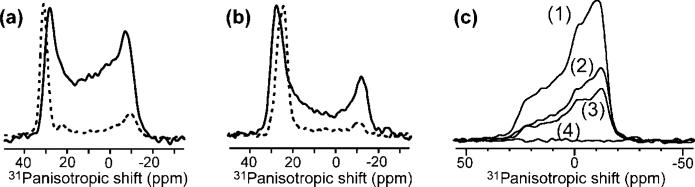
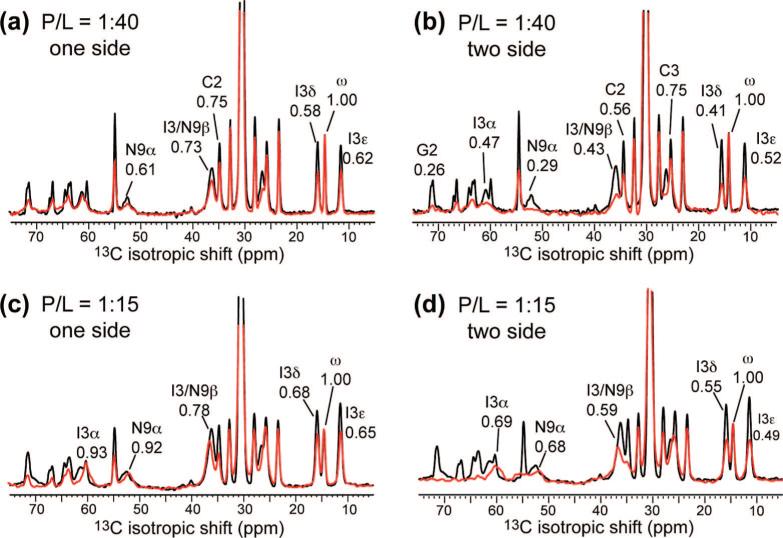
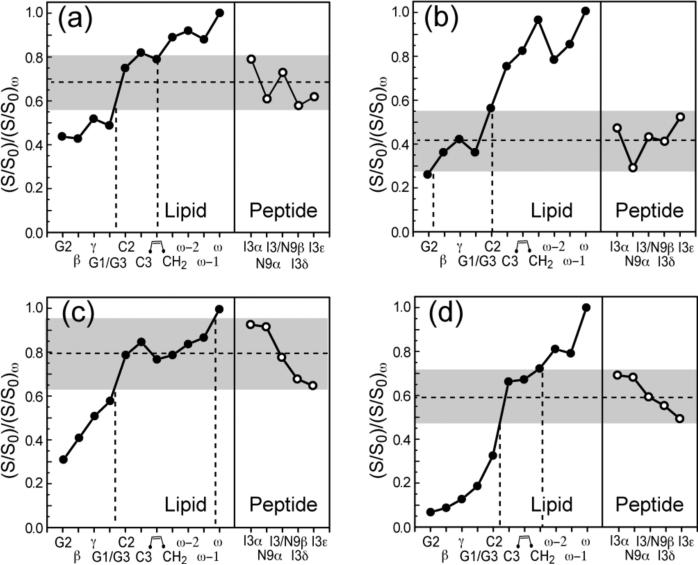
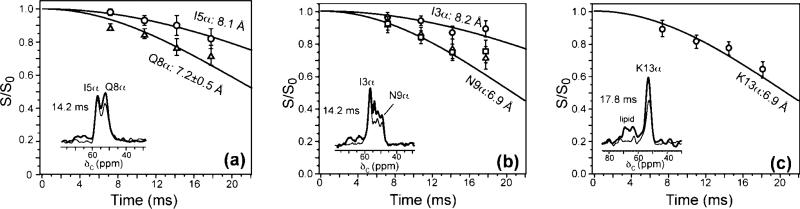
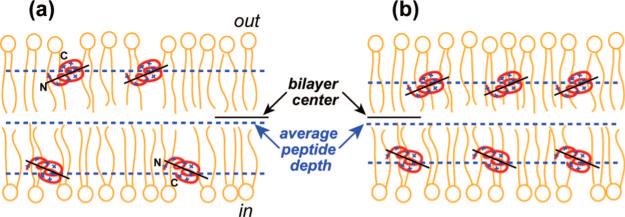
A novel solid-state NMR technique for identifying the asymmetric insertion depths of membrane proteins in lipid bilayers is introduced. By applying Mn (2+) ions on the outer but not the inner leaflet of lipid bilayers, the sidedness of protein residues in the lipid bilayer can be determined through paramagnetic relaxation enhancement (PRE) effects. Protein-free lipid membranes with one-side Mn (2+)-bound surfaces exhibit significant residual (31)P and lipid headgroup (13)C intensities, in contrast to two-side Mn (2+)-bound membranes, where lipid headgroup signals are mostly suppressed. Applying this method to a cell-penetrating peptide, penetratin, we found that at low peptide concentrations, penetratin is distributed in both leaflets of the bilayer, in contrast to the prediction of the electroporation model, which predicts that penetratin binds to only the outer lipid leaflet at low peptide concentrations to cause an electric field that drives subsequent peptide translocation. The invalidation of the electroporation model suggests an alternative mechanism for intracellular import of penetratin, which may involve guanidinium-phosphate complexation between the peptide and the lipids.


Figures

Figure 1
Figure 1
One-side paramagnetic relaxation enhancement NMR for determining the asymmetric binding of membrane proteins. (a, b) Electroporation model of cell-penetrating peptides. (a) At low P/L, the peptides are bound to the outer leaflet of the membrane, causing an electric field and membrane curvature strain. (b) At high P/L, the peptides distribute to both leaflets of the membrane, releasing the curvature strain. When Mn2+ ions are distributed on the outer surface of the membrane: (c) Membrane proteins inserted only to the outer leaflet experience strong PRE and give low intensities. (d) Membrane proteins bound to both leaflets of the bilayer have high intensities due to the negligible PRE experienced by the inner-leaflet molecules.
Figure 2
Figure 2
One-side and two-side Mn2+-bound membrane samples. Orange: lipids. Blue: water. (a) One-side Mn2+-bound large unilamellar vesicles before ultracentrifugation. Mn2+ ions are distributed only on the outer surface of the bilayer. (b) Two-side Mn2+-bound membranes after freeze-thawing. Oligolamellar vesicles form where Mn2+ ions are distributed on both sides of each bilayer. (c) Mn2+ ions added to the membrane pellet after ultracentrifugation. The Mn2+ ions diffuse between unilamellar vesicles and remain on the outer surface of the bilayers.
Figure 3
Figure 3
31P static and 13C MAS spectra of POPC/POPG (3:1) vesicles without any peptide. (a) 31P static spectra without Mn2+ (top) and with Mn2+ on one-side (bottom). (b) 13C MAS spectra without Mn2+ (black) and with (red) one-side Mn2+. (c) Double-normalized intensity of Mn2+-bound POPC/POPG membranes. (○) One-side Mn2+-bound membrane. (■) Two-side Mn2+-bound membrane.
Figure 4
Figure 4
Static 31P spectra of lipid membranes showing the effects of penetratin on membrane disorder and of Mn2+ on 31P intensity. (a) Oriented 31P spectra of POPC/POPG (8:7) bilayers without (dashed line) and with 4 mol % penetratin (solid line). (b) Oriented 31P spectra of POPC/cholesterol (55:45) bilayers without (dashed line) and with 4 mol % penetratin (solid line). The lipid membranes are oriented on thin glass plates. Note the absence of any isotropic peak. (c) 31P powder spectra of penetratin-containing POPC/POPG (8:7) membrane before and after the addition of Mn2+. Compared to the full control spectrum without Mn2+ (1), 15 min after addition of Mn2+ a roughly 2-fold intensity reduction is seen (2). Three days after Mn2+ addition the 31P intensity is largely retained (3), indicating that rf pulses do not cause Mn2+ scrambling. After freeze–thawing the membrane the 31P intensity is completely suppressed by the strong PRE effect (4).
Figure 5
Figure 5
13C DP-MAS spectra of I3,N9-labeled penetratin in POPC/POPG (8:7) membranes under different peptide concentrations and Mn2+ binding methods. (Red) Mn2+-bound spectra. (Black) Mn2+-free control spectra. (a) P/L ) 1:40, with one-side Mn2+. (b) P/L ) 1:40, with two-side Mn2+. (c) P/L ) 1:15, with one-side Mn2+. (d) P/L ) 1:15, with two-side Mn2+. Assignments are shown for key peptide and lipid peaks.
Figure 6
Figure 6
Normalized intensities of penetratin in POPC/POPG (8:7) bilayers at 295 K. (a) P/L ) 1:40, with one-side Mn2+. (b) P/L ) 1:40, with two-side Mn2+. (c) P/L ) 1:15, with one-side Mn2+. (d) P/L ) 1:15, with two-side Mn2+.
Figure 7
Figure 7
13C–31P REDOR curves of penetratin in DMPC/DMPG bilayers at 233 K and P/L ) 1:15. (a) I5α and Q8α. (b) I3α and N9α. (c) K13α.
Figure 8
Figure 8
Symmetry and depth of insertion of penetratin in the anionic POPC/POPG membranes. (a) P/L) = 1:40. (b) P/L) = 1:15. In (b) the peptides are more deeply inserted in each leaflet than in (a). However, the common aspects are that the peptide is inserted into both leaflets of the bilayer, the average depth is closer to the inner surface than the outer surface, and the peptide is slightly tilted with respect to the bilayer plane.
Figure 9
Figure 9
Two-dimensional 13C–13C correlation spectra of POPC/POPG membranes containing I3,N9-labeled penetratin. (a) Without Mn2+. P/L) = 1:15. (b) With 8% Mn2+ on both sides of the membrane. P/L) = 1:20. (c, d) Row cross sections at positions indicated by dashed lines in the 2D spectra. (c) Cross sections from (a) give the S0 intensity. (d) Cross sections from (b) give the S intensity. The double normalized intensities (S/S0)/(S/S0)ω-1 of several cross peaks are indicated. The spectra were collected at 303 K under 5.0 kHz MAS using a 30 ms DARR mixing time.

References

    1. von Heijne G. Nat. Rev. Mol. Cell Biol. 2006;7:909–918. - PubMed
    1. Kumashiro KK, Schmidt-Rohr K, Murphy OJ, Ouellette KL, Cramer WA, Thompson LK. J. Am. Chem. Soc. 1998;120:5043–5051.
    1. Huster D, Yao XL, Hong M. J. Am. Chem. Soc. 2002;124:874–883. - PubMed
    1. Luo W, Hong M. Solid State NMR. 2006;29:163–169. - PubMed
    1. Etzkorn M, Martell S, Andronesi OC, Seidel K, Engelhard M, Baldus M. Angew. Chem., Int. Ed. 2007;46:459–462. - PubMed

Publication types

MeSH terms