. 2008 Jul 2:9:316.
doi: 10.1186/1471-2164-9-316.

High accuracy mass spectrometry analysis as a tool to verify and improve gene annotation using Mycobacterium tuberculosis as an example

Affiliations

High accuracy mass spectrometry analysis as a tool to verify and improve gene annotation using Mycobacterium tuberculosis as an example

Gustavo A de Souza et al. BMC Genomics. .

Abstract

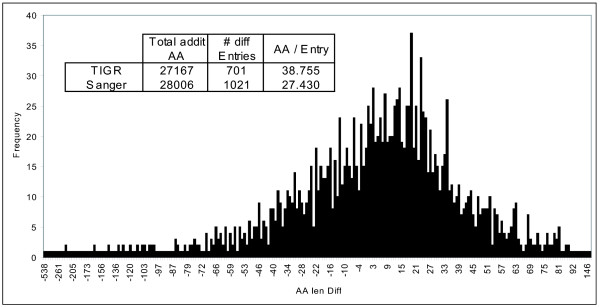
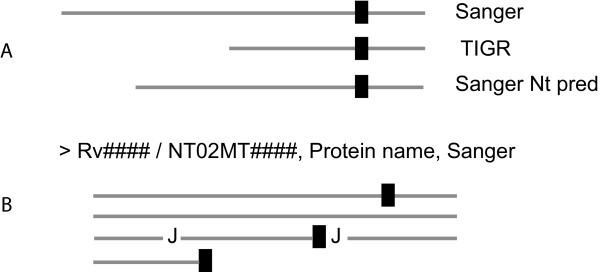
Background: While the genomic annotations of diverse lineages of the Mycobacterium tuberculosis complex are available, divergences between gene prediction methods are still a challenge for unbiased protein dataset generation. M. tuberculosis gene annotation is an example, where the most used datasets from two independent institutions (Sanger Institute and Institute of Genomic Research-TIGR) differ up to 12% in the number of annotated open reading frames, and 46% of the genes contained in both annotations have different start codons. Such differences emphasize the importance of the identification of the sequence of protein products to validate each gene annotation including its sequence coding area.

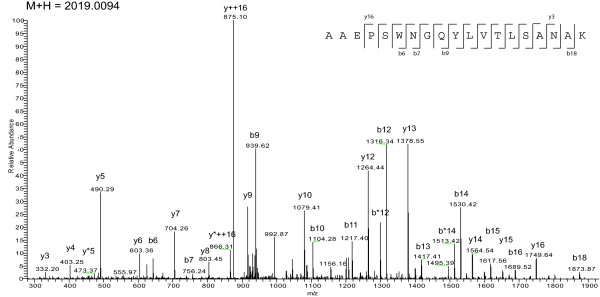
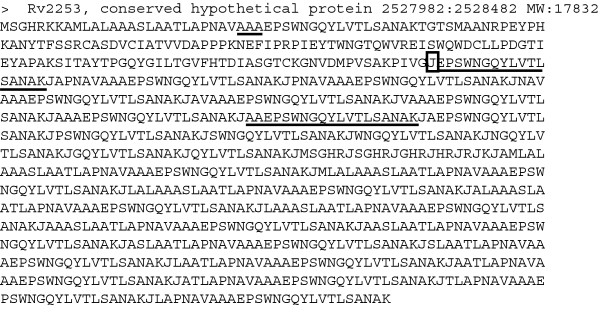
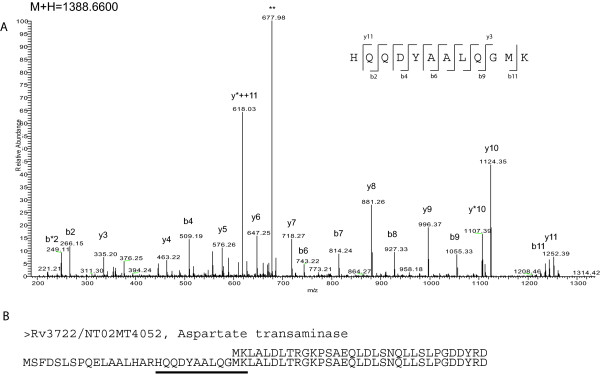
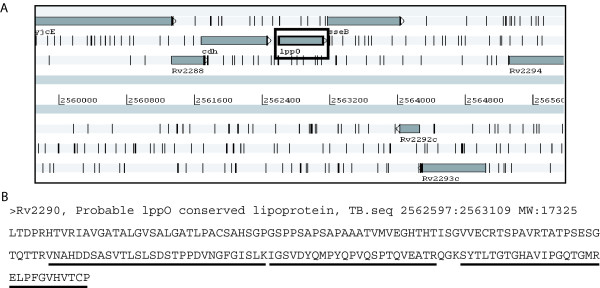
Results: With this objective, we submitted a culture filtrate sample from M. tuberculosis to a high-accuracy LTQ-Orbitrap mass spectrometer analysis and applied refined N-terminal prediction to perform comparison of two gene annotations. From a total of 449 proteins identified from the MS data, we validated 35 tryptic peptides that were specific to one of the two datasets, representing 24 different proteins. From those, 5 proteins were only annotated in the Sanger database. In the remaining proteins, the observed differences were due to differences in annotation of transcriptional start sites.

Conclusion: Our results indicate that, even in a less complex sample likely to represent only 10% of the bacterial proteome, we were still able to detect major differences between different gene annotation approaches. This gives hope that high-throughput proteomics techniques can be used to improve and validate gene annotations, and in particular for verification of high-throughput, automatic gene annotations.


Figures

Figure 1
Figure 1
MS/MS profile of ion M+H 2019.0094. Tandem mass spectrum of a prevalent ion on a particular time point in the LC gradient and ionized on the LTQ-Orbitrap. The peptide fragments randomly on each amide bond, resulting in carboxy-terminal y ions or amino-terminal b ions. After the fragment masses were submitted to Mascot, the peptide was identified as AAEPSWNGQYLVTLSANAK (inset, with detected y and b ions represented) from protein Rv2253 – conserved hypothetical protein.
Figure 2
Figure 2
Length comparison between genes annotated in both Sanger and TIGR datasets. When the TIGR and Sanger datasets where compared, 46% of the genes present on both sets differed by chosen TSS. The graph shows frequency distribution (number of genes) and number of amino acid difference on the N-terminal side (AA len diff). While the distribution by number of cases is higher in the Sanger dataset (1021 genes with longer products compared to the same gene in TIGR, inset Table), genes that are longer on TIGR tend to be exceedingly longer when compared to Sanger.
Figure 3
Figure 3
Example of MS-friendly database entry for N-terminal prediction validation. This entry represents the protein Rv2253 (Conserved hypothetical protein) which is 167 amino acids long. Analysis with the tool SignalP v3.0 resulted in the prediction of the sequence A27-A28-A29 (underlined) as a possible cleavage site of signal peptidase I. Therefore, the predicted N-terminal peptide is inserted after a J (box). In addition, we also appended all peptides possible from position -25 until +7 from the predicted signal peptidase cleavage site. In this case, we not only identified the predicted N-terminal peptide starting in E30 (underlined after box) but also a second peptide starting on amino acid A28 (last underline – see Figure 1 for MS/MS data) representing a possible N-terminal alternative option.
Figure 4
Figure 4
A specific tryptic peptide observed in the TIGR annotation. In total, we identified 35 peptides which were specific to Sanger or TIGR datasets. This figure illustrates the only example observed only in the TIGR database. In (A), MS/MS information of the ion M+H = 1388.6600. While this MS/MS spectrum could not be identified by Mascot when using the Sanger database, it was identified as sequence HQQDYAALQGMK (inset with fragmentation pattern) only when the TIGR database was used. When the N-terminal region of this entry was aligned with the corresponding gene annotated by Sanger Rv3722 (B), it is clear that the Sanger entry (Top) failed to annotate the correct TSS for this gene. The identified sequence is underlined in the TIGR entry (bottom).
Figure 5
Figure 5
Identification of specific protein products. From the 35 specific tryptic peptides reported, we were able to identify 5 proteins that were only annotated in the Sanger database. The protein Rv2290 is an example of this. The visualization of this gene in the genome using Artemis tool and Sanger annotation (box) is illustrated in (A), while the same genomic region does not contain any annotated gene in TIGR (not shown). The sequence of this protein is shown in (B), which was identified with four tryptic peptides. The sequence of these peptides is represented with underlining.
Figure 6
Figure 6
MS-friendly database generation as a solution to discrepancy of datasets. As it was reported by Schandorff et al. [22], we propose the creation of a unified database where differences in the N-terminal side of annotated genes can be easily accommodated to improve proteomic identification. In this example, the N-terminal of a gene annotated in Sanger, TIGR and a predicted cleavage site of the Sanger are considered (A). The alignment in (A) only shows the N-terminal region to facilitate comparison, with the first common tryptic site as a black box. When the entry is generated, the sequence of the longer version is kept (in this case, Sanger). Only the tryptic peptides comprising the TIGR N-terminal and the Sanger predicted N-terminal are inserted after a J. Such an approach not only allows the identification of all sequence variations within a single and simplified entry, but also eliminates redundancy from regions where the annotated sequences are identical.

Similar articles

Cited by

References

    1. World Health Organization. WHO Report 2007: Global tuberculosis control, surveillance, planning, financing. 2007.
    1. Cole ST, Brosch R, Parkhill J, Garnier T, Churcher C, Harris D, Gordon SV, Eiglmeier K, Gas S, Barry CE, 3rd, Tekaia F, Badcock K, Basham D, Brown D, Chillingworth T, Connor R, Davies R, Devlin K, Feltwell T, Gentles S, Hamlin N, Holroyd S, Hornsby T, Jagels K, Krogh A, McLean J, Moule S, Murphy L, Oliver K, Osborne J, Quail MA, Rajandream MA, Rogers J, Rutter S, Seeger K, Skelton J, Squares R, Squares S, Sulston JE, Taylor K, Whitehead S, Barrell BG. Deciphering the biology of Mycobacterium tuberculosis from the complete genome sequence. Nature. 1998;393:537–544. doi: 10.1038/31159. - DOI - PubMed
    1. Eiglmeier K, Simon S, Garnier T, Cole ST. The integrated genome map of Mycobacterium leprae. Leprosy review. 2001;72:462–469. - PubMed
    1. Fleischmann RD, Alland D, Eisen JA, Carpenter L, White O, Peterson J, DeBoy R, Dodson R, Gwinn M, Haft D, Hickey E, Kolonay JF, Nelson WC, Umayam LA, Ermolaeva M, Salzberg SL, Delcher A, Utterback T, Weidman J, Khouri H, Gill J, Mikula A, Bishai W, Jacobs Jr WR, Jr., Venter JC, Fraser CM. Whole-genome comparison of Mycobacterium tuberculosis clinical and laboratory strains. Journal of bacteriology. 2002;184:5479–5490. doi: 10.1128/JB.184.19.5479-5490.2002. - DOI - PMC - PubMed
    1. Garnier T, Eiglmeier K, Camus JC, Medina N, Mansoor H, Pryor M, Duthoy S, Grondin S, Lacroix C, Monsempe C, Simon S, Harris B, Atkin R, Doggett J, Mayes R, Keating L, Wheeler PR, Parkhill J, Barrell BG, Cole ST, Gordon SV, Hewinson RG. The complete genome sequence of Mycobacterium bovis. Proceedings of the National Academy of Sciences of the United States of America. 2003;100:7877–7882. doi: 10.1073/pnas.1130426100. - DOI - PMC - PubMed

Publication types

LinkOut - more resources