. 2008 Jul 2:8:189.
doi: 10.1186/1471-2407-8-189.

TDAG51 is an ERK signaling target that opposes ERK-mediated HME16C mammary epithelial cell transformation

Affiliations

TDAG51 is an ERK signaling target that opposes ERK-mediated HME16C mammary epithelial cell transformation

Michael D Oberst et al. BMC Cancer. .

Abstract

Introduction: Signaling downstream of Ras is mediated by three major pathways, Raf/ERK, phosphatidylinositol 3 kinase (PI3K), and Ral guanine nucleotide exchange factor (RalGEF). Ras signal transduction pathways play an important role in breast cancer progression, as evidenced by the frequent over-expression of the Ras-activating epidermal growth factor receptors EGFR and ErbB2. Here we investigated which signal transduction pathways downstream of Ras contribute to EGFR-dependent transformation of telomerase-immortalized mammary epithelial cells HME16C. Furthermore, we examined whether a highly transcriptionally regulated ERK pathway target, PHLDA1 (TDAG51), suggested to be a tumor suppressor in breast cancer and melanoma, might modulate the transformation process.

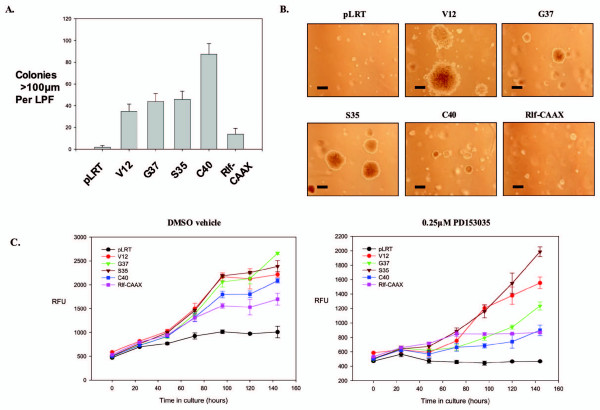
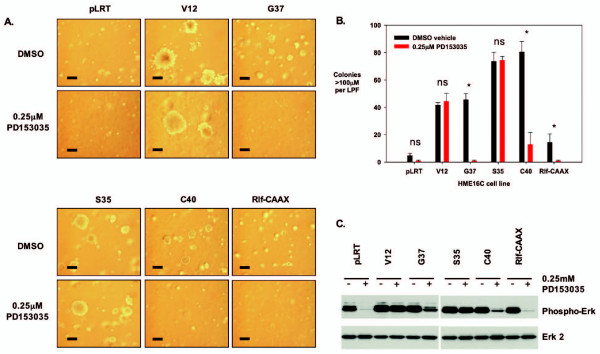
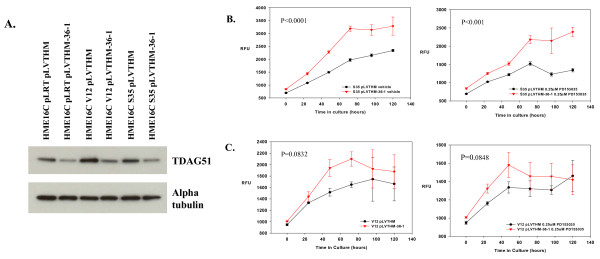
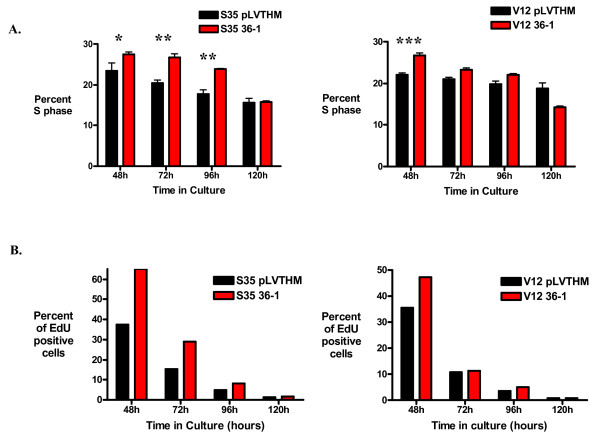
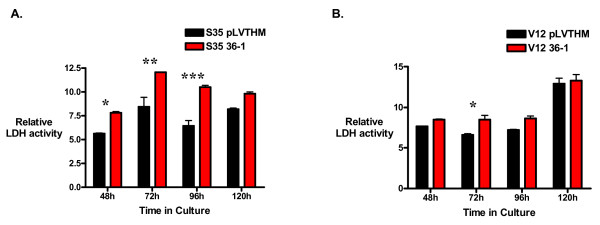
Methods: Cellular transformation of human mammary epithelial cells by downstream Ras signal transduction pathways was examined using anchorage-independent growth assays in the presence and absence of EGFR inhibition. TDAG51 protein expression was down-regulated by interfering small hairpin RNA (shRNA), and the effects on cell proliferation and death were examined in Ras pathway-transformed breast epithelial cells.

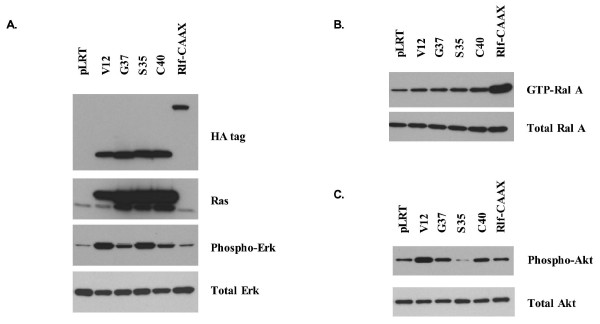
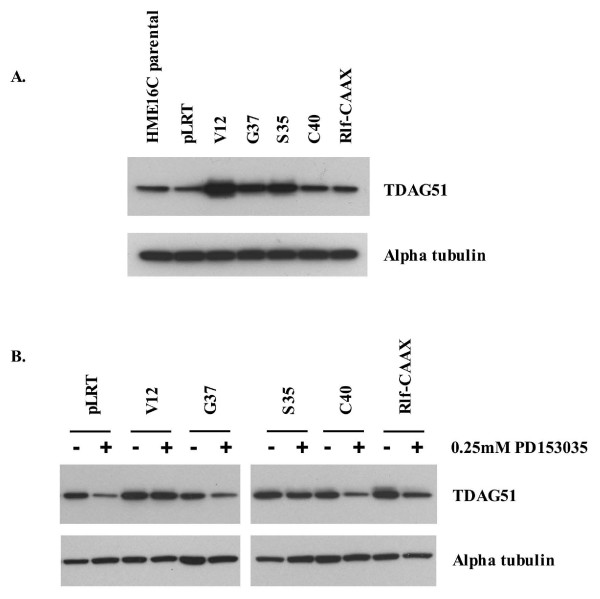
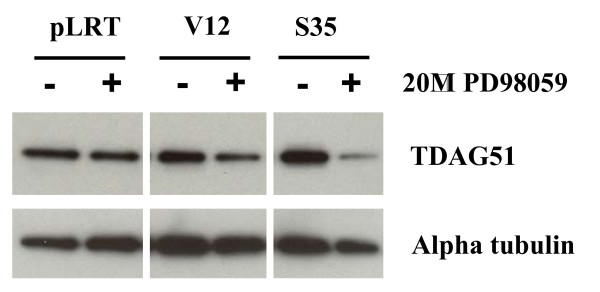
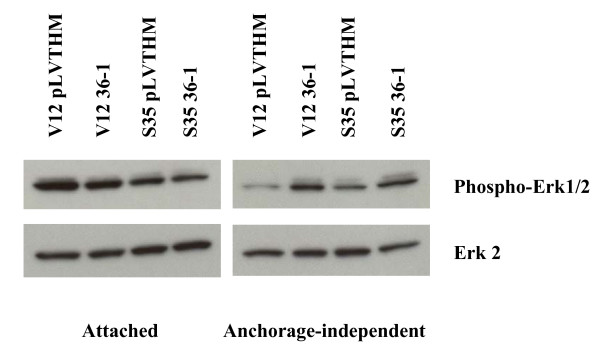
Results: Activation of both the ERK and PI3K signaling pathways was sufficient to induce cellular transformation, which was accompanied by up-regulation of EGFR ligands, suggesting autocrine EGFR stimulation during the transformation process. Only activation of the ERK pathway was sufficient to transform cells in the presence of EGFR inhibition and was sufficient for tumorigenesis in xenografts. Up-regulation of the PHLDA1 gene product, TDAG51, was found to correlate with persistent ERK activation and anchorage-independent growth in the absence or presence of EGFR inhibition. Knockdown of this putative breast cancer tumor-suppressor gene resulted in increased ERK pathway activation and enhanced matrix-detached cellular proliferation of Ras/Raf transformed cells.

Conclusion: Our results suggest that multiple Ras signal transduction pathways contribute to mammary epithelial cell transformation, but that the ERK signaling pathway may be a crucial component downstream of EGFR activation during tumorigenesis. Furthermore, persistent activation of ERK signaling up-regulates TDAG51. This event serves as a negative regulator of both Erk activation as well as matrix-detached cellular proliferation and suggests that TDAG51 opposes ERK-mediated transformation in breast epithelial cells.


Figures

Figure 1
Figure 1
Protein expression and pathway activation in HME16C cell lines. (A) Expression of HA-tagged H-RasV12, H-RasV12 effector domain mutants, and Rlf-CAAX in HME16C mammary epithelial cells. In this and subsequent figures, cells infected with the following vectors are indicated as follows: pLRT control (pLRT), H-RasV12 (V12), H-RasV12G37 (G37), H-RasV12S35 (S35), H-RasV12C40 (C40), and Rlf-CAAX (Rlf-CAAX). Cells were treated with 250 ng/mL doxycycline for 72 hours to induce gene expression, and anti-HA (HA tag) and anti-Ras (Ras) western blotting were performed. Erk activation was determined by western blotting for phosphorylated Erk (Phospho-Erk). The blot was subsequently stripped and probed with an anti-Erk2 antibody (Erk2). (B) Ral A activation was determined by a pull-down assay for GTP-bound, activated Ral A (GTP-Ral A). Total Ral A protein from lysates used in the Ral activation assay pull-down was determined by anti-Ral A western blotting (Ral A). (C) Akt activation in cell lysates was assessed by western blotting for phosphorylated Akt (Phospho-Akt). The membrane was stripped and probed with an anti-Akt antibody (Total Akt).
Figure 2
Figure 2
Anchorage-independent growth of HME16C cell lines. (A) Number of soft agar colonies exceeding 100 μM after 21 days of growth for HME16C cell lines infected with pLRT control, H-RasV12, H-RasV12G37, H-RasV12S35, H-RasV12C40, and Rlf-CAAX-expressing constructs. (B) Representative pictures of colony sizes in soft agar assays. Bar represents 200 μm. (C) Anchorage-independent growth of cell lines grown on ultra-low attachment plates treated with DMSO vehicle (left) or 0.25 μM PD153035 (right) measured using the alamar blue assay. RFU, relative fluorescence units of alamar blue product formed.
Figure 3
Figure 3
Anchorage-independent growth of HME16C cell lines after EGFR inhibition. (A) Cell lines, as indicated, were grown in the soft agar assay for 21 days either in the presence of DMSO vehicle or 0.25 μM PD153035 EGFR inhibitor. Scale bar, 200 μm. (B) Number of colonies >100 μm in size for each cell line treated with either DMSO vehicle or 0.25 μM of the EGFR-specific inhibitor PD153035. Statistical analysis was performed using one-way analysis of variance with Bonferroni post-test analysis. NS, not significant, p > 0.05; *, p < 0.0001. (C) Activation of Erk after EGFR inhibition. Cell lines were grown in the presence of DMSO vehicle or 0.25 μM PD153035 for 48 hours, followed by western blotting for phosphorylated Erk (Phospho-Erk). The blot was stripped and probed with an anti-Erk 2 antibody (Erk 2) to verify equal protein loading. The phospho-ERK blot was overexposed in order to reveal minimal levels of protein.
Figure 4
Figure 4
Expression of TDAG51 in HME16C cell lines in the absence or presence of the EGFR inibition. Western blotting of TDAG51 in HME16C cell lines. (A) Twenty-five micrograms of protein from HME16C cellular lysates were resolved by SDS-PAGE and probed with an anti-TDAG51 monoclonal antibody (TDAG51). Equal protein loading was verified by stripping the blot and probing with an alpha tubulin monoclonal antibody (Alpha tubulin). Band intensities were determined using Image J software (NIH, Bethesda, MD) and TDAG51 values were normalized using alpha tubulin values. Fold expression of each band relative to HME16C parental: HME16C parental, 1.0; pLRT, 1.0; V12, 3.0; G37, 2.3; S35, 2.4; C40, 1.3; Rlf-CAAX, 0.9. Similar experiments to that shown were performed 2 additional times with similar results. (B) HME16C cell lines were treated with DMSO vehicle or 0.25 μM PD153035 EGFR-specific inhibitor for 48 hours, and cell lysates were prepared. Twenty five micrograms of protein were resolved by SDS-PAGE and western blotted with anti-TDAG51 mAb (TDAG51). The blot was subsequently stripped and probed with an alpha tubulin mAb (Alpha tubulin). Band intensities were determined using Image J software (NIH, Bethesda, MD) and TDAG51 values were normalized using alpha tubulin values. DMSO-treated cells are indicated by a -, and PD1535035-treated cells are indicated by a +. Fold expression relative to DMSO-treated pLRT: pLRT -(1.0), +(0.2); V12 -(2.3), +(2.6); G37 -(0.8), +(0.3); S35 -(1.4), +(0.9); C40 -(1.1), +(0.6); Rlf-CAAX -(1.6), +(1.0). Similar experiments to that shown were performed 2 additional times with similar results.
Figure 5
Figure 5
TDAG51 expression is induced by ERK pathway activation. HME16C cell lines infected with pLRT empty vector (pLRT), RasV12 (V12), or RasV12S35 (S35) were treated with 0.2% DMSO vehicle or 20 μM PD98059 for 24 hours, followed by western blotting for TDAG51. The blot was stripped and probed with an alpha tubulin monoclonal antibody (Alpha tubulin) to demonstrate equal protein loading. Band intensities were determined using Image J software (NIH, Bethesda, MD) and TDAG51 values were normalized using alpha tubulin values. Fold expression of PD98059-treated relative to DMSO-treated contols: pLRT (0.6); V12 (0.6); S35 (0.3). Similar experiments to that shown was performed 1 additional time with similar results.
Figure 6
Figure 6
Reduction of TDAG51 expression in RasV12 and RasV12S35-infected cells and their anchorage-independent growth. (A) Western blotting of TDAG51 protein (TDAG51) from 5 μg of cellular lysates from non-silencing vector control (pLVTHM) and anti-TDAG51 shRNA (36-1) -expressing cell lines as indicated. The blot was subsequently stripped and probed with an anti-alpha tubulin mAb (Alpha tubulin). Band intensities were determined using Image J software (NIH, Bethesda, MD) and TDAG51 values were normalized using alpha tubulin values. Fold expression of each band relative to HME16C pLRT pLVTHM: pLRT pLVTHM (1.0), 36-1 (0.4); V12 pLVTHM (2.3), 36-1 (1.0); S35 pLVTHM (1.5), 36-1 (0.7). Similar experiments to that shown were performed 2 additional times with similar results (B) Growth of pLVTHM vector control or TDAG51 shRNA-expressing RasV12S35-transduced cells either in the presence of 0.2% DMSO control (left) or 0.25 μM PD153035 (right) in low-attachment plates, assessed by the alamar blue growth assay. RFU, relative fluorescence units. (C) Growth of pLVTHM vector control or TDAG51 shRNA-expressing RasV12-transduced cells either in the presence of 0.2% DMSO control (left) or 0.25 μM PD153035 (right) in ultra-low-attachment plates, assessed by the alamar blue growth assay. RFU, relative fluorescence units.
Figure 7
Figure 7
Cell proliferation is increased in Ras-transformed cell lines with reduced TDAG51 expression. (A) S phase fraction of RasV12S35-expressing (left panel) or RasV12-expressing (right panel) HME16C infected with pLVTHM non-silencing vector control or anti-TDAG51 shRNA 36-1 after 48, 72, 96 or 120 hours growth in ultra-low attachment plates as determined by cell cycle analysis of propidium iodide-stained nuclei. * p < 0.05; **p < 0.01; ***p < 0.001. (B) Incorporation of the nucleoside analogue EdU into cellular DNA measured in RasV12S35-expressing (left panel) or RasV12-expressing (right panel) HME16C infected with pLVTHM non-silencing vector control or anti-TDAG51 shRNA 36-1 after 48, 72, 96 or 120 hours growth in ultra-low attachment plates. Incorporated EdU was quantified by detection of Alexa Fluor 488-labeled EdU in viable single cells by flow cytometry analysis.
Figure 8
Figure 8
LDH release by RasV12S35- or RasV12-expressing HME16C infected with pLVTHM vector or anti-TDAG51 shRNA 36-1. (A) Relative LDH activity released by pLVTHM- or anti-TDAG51 shRNA 36-1-infected RasV12S35 cells was measured in the culture media of cells grown under anchorage-independent conditions in ultra-low attachment plates for the times indicated. * p < 0.05; **p < 0.01; ***p < 0.001. (B) Relative LDH activity released by pLVTHM- or anti-TDAG51 shRNA 36-1-infected RasV12 cells. * p < 0.05.
Figure 9
Figure 9
ERK pathway activation in RasV12 and RasV12S35 cells infected with pLVTHM or anti-TDAG51 shRNA 36-1. RasV12 or RasV12S35 cells infected with either pLVTHM vector control or anti-TDAG51 shRNA 36-1 were grown for 72 hours attached to tissue culture plastic (attached) or in ultra-low attachment plates (anchorage-independent) in the presence of 250 ng/mL doxycycline. ERK pathway activation was measured by determination of phosphorylated Erk1/2 levels by western blotting using an anti-phosphorylated Erk mAb (phospho-Erk). The blot was stripped and subsequently probed with an anti-Erk2 mAb (Erk2).

Similar articles

Cited by

References

    1. van 't Veer LJ, Dai H, Vijver MJ van de, He YD, Hart AA, Mao M, Peterse HL, Kooy K van der, Marton MJ, Witteveen AT, et al. Gene expression profiling predicts clinical outcome of breast cancer. Nature. 2002;415:530–536. doi: 10.1038/415530a. - DOI - PubMed
    1. Bos JL. ras oncogenes in human cancer: a review. Cancer Res. 1989;49:4682–4689. - PubMed
    1. Malaney S, Daly RJ. The ras signaling pathway in mammary tumorigenesis and metastasis. J Mammary Gland Biol Neoplasia. 2001;6:101–113. doi: 10.1023/A:1009572700317. - DOI - PubMed
    1. Mueller H, Flury N, Eppenberger-Castori S, Kueng W, David F, Eppenberger U. Potential prognostic value of mitogen-activated protein kinase activity for disease-free survival of primary breast cancer patients. Int J Cancer. 2000;89:384–388. doi: 10.1002/1097-0215(20000720)89:4<384::AID-IJC11>3.0.CO;2-R. - DOI - PubMed
    1. Abd El-Rehim DM, Pinder SE, Paish CE, Bell JA, Rampaul RS, Blamey RW, Robertson JF, Nicholson RI, Ellis IO. Expression and co-expression of the members of the epidermal growth factor receptor (EGFR) family in invasive breast carcinoma. Br J Cancer. 2004;91:1532–1542. doi: 10.1038/sj.bjc.6602184. - DOI - PMC - PubMed

Publication types

MeSH terms